

Abstract
Hox genes are differentially expressed along the embryonic anteroposterior axis. We used chromatin immunoprecipitation to detect chromatin changes at the Hoxd4 locus during neurogenesis in P19 cells and embryonic day 8.0 (E8.0) and E10.5 mouse embryos. During Hoxd4 induction in both systems, we observed that histone modifications typical of transcriptionally active chromatin occurred first at the 3′ neural enhancer and then at the promoter. Moreover, the sequential distribution of histone modifications between E8.0 and E10.5 was consistent with a spreading of open chromatin, starting with the enhancer, followed by successively more 5′ intervening sequences, and culminating at the promoter. Neither RNA polymerase II (Pol II) nor CBP associated with the inactive gene. During Hoxd4 induction, CBP and RNA Pol II were recruited first to the enhancer and then to the promoter. Whereas the CBP association was transient, RNA Pol II remained associated with both regulatory regions. Histone modification and transcription factor recruitment occurred in posterior, Hox-expressing embryonic tissues, but never in anterior tissues, where such genes are inactive. Together, our observations demonstrate that the direction of histone modifications at Hoxd4 mirrors colinear gene activation across Hox clusters and that the establishment of anterior and posterior compartments is accompanied by the imposition of distinct chromatin states.
Mammalian Hox genes encode a highly conserved family of homeodomain-containing transcription factors that play a fundamental role in specifying positional identity along embryonic axes (23, 24, 32). Thirty-nine Hox genes are organized into four clusters on different chromosomes, with each containing up to 11 genes (24). Since genes at a given locus are all transcribed in the same direction, one can assign 3′ and 5′ ends to each Hox cluster. Importantly, there is a correlation between the genomic location of a specific Hox gene within a cluster and its time and functional domain of expression during development, a phenomenon termed colinearity. Thus, genes located more 3′ in each cluster are expressed in the embryo earlier and in a more anterior position than those located more 5′ in the cluster (8, 15, 27). Altering normal Hox expression results in homeotic transformations and malformations (24, 48), establishing the biological relevance of this tightly controlled expression pattern. Given the integral role of chromatin remodeling in gene regulation, colinear Hox gene activation could be explained in part by a successive 3′ to 5′ conversion from closed to open chromatin along the length of a Hox cluster.
Several upstream regulators of Hox genes have been identified, but little is known about the molecular mechanisms involved in sequential Hox gene activation. Retinoic acid (RA) contributes to the colinear expression pattern of Hox genes in the hindbrain and is implicated in the establishment of the anteroposterior (AP) axis. RA has been shown to be a positive regulator of several Hox genes in transgenic studies (6, 21), and it can induce colinear Hox gene expression when applied to embryonal carcinoma (EC) cells in vitro (39). Furthermore, functional RA response elements (RAREs) have been identified in enhancers of Hoxa1, Hoxb1, Hoxa4, Hoxb4, and Hoxd4 (9, 14, 18, 25, 30, 38, 49, 51).
Hoxd4, a member of paralog group 4 and an ortholog of the Drosophila Deformed gene, is expressed in mesodermal tissues and in the central nervous system (CNS), with anterior boundaries between somites 4 and 5 and between rhombomeres 6 and 7 (r6/7), respectively (11-13). Previous work has characterized a 5′ mesodermal enhancer, which contains an active RARE, and an autoregulatory element (ARE), both of which are functional in P19 EC cells (40, 41). Moreover, transgenic studies have mapped a 3′ neural enhancer that is absolutely necessary for Hoxd4 expression in the CNS (34, 52). An active DR5-type RARE has been identified as a critical component of the neural enhancer and has been shown to be required for both the initiation and maintenance of Hoxd4 expression in the neurectoderm (51). Genetic disruption of RA biosynthesis or a mutation of the RARE in the 3′ neural enhancer abolishes Hoxd4 expression in the CNS, highlighting the importance of retinoids as Hoxd4 regulators (36, 37, 51).
Two Hoxd4 transcriptional initiation sites, corresponding to a downstream (P1) and an upstream (P2) promoter, have been mapped in the mouse embryo (12) and are located 1.1 and 5.2 kb upstream of the coding region, respectively. Transcripts originating from P1 are present in the neural tube, with an anterior border at r6/7 that is localized anteriorly to r5/6 after an RA treatment of embryonic day 9.5 (E9.5) embryos. P2 transcripts have a more posterior border and are less responsive to RA (12). This suggests that transcripts originating from P1 are more active in anterior domains of Hoxd4 expression and are therefore more responsive to the 3′ neural enhancer.
Recently, the role of chromatin remodeling and histone modification during gene activation has come under intense investigation. Histone phosphorylation and hyperacetylation are associated with an open state of chromatin (for reviews, see references 1, 10, and 19). In addition, methylation of lysine 4 of histone H3 correlates with active chromatin and prevents the binding of transcriptional repressors to histone H3 (50). On the other hand, methylation of the histone H3 tails at lysines 9 and 27 marks silenced chromatin (19, 35). Although histone modification has been correlated with Hox gene activation status (3, 33), little is known concerning chromatin changes accompanying Hox gene activation or repression during embryonic development.
To investigate the role of chromatin modifications in the control of Hoxd4 expression in the CNS, we studied Hoxd4 transcriptional activation in neurally differentiating P19 cells and in E8.0 and E10.5 mouse embryos. We show that RA-treated P19 cells induce the Hoxd4 message and protein and that Hoxd4 transcription initiates at the same start sites as those used in the mouse embryo. Stable transfections revealed that cooperation between the Hoxd4 neural enhancer and promoter is necessary to drive lacZ reporter gene expression. Chromatin immunoprecipitation (ChIP) assays with differentiating P19 cells and mouse embryos revealed that histone modification accompanying gene activation initiates at the enhancer before becoming detectable at the promoter. Differences in the boundaries of histone modifications across the Hoxd4 locus in the mouse embryo suggest that open chromatin is first established at the enhancer and then spreads 5′ to encompass the promoter. Our results demonstrate that anterior and posterior embryonic compartments are distinguished by differential chromatin modification at the Hoxd4 locus.
MATERIALS AND METHODS
Plasmid constructs.
pSNlacZpA, pSHlacZpA, and the pPolyIII-I empty vector were described previously (51). The pBSd4P1 plasmid, which was used to generate an RNase protection probe, was constructed by subcloning a DNA fragment spanning the Hoxd4 start site that was characterized in the mouse embryo (12). This 186-bp fragment was obtained by a PCR with the oligonucleotides listed in Table 1 and with the pSXHoxd4 (41) plasmid as a template. After PCR and sequencing, the fragment was digested with KpnI at its 5′ end and left blunt at the 3′ end, yielding a 159-bp fragment. pBluescript was digested sequentially with KpnI and EcoRV and then was ligated to the 159-bp PCR product.
TABLE 1.
DNA sequences of oligonucleotides used for real-time PCR and RT-PCR
| Gene | Sense primer (5′-3′) | Antisense primer (5′-3′) | Product size (bp) |
|---|---|---|---|
| Hoxd4 promoter P1a | CTGGGTAGGACCCGAGGTTG | GGCTGTACAATTTCACCAGGC | 186 |
| Hoxd4 5′ UTRb | CTGAGTGTAAAGCCAGAGAGC | GTTCTGAGTCTGGTGGCTGAG | 254 |
| 1st coding exona | GCCGCCCAACTTTATTCAGTTG | TAGCCACCCTGCAAATATTCC | 190 |
| Introna | GTAGGGGCTTGTGCAGCTTC | AGGTCCTTGTTTTGCTCTGCG | 183 |
| Hoxd4 homeoboxa,b | CTACACCAGACAGCAAGTCC | CTATAAGGTCGTCAGGTCCG | 280 |
| Hoxd4 3′ UTRa | CTTGGCGAGTCATTAAACTCC | CCAGAAAGTTCTGGGATTCTG | 223 |
| Hoxd4 3′ enhancera | CCTGCATTATTTGCGTCATTG | GGGTTTAGAGGTCAGTCCTCC | 207 |
| gapdh NAD-binding domaina,b | AACGACCCCTTCATTGAC | TCCACGACATACTCAGCAC | 191 |
| nestinb | CAGATGTGGGAGCTCAATCG | GCCTCCTCGATGGTCCGCTC | 296 |
Used for real-time PCR.
Used for RT-PCR.
Cell culture, differentiation, and transfections.
P19 mouse EC cells were cultured in alpha minimal essential medium supplemented with 10% fetal bovine serum. For differentiation, cells were aggregated in bacterial petri plates at a density of 105 cells/ml and treated with 0.3 μM RA for 96 h, with subculturing after 48 h in fresh medium with RA. On day 4, the aggregates were transferred to cell culture plates and RA was eliminated from the medium. Stable transfection was done by the CaPO4 coprecipitation method, as described previously (45). Briefly, cells were seeded at a density of 3 × 10⁵ cells/10-cm-diameter plate. Twenty-two hours later, the medium was changed, and 2 h after that, the cells were transfected with a total of 15 μg of DNA containing 9 μg of the reporter pSNlacZpA or pSHlacZpA or the vector pPolyIII-I as well as 1 μg of a phosphoglycerate kinase 1 promoter-driven puromycin resistance vector and 5 μg of pCAB-B17 (31) as the carrier DNA. Beginning at 40 h posttransfection, cells were selected with 2 μg of puromycin/ml for at least 10 days.
Enzymatic assays.
β-Galactosidase plate assays were performed after fixation of the cells with 2% formaldehyde-0.2% glutaraldehyde in phosphate-buffered saline (PBS) for 5 min at 4°C. The cells were washed three times with PBS and then stained at 37°C with a solution containing 5 mM potassium ferrocyanide, 5 mM potassium ferricyanide, 1 mg of X-Gal (5-bromo-4-chloro-3-indolyl-β-d-galactopyranoside)/ml, and 2 mM MgCl2 in PBS for 3 to 5 h at 37°C. For liquid assays, the cells were washed once and harvested in PBS, collected by a brief spin at room temperature, resuspended in 50 μl of Triton solution (1% Triton, 100 mM KPO4, 1 mM dithiothreitol), and centrifuged for 5 min at 4°C. The supernatant was collected, and 20 μl of the cell lysate was incubated with 1 ml of reaction buffer (60 mM Na2HPO4, 40 mM NaH2PO4, 10 mM KCl, 1 mM MgCl2, 50 mM β-mercaptoethanol) and 200 μl of 2-mg/ml o-nitrophenyl-β-d-galactopyranoside at 37°C for 3 to 5 h. Reactions were stopped with 500 μl of 1 M Na2CO3, and the absorbance at 420 nm was measured. The resulting values were normalized to protein concentrations.
RNA extraction and RT-PCR.
Total RNA extraction from P19 cells was performed by the use of Trizol (Gibco-BRL) according to the manufacturer's instructions. For the removal of contaminating genomic DNAs, extracted RNAs were treated with DNase I (MBI Fermentas) for 1 h at 37°C, followed by heat inactivation at 65°C for 10 min. Reverse transcription (RT) was performed by the use of Superscript II (Invitrogen) according to the manufacturer's instructions. For first-strand cDNA synthesis, 1 μg of RNA was incubated with 500 ng of oligo(dT) and a 2 mM concentration of each deoxynucleoside triphosphate at 65°C for 5 min, followed by 50 min at 42°C for the RT reaction and 15 min at 70°C for reaction inactivation. PCRs were performed with Taq DNA polymerase (MBI Fermentas) supplied with 1.5 mM MgCl2, a 0.2 mM concentration of each deoxynucleoside triphosphate, a 0.4 μM concentration of each primer (Table 1), and 10% (vol) of the reverse-transcribed cDNA in a 50-μl volume; the reactions were done for 35 cycles in an MJ Research PTC-200 thermal cycler. PCR products were run in a 1.5% agarose gel and visualized by ethidium bromide staining.
RNase protection assays.
RNase protection assays were performed as described previously (43). A 448-nucleotide (nt) [α-32P]CTP-labeled probe was transcribed in vitro with T7 RNA polymerase (Pol), with a 600-bp PvuII fragment of the pBSd4P1 plasmid as a DNA template. The probe was incubated with 20 μg of total RNA overnight at 45°C. RNase A or RNase T1 digestion was performed as described previously (43).
ChIP and real-time PCR.
ChIP experiments were performed according to a protocol provided by Upstate Biotechnology. For ChIP with P19 cells, 106 cells were used per immunoprecipitation. Briefly, the cells were cross-linked with 1% formaldehyde, collected, and washed twice with ice-cold PBS containing protease inhibitors (1 mM phenylmethylsulfonyl fluoride, 1 μg of aprotinin/ml, and 1 μg of pepstatin A/ml). The cells were resuspended in 200 μl of sodium dodecyl sulfate (SDS) lysis buffer on ice for 10 min and then sonicated with 10 sets of 10-s pulses by a Betatec Sonics Vibra Cell sonicator to an average DNA size of 600 bp. For ChIP performed with mouse embryonic tissues, we followed a protocol established by the Farnham laboratory (http://mcardle.oncology.wisc.edu/farnham/protocols/tissues.html). E8.0 and E10.5 embryos were cross-linked with 1% formaldehyde diluted in serum-free Dulbecco's modified Eagle's medium (DMEM) for 15 min at room temperature. The cross-linked embryos were washed three times with PBS containing protease inhibitors for 10 min at room temperature. The E8.0 embryos were dissected into anterior (head) and posterior (trunk) regions, as indicated in Fig. 7A. The E10.5 embryos were mildly digested with 0.5% trypsin in Ca2+-free DMEM containing 20 mM HEPES for 25 min at 4°C in order to finely dissect the neural tube from the developing somites and other embryonic tissues. After a wash step with Ca2+-containing DMEM, fine forceps were used to separate the neural tube from the neighboring tissue under a dissecting microscope. A section was then made with a razor blade at the base of the otic vesicle, parallel to the r6/7 boundary, separating most of the spinal cord tissue from the head. The cells (106) were lysed for 15 min on ice in 1 ml of cell lysis buffer [5 mM piperazine-N,N′-bis(2-ethanesulfonic acid) (PIPES; pH 8.0), 85 mM KCl, 0.5% NP-40], pelleted, and incubated with 200 μl of SDS lysis buffer for an additional 20 min on ice to release the chromatin. Chromatin samples were then sonicated with 10 sets of 10-s pulses by a Betatec Sonics Vibra Cell sonicator to an average DNA size of 600 bp. From this step on, ChIP with chromatin samples obtained from embryos and from P19 cells was performed similarly. The chromatin was precleared with salmon sperm DNA-protein A-agarose beads for 1 h, followed by an overnight incubation with different antibodies. For each experiment with P19 cells, we used 10 μg of antibody per 1 million cells. However, for E8.0 and E10.5 embryos, 2.5 × 10⁵ and 5 × 10⁵ cells, respectively, and 2.5 to 5 μg of antibody were used per experiment. Chromatin-antibody complexes were collected by reincubation for 1 h with protein A-agarose beads. Washes were performed according to the manufacturer's protocol. Chromatin was eluted from the beads and cross-links were reversed at 65°C for 4 h. DNAs were phenol-chloroform extracted and ethanol precipitated. Five percent (by volume) of the immunoprecipitated material was used as a template for real-time PCR by use of a SYBR Green Taq ReadyMix kit for quantitative PCR from Sigma and a Roche LightCycler. PCR products were run in 1.5% agarose gels and visualized by ethidium bromide staining. Quantification of the LightCycler data measured the relative amounts of initial target sequence and expressed them as a percentage of the input. Standard curves of serially diluted target sequences were used for quantification. The sequences of primers used for PCRs are presented in Table 1.
FIG. 7.

Histone H3 and H4 modifications and CBP and RNA Pol II recruitment at Hoxd4 regulatory elements and intervening sequences in E8.0 and E10.5 embryos. (A) Total cell extracts were prepared from anterior (A) and posterior (P) regions of E8.0 embryos (left) as well as from the heads (H) and dissected spinal cords (SC) of E10.5 embryos (right). Western blot analysis performed on these extracts with a polyclonal anti-HOXD4 antibody revealed the expected absence of HOXD4 protein in both anterior and posterior E8.0 embryos (left) and its presence in the spinal cords but not the heads of E10.5 embryos. Arrows denote the sites of incision separating anterior or head tissues from posterior or spinal cord tissues. (B) ChIP assays were performed with the indicated antibodies on cross-linked chromatin samples from E8.0 anterior and posterior tissues as well as from heads and spinal cords of E10.5 embryos.
Total cell extracts and immunoblotting.
Total P19 cell extracts were prepared as described previously (42). Twenty-microgram samples of total cell extracts were run in SDS-10 or 12% polyacrylamide gels and transferred to nitrocellulose membranes. The membranes were blocked for 1 h at room temperature in 5% nonfat milk powder and 0.1% Tween 20 in PBS (PBS-T). Incubation with the primary antibody was performed either for 2 h at room temperature or overnight at 4°C, and the membranes were subsequently washed in 0.1% PBS-T. Incubation with a horseradish peroxidase-conjugated secondary antibody was done for 45 min at room temperature, followed by washing with 0.1% PBS-T. Bound immunoglobulins were visualized with an enhanced chemiluminescence detection system (Mendel Biotech). The membranes were then stripped and reprobed with an antiactin antibody as a loading control.
Antibodies.
An anti-HOXD4 rabbit polyclonal antibody was raised against the HOXD4 N terminus and affinity purified against the full-length protein. The specificity of the antibody was tested by immunoblotting against the full-length in vitro-translated HOXD4 protein. The antinestin monoclonal antibody used for this study is a supernatant immunoglobulin G (IgG) obtained from the Developmental Studies Hybridoma Bank, University of Iowa. Anti-diacetyl-Lys9/14 histone H3, anti-phospho-Ser10-acetyl-Lys14 histone H3, anti-phospho-RNA Pol II, anti-dimethyl (Lys4) histone H3, and anti-acetyl-Lys4/7/11/15 histone H4 antibodies were purchased from Upstate Biotechnology. The anti-actin AC40 antibody was purchased from Sigma.
RESULTS
Hoxd4 expression is induced in RA-treated P19 cells, and transcription originates from the correct start sites.
We initially used murine P19 EC cells to investigate histone modifications accompanying Hoxd4 activation during neural differentiation. It has been well documented that RA treatment induces P19 cell aggregates to differentiate down the neural pathway (44a). This differentiation was morphologically evident by day 5 after an initial RA exposure (Fig. 1A). To confirm the differentiation at the molecular level, we studied the transcript and protein expression of the neural marker nestin. As shown by RT-PCR, nestin transcripts were detectable at day 2 and peaked between days 3 and 5 (Fig. 1B). Moreover, the nestin protein followed a similar increase in response to RA, accumulating shortly after induction of the mRNA (Fig. 1C), which confirms that P19 cells correctly undergo neural differentiation in our hands.
FIG. 1.

RA induces neural differentiation in aggregated P19 cells. (A) Morphology of P19 cells grown in monolayers (−RA) or as aggregates in the presence of 3 × 10⁻⁷ M RA (+RA) (day 5). (B) RT-PCRs with total RNAs from neurally differentiating P19 cells assayed daily for 7 days. Primers specific for the nestin or gapdh coding region were used for PCRs in the presence or absence of RT. (C) Western blot analysis of total P19 cell extracts treated as described for panel B and probed with antinestin and antiactin antibodies.
To correlate changes in chromatin with the dynamics of gene activation, we investigated the expression pattern of Hoxd4 at the levels of transcript and protein in these cells after RA treatment. RT-PCR was performed with primers spanning either the Hoxd4 5′ untranslated region (UTR) or the Hoxd4 homeobox in the second coding exon (Fig. 2A) (11). As expected (11), Hoxd4 was not expressed in undifferentiated P19 cells (cultured in monolayers) but was induced as early as day 1 after an RA treatment of aggregates, peaking between days 3 and 4 (Fig. 2B). The levels of gapdh transcripts were also assayed by RT-PCR and were shown to be constant throughout the culture period. Moreover, HOXD4 protein expression was also induced by day 1 after the RA treatment and peaked by day 3 (Fig. 2C). The absence of detectable HOXD4 at day 7, despite the persistence of the message, suggests that the protein is less stable at later stages of in vitro differentiation.
FIG. 2.

Hoxd4 mRNA and protein are induced in P19 cells during neural differentiation. (A) Diagram of Hoxd4 locus and transgenes. Black and gray boxes refer to coding regions and the homeobox, respectively. Open boxes correspond to regulatory regions, as indicated. (B) RT-PCRs were performed with total RNAs extracted from P19 cells as described for Fig. 1B. Primers specific for the Hoxd4 5′ UTR and coding sequence or for the gapdh coding region were used for PCRs in the presence or absence of RT. (C) Western blot analysis with the indicated antibodies of cell extracts from P19 cells at different time points after treatment with RA. (D) RNase protection assay with P19 cell RNAs over a 7-day differentiation period with a 448-nt probe spanning the Hoxd4 embryonic transcriptional start sites. T, tRNA control; E, total RNA from E11.5 mouse embryos.
The Hoxd4 transcriptional start sites have been mapped in the mouse embryo (12). To verify that the same start sites are used in P19 cells, we performed RNase protection experiments with a probe spanning the Hoxd4 5′ UTR. Total RNAs from P19 cells were collected over a time course of 7 days after the initial RA exposure. The assay was carried out with a 448-nt body-labeled RNA probe spanning the cluster of start sites used by the major downstream (P1) promoter in mouse embryos (12). As shown in Fig. 2D, protections of 125, 124, 123, and 122 nt were obtained when the probe was hybridized with total RNAs obtained from E11.5 mouse embryos, which corresponded to the cluster of four previously determined transcriptional start sites (12). Importantly, identical protections were observed when the probe was hybridized with total RNA samples from RA-treated P19 cell aggregates (Fig. 2D), while no signal was detected with tRNAs or total RNAs from untreated cells. The protection was apparent as early as day 1 after RA treatment and peaked at day 4, in agreement with the transcript accumulation observed by RT-PCR (Fig. 2B). These data show that Hoxd4 expression is induced in neurally differentiating P19 cells and that transcription initiates at embryonic start sites (12). Moreover, the data suggest that the RA-responsive P1 promoter (12) is predominant in P19 cells.
Cooperation between Hoxd4 neural enhancer and promoter in P19 cells.
Previous work identified a 700-bp Hoxd4 3′ neural enhancer that sets the correct anterior expression border in the hindbrains of transgenic mouse embryos (34, 51). This enhancer activity was shown to be greatly augmented in mouse embryos when it was coupled to the Hoxd4 promoter rather than to a heterologous β-globin promoter (37). To determine whether this enhancer-promoter cooperation is manifested in culture, we stably transfected P19 cells with constructs containing the Hoxd4 neural enhancer plus promoter (pSNlacZpA), the Hoxd4 promoter alone (pSHlacZpA), or an empty vector (negative control). The constructs carried the lacZ gene in the first coding exon of Hoxd4 (Fig. 2A) (52), which permitted the use of β-galactosidase for assessments of expression levels. Stably transfected P19 cells were cultured as aggregates in the presence or absence of 0.3 μM RA. As shown in Fig. 3A, only cells transfected with pSNlacZpA (containing both the enhancer and the promoter) showed significant lacZ expression after RA exposure. This expression was detectable both in the number of positive aggregates (Fig. 3B) and in the percentage of expressing cells within each aggregate (data not shown). Expression was detectable at day 1, increased dramatically during days 2 to 3, and peaked by day 4. Cells containing either pSHlacZpA or the empty vector did not express lacZ in the presence or absence of RA (Fig. 3A and B). The results were quantified with a β-galactosidase liquid assay (Fig. 3C). The results show that, as in the embryo, the 3′ neural enhancer is absolutely required to drive expression from the Hoxd4 promoter in neurally differentiating P19 cells.
FIG. 3.

Expression of Hoxd4 lacZ reporter constructs in stably transfected P19 cells, as detected by β-galactosidase assays. (A) β-Galactosidase plate-staining assay of P19 cells stably transfected with pSNlacZpA (1), pSHlacZpA (2), or the pPoly III vector (3). The cells were cultured in monolayers or aggregates in the presence or absence of 0.3 μM RA. (B) Percentages of P19 cell aggregates, cultured as described for panel A, that were positive in a β-galactosidase plate-staining assay. The data are from one experiment that was repeated with similar results. Note that besides the curve for plasmid 1 plus RA, all of the other curves overlap (with values between 0 and 0.5). (C) β-Galactosidase liquid assay with P19 cells, as described for panel A. The data are from one experiment that was repeated with similar results.
Chromatin modification initiates at Hoxd4 neural enhancer during transcriptional activation.
One mechanism by which transcription factors alter gene activity occurs via effects on chromatin structure (17). This is accomplished, in part, by the modification of N-terminal histone tails by specialized modifying enzymes (1). In general, histone tail phosphorylation, acetylation, and H3 methylation at lysine 4 are markers of an active, “open” chromatin state that is accessible to transcription factors and the transcriptional machinery (1, 10, 19). On the other hand, histone deacetylation and H3 methylation at lysines 9 and 27 are markers of an inactive, “closed” state (1, 35).
To assess the state of chromatin at the Hoxd4 locus before and after gene activation in P19 cells, we conducted ChIP experiments over a 5-day time course of RA treatment, spanning the peaks of Hoxd4 transcript and protein accumulation. We immunoprecipitated chromatin samples with antibodies against phospho-Ser10-acetyl-Lys14 histone H3 (PhAcH3), diacetyl-Lys9/14 histone H3 (AcH3), and acetyl (Lys4/7/11/15) histone H4 (AcH4) as markers of open chromatin states. To determine the temporal recruitment of a histone acetyltransferase (HAT) to the Hoxd4 locus, we used an antibody against CBP. RNA Pol II recruitment was also investigated by use of an antibody recognizing both phosphorylated and unphosphorylated forms of the protein. After purification of the immunoprecipitated DNA, real-time PCRs were performed with primers spanning the Hoxd4 neural enhancer, the proximal promoter, and four sites within the intervening regions (Fig. 4A). In some experiments, the amplified material was recovered during the linear phase and visualized in ethidium-bromide-stained agarose gels (Fig. 4B) These gels allowed for qualitative comparisons of the same chromatin modification at the same DNA locus, but they were not quantitative. Therefore, relative starting materials from multiple experiments were also quantitated with LightCycler software and were plotted as percentages of the input (Fig. 5).
FIG. 4.

Histone modifications, CBP recruitment, and RNA Pol II interaction at Hoxd4 3′ enhancer precede those at the promoter in P19 cells. (A) Schematic diagram of regions from the Hoxd4 locus that were tested in ChIP experiments. (B) ChIP experiments were performed with antibodies against the indicated proteins. PCR products corresponding to the Hoxd4 3′ enhancer, 3′ UTR, homeobox, intron (between the only two coding exons), exon 1 (the first coding region), promoter, and gapdh coding region were generated from an aliquot of total chromatin (input), a control immunoprecipitation with no antibody (No Ab), or immunoprecipitated material. The data show the results of one experiment of at least three independent experiments giving comparable results. For each PCR, serial dilutions of a standard (containing each of the Hoxd4 regulatory regions in a plasmid) with known concentrations were used at the same time to quantitate the starting amount of target sequence in each individual sample.
FIG. 5.

Quantification of LightCycler data obtained with P19 cells. Values are expressed as percentages of the corresponding input. The data are presented as means ± standard errors of the means and are typically from three to five independent experiments. In a small minority of cases, values are from two experiments.
As shown in Fig. 4 and 5, H3 phospho-acetylation at both the Hoxd4 promoter and the Hoxd4 enhancer, as well as the intervening sequences, was triggered by the RA treatment of P19 aggregates. Although the histone H3 phospho-acetylation was transient in the enhancer and the intervening regions, it persisted at the promoter, perhaps because of a second peak of Hoxd4 transcript and protein induction beyond day 5 (data not shown). After or concurrent with phospho-acetylation, the levels of H3 diacetylation and histone H4 tri- and tetra-acetylation were dramatically increased at the Hoxd4 locus, indicating a transition from a closed to an open chromatin state. Interestingly, H3 diacetylation at the enhancer increased sharply at day 1 and stayed elevated up to day 3. This was earlier than such changes occurred at the 3′ UTR (day 2), which in turn preceded the corresponding peak at exon 1 and the promoter (day 3). While high levels of H3 diacetylation at both the enhancer and the promoter were transient, the decrease in H3 diacetylation at the promoter was delayed, maintaining the temporal shift in chromatin events at these two regions. Moreover, despite the transient histone H3 modifications at the enhancer, histone H4 acetylation (which peaked during days 1 to 3) was not completely lost at the enhancer, indicating that it remained in an open chromatin state.
To investigate the global histone modifications induced by RA in P19 cells, we performed immunoblots with P19 cell extracts. After RA treatment of P19 cells, there was no significant change in histone H3 diacetylation (Fig. 6A), but histone H3 phospho-acetylation slightly increased on day 1, peaked at day 3, and stayed elevated up to day 5. This indicates that histone acetylation detected at the Hoxd4 locus is not the result of a global increase in histone H3 acetylation and that the bulk of histone H3 phospho-acetylation, although it increased (peaking at day 3), did not reflect the same peak of increase within the Hoxd4 locus (peaking at days 1 to 2).
FIG. 6.
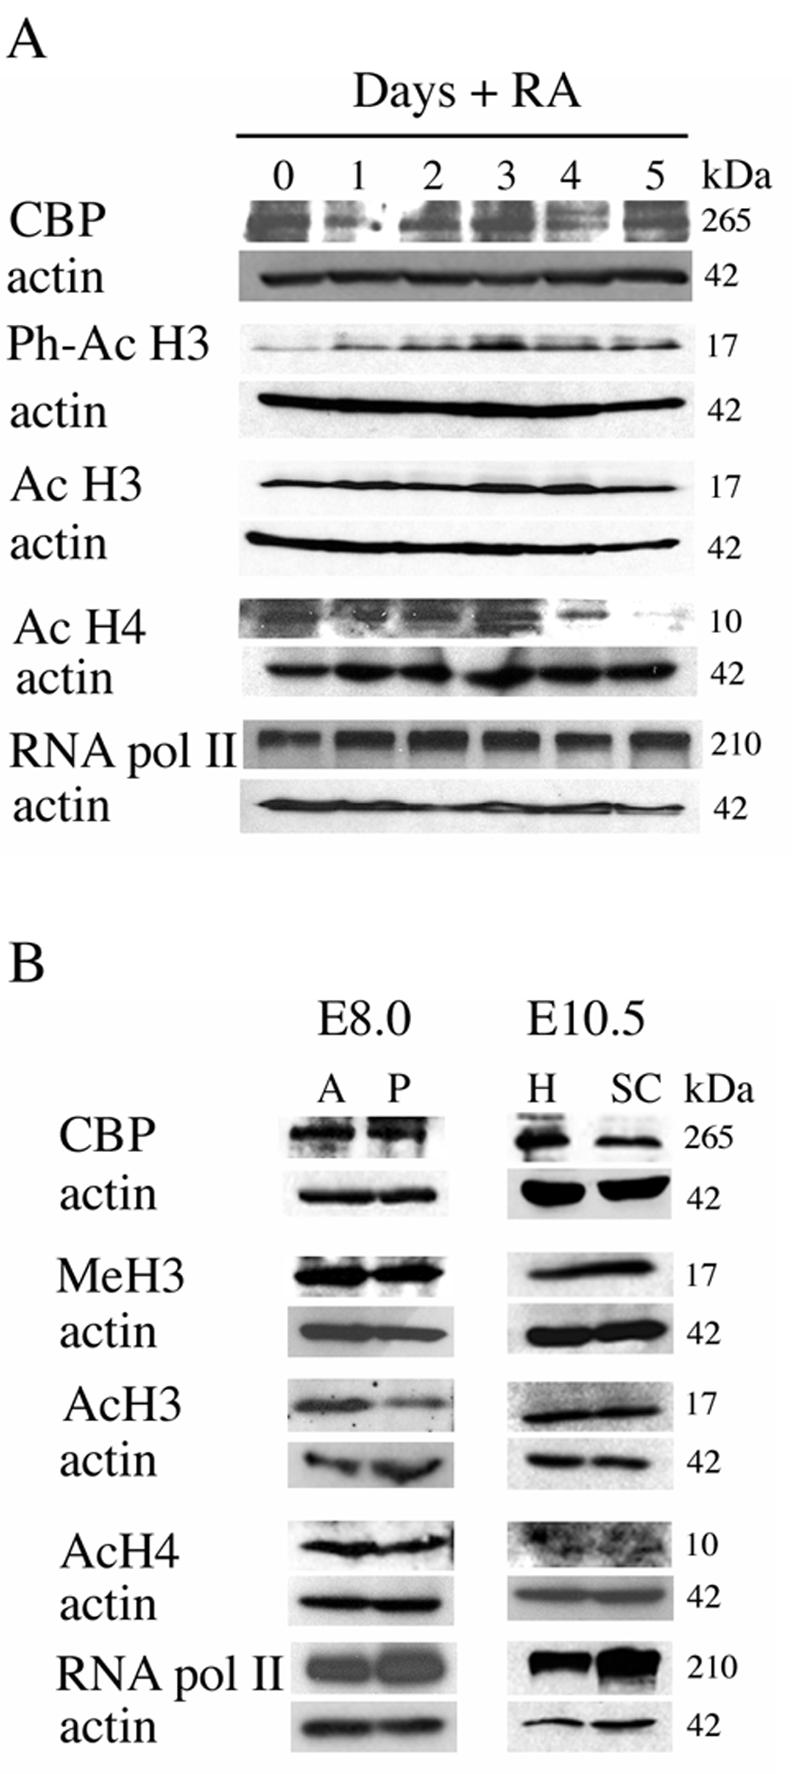
Western blot analysis of total cell extracts from P19 cells or E8.0 and E10.5 embryos. (A) Western blots of total P19 cell extracts treated with RA for a period of 5 days and probed with the indicated antibodies. (B) Western blots of total cell extracts from the anterior (A) or posterior (P) tissues of E8.0 embryos or the heads (H) and spinal cords (SC) of E10.5 embryos probed with the indicated antibodies. Western blots were stripped and reprobed for actin as a loading control.
CBP was significantly recruited to the enhancer by day 1 (peaking at day 1) and to the intervening sequences over days 1 to 3, and it finally peaked at the promoter at day 3, indicating a sequential association beginning at the 3′ part of the locus (Fig. 4B and 5). This was not due to an increase in total CBP protein, which did not change during the course of P19 differentiation (Fig. 6A). These results, together with our transfection data, suggest a functional cooperation at the level of chromatin remodeling between the Hoxd4 enhancer and the proximal promoter and imply a dependence on the enhancer for sustained histone modification at the promoter.
Recent data demonstrated that components of the transcriptional machinery, including RNA Pol II, can be positioned at transcriptional start sites of inactive genes (20). This is in contrast to what we observed for the Hoxd4 proximal promoter, to which RNA Pol II was recruited only after RA-induced gene activation (Fig. 4B and 5). We also detected an interaction between the neural enhancer and RNA Pol II, but only after treatment with RA. Interestingly, the RNA Pol II association was first detected at the enhancer (with a significant association at day 1) and only subsequently at the promoter (Fig. 5). RNA Pol II arrival at the intervening sequences was concurrent or subsequent to recruitment to the promoter (perhaps as a result of active transcription). These recruitment profiles were not due to a global increase in the levels of RNA Pol II (Fig. 6A). Therefore, our results show that histone modifications and CBP recruitment at the Hoxd4 locus occur first at the 3′ part of the locus. Moreover, they show an RNA Pol II association at the 3′ enhancer, the proximal promoter, and the intervening sequences. Interestingly, RNA Pol II continued to associate with the Hoxd4 neural enhancer and the P1 promoter through day 5, after histone acetylation at both regions had dropped significantly (Fig. 4B and 5). This is consistent with the sustained detection of Hoxd4 transcripts through day 7 of differentiation (Fig. 2B) and beyond (data not shown).
Chromatin remodeling at Hoxd4 regulatory elements in the embryonic CNS.
To determine whether altered chromatin states also accompany Hoxd4 gene activation and silencing in the developing mouse embryo, we performed a series of ChIP experiments with chromatin samples from the CNS of E10.5 mouse embryos. As stated previously, the expression of Hoxd4 transcripts in the CNS begins around E8.25, with an anterior boundary at the r6/7 junction in the developing hindbrain (11, 13). For our ChIP experiments, E10.5 embryos were divided at the r6/7 boundary into head and trunk regions, followed by fine dissection of the spinal cord from the trunk. We used the spinal cord (Hoxd4 active) and the entire head region (Hoxd4 inactive) for the extraction of chromatin samples. High levels of methylation at lysine 4 and of H3 diacetylation (markers of open chromatin), as well as of tri- and tetra-acetylation at histone H4, were evident in the spinal cord at the Hoxd4 promoter, the neural enhancer, and the intervening sequences (Fig. 7B and 8). This was in contrast to the low levels of these modifications at the same Hoxd4 regulatory regions in the head, where Hoxd4 is inactive. Based on the association of CBP with Hoxd4 regulatory elements in P19 cells during gene activation, we decided to investigate whether CBP could be implicated in the acetylation events in the embryo. ChIP experiments with an anti-CBP antibody revealed a strong interaction at the Hoxd4 promoter, enhancer, and intervening sequences within the spinal cord, suggesting that a common mechanism is involved in chromatin opening at these regions.
FIG. 8.

Quantification of LightCycler data obtained with embryonic tissues. PCR amplification and quantification were done as described in the legend for Fig. 5.
Finally, we looked at the recruitment of RNA Pol II during Hoxd4 activation (Fig. 7B and 8). RNA Pol II was present at the Hoxd4 proximal promoter in the spinal cord but was absent from the head region, suggesting that the basal transcriptional machinery is not constitutively associated with the promoter but is recruited upon activator binding. As in P19 cells, RNA Pol II was also associated with the neural enhancer and the intervening sequences.
We wished to compare these results to chromatin modifications immediately prior to Hoxd4 activation in the CNS of the mouse embryo. We therefore assayed the Hoxd4 locus at E8.0, an embryonic stage that precedes Hoxd4 activation by a few hours. ChIP experiments with chromatin samples from the anterior part (head) and the posterior part of E8.0 embryos (Fig. 7A) were performed with the same antibodies as those used for E10.5 embryos. Interestingly, in the posterior tissues, the enhancer-proximal 3′ region was associated with the markers of open chromatin, including histone H3 methylation at lysine 4, H3 diacetylation, and H4 tri- and tetra-acetylation. Importantly, we detected CBP interactions only in posterior tissues and only at those enhancer-proximal regions presenting histone H3 and H4 acetylation. The 5′ part of the locus, including the promoter, did not show the markers of an open chromatin state in any part of the embryo (Fig. 7B and 8). These results are in agreement with a model in which histone modification at this locus proceeds 3′ to 5′ during gene activation. We did not detect any association of RNA Pol II with any part of the gene at this developmental stage.
To rule out the possibility that differences in histone modification and coactivator recruitment might be due to global variations in protein levels in the head versus the spinal cord (E10.5) or in anterior versus posterior tissue (E8.0), we performed a Western blot analysis. As shown in Fig. 6B, the extent of H3 and H4 modification and the levels of CBP and RNA Pol II were similar between tissues. The specificity of the results was further confirmed by the invariant levels of these modifications and factors at the gapdh locus (Fig. 7B and 8). Thus, in E10.5 embryos, histone acetylation and the recruitment of CBP and RNA Pol II at the Hoxd4 promoter, the neural enhancer, and the intervening sequences occur only in the Hoxd4-expressing spinal cord, consistent with our observations with neurally differentiating P19 cells. However, at earlier stages of development, the chromatin starts to become open at the 3′ part of the locus, only where it will be expressed later.
DISCUSSION
In vitro neural differentiation provides a system for studying enhancer-promoter cooperativity of Hox genes.
Cultured cells can be used to study chromatin remodeling during differentiation-specific gene expression (16, 47). For this study, we used differentiating P19 EC cells to study chromatin remodeling at Hoxd4 cis-regulatory elements. Undifferentiated P19 cells do not express Hoxd4 (40). Using RT-PCR and RNase protection data (Fig. 2A and C), we showed that Hoxd4 is activated from the correct transcriptional start sites in aggregated P19 cells after RA treatment. We also showed that Hoxd4 mRNA and protein are induced at days 1 to 2, peak at days 3 to 4, and then start to decrease. Our results clearly indicate that the expression of the lacZ reporter is dependent on the 3′ neural enhancer as well as the presence of RA in the culture medium, consistent with requirements for these same components in the mouse embryo (34, 36, 51). Therefore, P19 cells provide a suitable in vitro model for the study of Hoxd4 regulatory regions during neural differentiation.
RA and in vitro induction of Hoxd4 transcription.
RA influences the anterior expression boundary of Hox genes within paralog groups 1 to 4, including Hoxd4, via DR2 or DR5 RAREs (29, 36, 37, 51). A conserved DR5 RARE within the Hoxd4 neural enhancer is a major regulator of Hoxd4 neural expression (34, 37, 51). In vivo mutation of this site completely abolishes Hoxd4 expression in the neurectoderm of E9.5 mouse embryos, similar to removal of the whole neural enhancer (51, 52). Our results show that the deletion of the neural enhancer abolishes reporter expression in RA-treated P19 cell aggregates, consistent with our observations in vivo. Furthermore, the 3′ neural enhancer is required for the RA responsiveness of the P1 promoter, since no response to RA was detected when the enhancer was deleted (Fig. 3). It seems likely, therefore, that the RARE makes the same significant contribution to Hoxd4 expression in P19 cells as in the mouse embryo. This could involve not only the recruitment of HAT coactivators after ligand binding to retinoid receptors, but also the release of histone deacetylase corepressors (7) in cooperation with adjacently bound factors (37).
Order of events at Hoxd4 enhancer and promoter in P19 cells.
We used ChIP assays to order the chromatin remodeling and recruitment events at Hoxd4 regulatory regions during the neural differentiation of P19 cells. Our observations can be usefully compared to chromatin changes during gene activation in an in vitro model of enterocyte differentiation. For both the α1 antitrypsin and HNF-4A genes, RNA Pol II arrives at the promoter well before the initiation of gene expression (16, 47). This is in marked contrast to the complete absence of RNA Pol II at the Hoxd4 promoter prior to gene activation during neural differentiation. This may be explained by the prior commitment of CaCo-2 cells to the enterocyte differentiation pathway, a process which may prime enterocyte-specific gene expression by a prior recruitment of components of the preinitiation complex (16, 47). On the other hand, undifferentiated P19 cells are equivalent to a more pluripotent cell type with the capacity to follow distinct and mutually exclusive developmental pathways. As such, P19 cells would not prime neural gene expression, since they are not committed to neural differentiation prior to aggregation in the presence of RA. In contrast, MCF-7 breast cancer cells do not recruit RNA Pol II to an estrogen-receptor-regulated gene until late in the activation process (46). These results emphasize the variability in chromatin remodeling and recruitment events during transcriptional activation and the importance of assessing the order of these events in different cellular and developmental contexts.
Arguments have been made both for and against a role for H3 phosphorylation in facilitating subsequent acetylation during gene induction (4, 5, 28). Because the anti-H3 antibodies employed here do not recognize the phospho-Ser10 modification in the absence of acetylation, our results do not address this controversy directly. Nonetheless, it is clear that the peak of phospho-acetylated H3 either precedes or coincides with that of the diacetylated form. At the promoter, the peak of phospho-acetylated H3 precedes diacetylation by a full day. Thus, different H3 modifications during Hoxd4 activation are temporally coordinated and may therefore be important to successive stages of gene induction.
Phospho-acetylation and diacetylation modifications at the enhancer precede their counterparts at the promoter by 1 day, suggesting that chromatin remodeling events at the enhancer are required for subsequent modifications of promoter-bound nucleosomes. Background levels of H3 phospho-acetylation and diacetylation are reestablished at the enhancer by days 2 and 4, respectively. In contrast, promoter-bound H3 phospho-Ser10 appears to increase by day 5, perhaps in preparation for a second wave of Hoxd4 expression at later times of P19 differentiation (unpublished observations). Histone H4 acetylation increases dramatically by day 1 at the enhancer. After day 3, we detected a sharp decrease in H4 acetylation across the entire Hoxd4 locus (Fig. 4B and 5). Although Western blotting of the P19 cell extracts showed that global histone H4 acetylation decreases at day 4, this modification is specific for the Hoxd4 locus, since we did not see a similar decrease in the gapdh internal controls.
RNA Pol II follows a sequence similar to the phospho-acetylation and diacetylation events, with the first significant recruitment to the enhancer and promoter occurring at days 1 and 2, respectively. However, the RNA Pol II interaction only peaked at the intervening sequences in parallel with or subsequent to its recruitment to the promoter (Fig. 5).
After maximal binding to both the enhancer and the promoter, RNA Pol II is maintained at these regions well above background levels throughout the assay. In contrast, H3 acetylation as well as H4 acetylation fall to starting levels by day 5. These results suggest that continued histone acetylation is not required for the presence of RNA Pol II at these regulatory regions. This could be explained if only the initial recruitment of RNA Pol II was dependent on histone acetylation and chromatin remodeling events; however, if remodeling were stable once established or if subsequent events were to obviate the need for specifically remodeled states, then continued histone modification would be unnecessary for transcriptional reinitiation. This would further imply the release and/or inactivation of the responsible kinase(s) and HAT(s). These results are consistent with events at the α-antitrypsin and HNF-4A genes during enterocyte differentiation, to which the remodeling component hBRG is recruited during gene activation but is released during subsequent reinitiation (16, 47).
As seen with P19 cells and E10.5 embryos, the higher levels of RNA Pol II at both regulatory regions than at the four intervening sites could be explained by transcriptional pausing or multiple rounds of abortive initiation. The CBP recruitment profile is distinct from that of histone acetylation and RNA Pol II, arguing against the use of a preformed CBP-Pol II-containing holoenzyme during Hoxd4 activation. Similar conclusions have been drawn for other systems (9). The data likewise suggest that CBP is not primarily responsible for the histone acetylation events that we detected at this locus. The recruitment of additional HATs is likely.
Directional chromatin remodeling at the Hoxd4 locus of the mouse embryo.
The sequential order of Hox gene activation in the embryonic trunk occurs 3′ to 5′ along each Hox cluster and corresponds to the distribution of expression domains along the AP axis, a phenomenon known as colinearity (8, 15, 27). Although Hox gene transplantation and transgenic studies suggest that colinearity is independent of the cluster context, two studies have implicated cluster-specific mechanisms in this process (22, 44). Here we report that histone modifications at the Hoxd4 locus in differentiating P19 cells and in mouse embryos occur first at the 3′ enhancer and only subsequently at the promoter, located further 5′. It remains to be determined whether this 3′ to 5′ pattern is simply explained by the 3′ location of the neural enhancer or if it also reflects cluster-specific chromatin-opening mechanisms that are required for colinear gene expression across Hox clusters.
We used ChIP assays to obtain snapshots of the chromatin modification and recruitment events at E8.0 and E10.5. While such observations are static, they suggest a dynamic spreading of chromatin events at the Hoxd4 locus during embryogenesis. In the posterior E8.0 embryo, when Hoxd4 is not yet expressed in the CNS, the ranges of AcH4, AcH3, and MeH3 are increasingly more 5′, respectively, with all modifications encompassing the enhancer and 3′ UTR at a minimum, but excluding the promoter. By E10.5, however, these modifications span the entire locus, including the promoter (Fig. 9). These findings are consistent with the initiation of chromatin modifications at the enhancer, for which MeH3 is temporally followed by AcH3 and subsequently AcH4. The embryonic recruitment of CBP parallels that of AcH3 but not AcH4, consistent with differential CBP functions with respect to these two substrates and further implicating other HATs in histone acetylation at Hoxd4.
FIG. 9.

Distribution of histone modifications, CBP, and RNA Pol II across the Hoxd4 locus in posterior tissues of E8.0 and E10.5 embryos.
In contrast, for differentiating P19 cells we do not have evidence for a gradual spreading of histone modifications along the intervening chromatin separating the enhancer and the promoter. This may reflect the true timing of events at this locus in P19 cells and could be due to enhancer-bound coactivators acting across the relatively short distances at the Hoxd4 locus as well as to additional enhancers, possibly located within conserved sequences within the intron (2). Additionally, the concentrations of RA used to provoke neural differentiation, while physiological, may nonetheless exceed the amounts normally encountered by Hoxd4 in the embryo; this could provoke an exaggerated recruitment of coactivators by the RXR-RAR heterodimer, thereby extending the chromosomal range of histone modifications. However, it is also possible that the sequential spreading of histone modifications does take place during P19 cell differentiation but that it occurs too rapidly to be captured with the 24-h time points used here.
Chromatin modification and establishment of embryonic compartments.
Embryonic compartments have been defined as cell populations with shared patterns of gene expression (a genetic address) and developmental potential (26). Molecular interactions at the boundaries between two or more compartments are key determinants of the embryonic pattern and can lead to the establishment of so-called organizers, regions that exert critical patterning influences on both sides of the compartment boundary (26). Hox genes establish compartments bearing distinct AP positional identity along the embryonic trunk (and other structures). Most broadly, the development of the embryonic trunk is typified and determined by Hox gene expression, whereas these genes are silent in the head. We have shown that this distinction between anterior, nonexpressing head tissue, and posterior, Hox-expressing spinal cord or trunk tissue is reflected by the state of the chromatin at the Hoxd4 locus. While H3 and H4 at the Hoxd4 locus in the spinal cord bear modifications that are typical of transcriptionally active genes (methylation of lysine 4 and acetylation of lysines 9 and 14 for H3 and tri- and tetra-acetylation for H4), these features are absent from this same locus in nonexpressing head tissue. Additionally, at early stages of development when Hoxd4 is not yet expressed (E8.0), the 3′ part of the locus presents these modifications wherever the gene is fated to become active. The modification of enhancer chromatin at E8.0 thus anticipates the promoter-chromatin modification and Hoxd4 expression at E10.5. The absence of RNA Pol II over the whole locus at E8.0, despite the presence of modified enhancer chromatin, suggests a requirement for additional time-dependent events, such as the later recruitment of chromatin remodeling enzymes.
Our results suggest that the common patterns of gene expression that define embryonic compartments are mechanistically underpinned by shared chromatin profiles. Furthermore, developmental events at compartment boundaries should be accompanied by the imposition of distinct changes to the state of chromatin at select loci.
Acknowledgments
We thank Sabine Cordes, Olivia Novac, and Maria Zannis-Hadjopoulos for key advice on embryo dissections and ChIP assays, Noriko Uetani for help with embryo photography, and the members of the Featherstone laboratory for helpful discussions. The nestin antibody developed by Susan Hockfield was obtained from the Developmental Studies Hybridoma Bank developed under the auspices of the NICHD and maintained by the Department of Biological Sciences, University of Iowa, Iowa City.
M.R. is a recipient of a CIHR Cancer Consortium Training Grant from the McGill Cancer Centre and a Conrad F. Harrington Fellowship from the Faculty of Medicine, McGill University. L.K. is supported by a Canderel studentship from the McGill Cancer Centre. M.F. is a Chercheur-National of the Fond de la Recherche en Santé du Québec. This work was funded by grant 49498 to M.F. from the Canadian Institutes of Health Research (CIHR).
REFERENCES
- 1.Berger, S. L. 2002. Histone modifications in transcriptional regulation. Curr. Opin. Genet. Dev. 12:142-148. [DOI] [PubMed] [Google Scholar]
- 2.Brend, T., J. Gilthorpe, D. Summerbell, and P. W. Rigby. 2003. Multiple levels of transcriptional and post-transcriptional regulation are required to define the domain of Hoxb4 expression. Development 130:2717-2728. [DOI] [PubMed] [Google Scholar]
- 3.Chambeyron, S., and W. A. Bickmore. 2004. Chromatin decondensation and nuclear reorganization of the HoxB locus upon induction of transcription. Genes Dev. 18:1119-1130. [DOI] [PMC free article] [PubMed] [Google Scholar]
- 4.Cheung, P., K. G. Tanner, W. L. Cheung, P. Sassone-Corsi, J. M. Denu, and C. D. Allis. 2000. Synergistic coupling of histone H3 phosphorylation and acetylation in response to epidermal growth factor stimulation. Mol. Cell 5:905-915. [DOI] [PubMed] [Google Scholar]
- 5.Clayton, A. L., and L. C. Mahadevan. 2003. MAP kinase-mediated phosphoacetylation of histone H3 and inducible gene regulation. FEBS Lett. 546:51-58. [DOI] [PubMed] [Google Scholar]
- 6.Conlon, R. A., and J. Rossant. 1992. Exogenous retinoic acid rapidly induces anterior ectopic expression of murine Hox-2 genes in vivo. Development 116:357-368. [DOI] [PubMed] [Google Scholar]
- 7.Dilworth, F. J., and P. Chambon. 2001. Nuclear receptors coordinate the activities of chromatin remodeling complexes and coactivators to facilitate initiation of transcription. Oncogene 20:3047-3054. [DOI] [PubMed] [Google Scholar]
- 8.Duboule, D., and P. Dollé. 1989. The structural and functional organization of the murine HOX gene family resembles that of Drosophila homeotic genes. EMBO J. 8:1497-1505. [DOI] [PMC free article] [PubMed] [Google Scholar]
- 9.Dupé, V., M. Davenne, J. Brocard, P. Dollé, M. Mark, A. Dierich, P. Chambon, and F. M. Rijli. 1997. In vivo functional analysis of the Hoxa-1 3′ retinoic acid response element (3′RARE). Development 124:399-410. [DOI] [PubMed] [Google Scholar]
- 10.Featherstone, M. 2002. Coactivators in transcription initiation: here are your orders. Curr. Opin. Genet. Dev. 12:149-155. [DOI] [PubMed] [Google Scholar]
- 11.Featherstone, M. S., A. Baron, S. J. Gaunt, M. G. Mattei, and D. Duboule. 1988. Hox-5.1 defines a homeobox-containing gene locus on mouse chromosome 2. Proc. Natl. Acad. Sci. USA 85:4760-4764. [DOI] [PMC free article] [PubMed] [Google Scholar]
- 12.Folberg, A., E. N. Kovacs, and M. S. Featherstone. 1997. Characterization and retinoic acid responsiveness of the murine Hoxd4 transcription unit. J. Biol. Chem. 272:29151-29157. [DOI] [PubMed] [Google Scholar]
- 13.Gaunt, S. J., R. Krumlauf, and D. Duboule. 1989. Mouse homeo-genes within a subfamily, Hox-1.4, -2.6 and -5.1, display similar anteroposterior domains of expression in the embryo, but show stage- and tissue-dependent differences in their regulation. Development 107:131-141. [DOI] [PubMed] [Google Scholar]
- 14.Gould, A., N. Itasaki, and R. Krumlauf. 1998. Initiation of rhombomeric Hoxb4 expression requires induction by somites and a retinoid pathway. Neuron 21:39-51. [DOI] [PubMed] [Google Scholar]
- 15.Graham, A., N. Papalopulu, and R. Krumlauf. 1989. The murine and Drosophila homeobox gene complexes have common features of organization and expression. Cell 57:367-378. [DOI] [PubMed] [Google Scholar]
- 16.Hatzis, P., and I. Talianidis. 2002. Dynamics of enhancer-promoter communication during differentiation-induced gene activation. Mol. Cell 10:1467-1477. [DOI] [PubMed] [Google Scholar]
- 17.Horn, P. J., and C. L. Peterson. 2002. Molecular biology. Chromatin higher order folding—wrapping up transcription. Science 297:1824-1827. [DOI] [PubMed] [Google Scholar]
- 18.Huang, D., S. W. Chen, and L. J. Gudas. 2002. Analysis of two distinct retinoic acid response elements in the homeobox gene Hoxb1 in transgenic mice. Dev. Dyn. 223:353-370. [DOI] [PubMed] [Google Scholar]
- 19.Jenuwein, T., and C. D. Allis. 2001. Translating the histone code. Science 293:1074-1080. [DOI] [PubMed] [Google Scholar]
- 20.Johnson, K. D., H. M. Christensen, B. Zhao, and E. H. Bresnick. 2001. Distinct mechanisms control RNA polymerase II recruitment to a tissue-specific locus control region and a downstream promoter. Mol. Cell 8:465-471. [DOI] [PubMed] [Google Scholar]
- 21.Kessel, M., and P. Gruss. 1991. Homeotic transformations of murine vertebrae and concomitant alteration of Hox codes induced by retinoic acid. Cell 67:89-104. [DOI] [PubMed] [Google Scholar]
- 22.Kondo, T., and D. Duboule. 1999. Breaking colinearity in the mouse HoxD complex. Cell 97:407-417. [DOI] [PubMed] [Google Scholar]
- 23.Krumlauf, R. 1992. Evolution of the vertebrate Hox homeobox genes. Bioessays 14:245-252. [DOI] [PubMed] [Google Scholar]
- 24.Krumlauf, R. 1994. Hox genes in vertebrate development. Cell 78:191-201. [DOI] [PubMed] [Google Scholar]
- 25.Langston, A. W., and L. J. Gudas. 1992. Identification of a retinoic acid responsive enhancer 3′ of the murine homeobox gene Hox-1.6. Mech. Dev. 38:217-227. [DOI] [PubMed] [Google Scholar]
- 26.Lawrence, P. A., and G. Struhl. 1996. Morphogens, compartments, and pattern: lessons from Drosophila? Cell 85:951-961. [DOI] [PubMed] [Google Scholar]
- 27.Lewis, E. B. 1978. A gene complex controlling segmentation in Drosophila. Nature 276:565-570. [DOI] [PubMed] [Google Scholar]
- 28.Lo, W. S., L. Duggan, N. C. Emre, R. Belotserkovskya, W. S. Lane, R. Shiekhattar, and S. L. Berger. 2001. Snf1—a histone kinase that works in concert with the histone acetyltransferase Gcn5 to regulate transcription. Science 293:1142-1146. [DOI] [PubMed] [Google Scholar]
- 29.Marshall, H., A. Morrison, M. Studer, H. Pöpperl, and R. Krumlauf. 1996. Retinoids and Hox genes. FASEB J. 10:969-978. [PubMed] [Google Scholar]
- 30.Marshall, H., M. Studer, H. Pöpperl, S. Aparicio, A. Kuroiwa, S. Brenner, and R. Krumlauf. 1994. A conserved retinoic acid response element required for early expression of the homeobox gene Hoxb-1. Nature 370:567-571. [DOI] [PubMed] [Google Scholar]
- 31.McBurney, M. W., S. Fournier, K. Jardine, and L. Sutherland. 1994. Intragenic regions of the murine Pgk-1 locus enhance integration of transfected DNAs into genomes of embryonal carcinoma cells. Somat. Cell. Mol. Genet. 20:515-528. [DOI] [PubMed] [Google Scholar]
- 32.McGinnis, W., and R. Krumlauf. 1992. Homeobox genes and axial patterning. Cell 68:283-302. [DOI] [PubMed] [Google Scholar]
- 33.Milne, T. A., S. D. Briggs, H. W. Brock, M. E. Martin, D. Gibbs, C. D. Allis, and J. L. Hess. 2002. MLL targets SET domain methyltransferase activity to Hox gene promoters. Mol. Cell 10:1107-1117. [DOI] [PubMed] [Google Scholar]
- 34.Morrison, A., L. Ariza-McNaughton, A. Gould, M. Featherstone, and R. Krumlauf. 1997. HOXD4 and regulation of the group 4 paralog genes. Development 124:3135-3146. [DOI] [PubMed] [Google Scholar]
- 35.Muller, J., C. M. Hart, N. J. Francis, M. L. Vargas, A. Sengupta, B. Wild, E. L. Miller, M. B. O'Connor, R. E. Kingston, and J. A. Simon. 2002. Histone methyltransferase activity of a Drosophila Polycomb group repressor complex. Cell 111:197-208. [DOI] [PubMed] [Google Scholar]
- 36.Niederreither, K., J. Vermot, B. Schuhbaur, P. Chambon, and P. Dollé. 2000. Retinoic acid synthesis and hindbrain patterning in the mouse embryo. Development 127:75-85. [DOI] [PubMed] [Google Scholar]
- 37.Nolte, C., A. Amores, E. Nagy Kovacs, J. Postlethwait, and M. Featherstone. 2003. The role of a retinoic acid response element in establishing the anterior neural expression border of Hoxd4 transgenes. Mech. Dev. 120:325-335. [DOI] [PubMed] [Google Scholar]
- 38.Packer, A. I., D. A. Crotty, V. A. Elwell, and D. J. Wolgemuth. 1998. Expression of the murine Hoxa4 gene requires both autoregulation and a conserved retinoic acid response element. Development 125:1991-1998. [DOI] [PubMed] [Google Scholar]
- 39.Papalopulu, N., J. D. Clarke, L. Bradley, D. Wilkinson, R. Krumlauf, and N. Holder. 1991. Retinoic acid causes abnormal development and segmental patterning of the anterior hindbrain in Xenopus embryos. Development 113:1145-1158. [DOI] [PubMed] [Google Scholar]
- 40.Pöpperl, H., and M. S. Featherstone. 1992. An autoregulatory element of the murine Hox-4.2 gene. EMBO J. 11:3673-3680. [DOI] [PMC free article] [PubMed] [Google Scholar]
- 41.Pöpperl, H., and M. S. Featherstone. 1993. Identification of a retinoic acid response element upstream of the murine Hox-4.2 gene. Mol. Cell. Biol. 13:257-265. [DOI] [PMC free article] [PubMed] [Google Scholar]
- 42.Rastegar, M., G. G. Rousseau, and F. P. Lemaigre. 2000. CCAAT/enhancer-binding protein-alpha is a component of the growth hormone-regulated network of liver transcription factors. Endocrinology 141:1686-1692. [DOI] [PubMed] [Google Scholar]
- 43.Rastegar, M., C. Szpirer, G. G. Rousseau, and F. P. Lemaigre. 1998. Hepatocyte nuclear factor 6: organization and chromosomal assignment of the rat gene and characterization of its promoter. Biochem. J. 334:565-569. [DOI] [PMC free article] [PubMed] [Google Scholar]
- 44.Roelen, B. A., W. de Graaff, S. Forlani, and J. Deschamps. 2002. Hox cluster polarity in early transcriptional availability: a high order regulatory level of clustered Hox genes in the mouse. Mech. Dev. 119:81. [DOI] [PubMed] [Google Scholar]
- 44a.Rudnicki, M. A., and M. W. McBurney. 1987. Cell culture methods and induction of differentiation of embryonal carcinoma cell lines, p. 19-49. In E. J. Robertson (ed.), Teratocarcinomas and embryonic stem cells: a practical approach. IRL Press, Oxford, United Kingdom.
- 45.Saleh, M., H. Huang, N. C. Green, and M. S. Featherstone. 2000. A conformational change in PBX1A is necessary for its nuclear localization. Exp. Cell Res. 260:105-115. [DOI] [PubMed] [Google Scholar]
- 46.Shang, Y., X. Hu, J. DiRenzo, M. A. Lazar, and M. Brown. 2000. Cofactor dynamics and sufficiency in estrogen receptor-regulated transcription. Cell 103:843-852. [DOI] [PubMed] [Google Scholar]
- 47.Soutoglou, E., and I. Talianidis. 2002. Coordination of PIC assembly and chromatin remodeling during differentiation-induced gene activation. Science 295:1901-1904. [DOI] [PubMed] [Google Scholar]
- 48.St.-Jacques, B., and A. P. McMahon. 1996. Early mouse development: lessons from gene targeting. Curr. Opin. Genet. Dev. 6:439-444. [DOI] [PubMed] [Google Scholar]
- 49.Studer, M., H. Pöpperl, H. Marshall, A. Kuroiwa, and R. Krumlauf. 1994. Role of a conserved retinoic acid response element in rhombomere restriction of Hoxb-1. Science 265:1728-1732. [DOI] [PubMed] [Google Scholar]
- 50.Zegerman, P., B. Canas, D. Pappin, and T. Kouzarides. 2002. Histone H3 lysine 4 methylation disrupts binding of nucleosome remodeling and deacetylase (NuRD) repressor complex. J. Biol. Chem. 277:11621-11624. [DOI] [PubMed] [Google Scholar]
- 51.Zhang, F., E. Nagy Kovacs, and M. S. Featherstone. 2000. Murine hoxd4 expression in the CNS requires multiple elements including a retinoic acid response element. Mech. Dev. 96:79-89. [DOI] [PubMed] [Google Scholar]
- 52.Zhang, F., H. Pöpperl, A. Morrison, E. N. Kovacs, V. Prideaux, L. Schwarz, R. Krumlauf, J. Rossant, and M. S. Featherstone. 1997. Elements both 5′ and 3′ to the murine Hoxd4 gene establish anterior borders of expression in mesoderm and neurectoderm. Mech. Dev. 67:49-58. [DOI] [PubMed] [Google Scholar]