Abstract
Mn(II) can catalyze the decomposition of H2O2 and, in the presence of H2O2, can catalyze the oxidation of NADH. Strikingly, these processes depend on the simultaneous presence of both CO2 and  . This explains the exponential dependence of the rates on [
 ], previously noted by other workers. These processes are inhibited by Mn-superoxide dismutase, establishing the generation of
  and its role as an essential reactant. A scheme of reactions, consistent with the known properties of this system, is proposed. The large rate enhancements provided by
  + CO2, and the abundance of both of these species in vivo, suggest that similar reactions have relevance to the oxidative stress imposed by
  and H2O2.
The Cu,Zn superoxide dismutase (SOD1) catalyzes the oxidation of a variety of substrates by H2O2 (1–8). This peroxidative activity was thought to depend on  (2–7), but was shown to actually require CO2 (8). Carbonate radical (
 ) is proposed to be the strong oxidant that is responsible for the peroxidations observed (3–8).
  -dependent peroxidations and H2O2 decomposition, catalyzed by Mn(II) and Fe(II), have been reported (9–17). The possibility that, in these reactions, CO2 rather than
  might be required, needs to be considered. One puzzling aspect of the Mn(II) +
  -catalyzed peroxidations and H2O2 decompositions was the exponential dependence of rates on [
 ] within a given range of [
 ]. Thus, Sychev et al. (9, 10) reported dependence of the rate on more than the square of [
 ], whereas the Stadtman group (13) reported a third-order dependence on [
 ].
].
In what follows, we demonstrate a dependence on CO2 and an apparent synergism between CO2 and  , which largely explains the reported exponential responses to [
 ]. The abundance of CO2 and
  in biological systems and their role in the peroxidations catalyzed by SOD1 and metal cations, such as Mn(II), could have relevance to the oxidative stress experienced by aerobic organisms.
Materials and Methods
NaHCO3, MnCl2, sodium pyrophosphate, and H2O2 were from Mallinckrodt; Tris was from Merck; catalase was from Roche Molecular Biochemicals; human MnSOD was from Biotechnology General (Rehovot, Israel); and NADH was from Sigma. Reaction mixtures usually contained 10 mM H2O2, 0.1 mM MnCl2, and 20 mM NaHCO3 in 100 mM Tris buffer at pH 7.4 and room temperature (23°C). Reactions were followed spectrophotometrically, and in cases where the addition of reactants entailed sudden changes in absorbance, due either to dilution or the absorbance of the reagent added, such changes were corrected in the data shown. When absorbance changes with time were too rapid to record, they are shown as dashed lines as in Fig. 3. CO2 was added as ice-cold water saturated with CO2 gas.
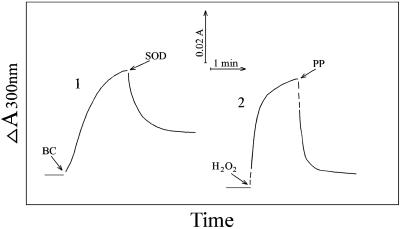
Fig. 3.
Time dependence of absorbance at 300 nm. Reaction conditions were as in Fig. 1. Line 1,  (BC) added at the first arrow and MnSOD to 24 μg/ml at the second arrow. Line 2, H2O2 added at the first arrow and pyrophosphate (PP) to 0.5 mM at the second arrow.
Results
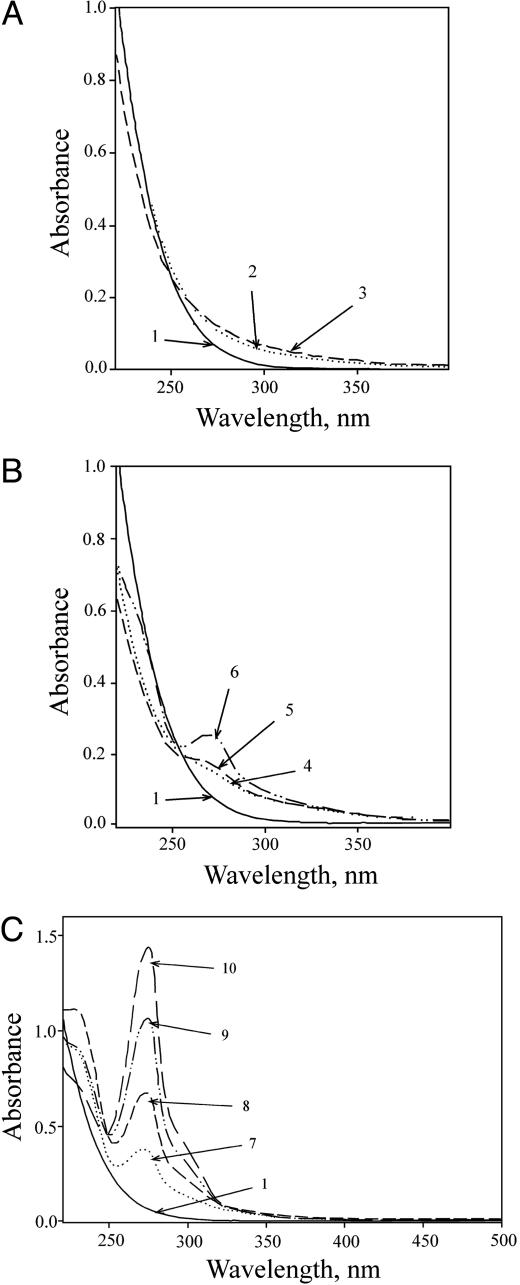
Absorption Spectra. Addition of the third component (H2O2 or MnCl2, or NaHCO3), to Tris-buffered solutions of the other two, initiated the changes in absorption spectrum shown in Fig. 1. It should be noted that several buffering species were explored, including phosphate, cacodylate, and Hepes, but only Tris supported the changes observed. Fig. 1 A shows that the most rapid (0–3 min) was an increase in absorbance in the range of 250–350 nm and a decrease at wavelengths <250 nm. At longer reaction times (0–20 min), absorbance appeared at ≈270 nm, whereas the absorbance <250 nm first decreased and then increased, as shown in Fig. 1B. At still longer times (Fig. 1C), the band at ≈270 nm became more pronounced, a shoulder developed at ≈300 nm, and absorbance <250 nm decreased.
Fig. 1.
Absorption spectra during the Mn + H2O2 +  reaction. Reactions were started by adding NaHCO3 to 20 mM to 10 mM H2O2, 0.1 mM MnCl2, and 100 mM Tris chloride at pH 7.4. (A) Spectra taken at 0, 1, and 3 min (lines 1, 2, and 3). (B) Spectra taken at 0, 6, 10, and 20 min (lines 1, 4, 5, and 6). (C) Spectra taken at 0, 30, 50, 80, and 120 min (lines 1, 7, 8, 9, and 10). The zero time spectrum was taken before the addition of
  .
.
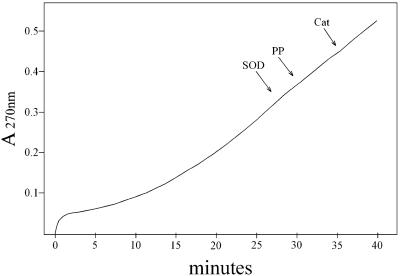
The species responsible for the absorbance centered at 270 nm is some stable product of Tris oxidation, as similar absorbance is seen in Tris buffer that has aged for many months. The kinetics of the absorbance change at 270 nm is shown in Fig. 2. Starting the reaction by adding NaHCO3 caused a small but rapid increase at 270 nm, which was followed by a slower increase that was not interrupted by late addition of 48 μg/ml MnSOD, 0.5 mM pyrophosphate, or 120 units/ml catalase, any of which inhibited if present at the outset. The initial rapid increase at 270 nm was due to the rapidly formed species absorbing in the 250- to 350-nm region. Evidently, the stable A270 species is produced from a preformed precursor and does not depend on the continued presence of H2O2,  , or Mn(III). The latter deduction is based on the abilities of catalase to remove H2O2, MnSOD to remove
  , and pyrophosphate to complex and thus trap Mn(III).
Fig. 2.
Time dependence of absorbance at 270 nm. Reaction mixtures were as in Fig. 1, with the reaction started by the addition of  . At the arrows, MnSOD to 48 μg/ml, pyrophosphate (PP) to 0.5 mM, or catalase (Cat) to 120 units/ml was added.
The time course of the broad band followed at ≈300 nm is illustrated in Fig. 3. Addition of NaHCO3 to the buffered solution of Mn(II) + H2O2 caused a rapid increase in absorbance that approached a plateau. This plateau evidently represented a dynamic steady state, as adding MnSOD (Fig. 3, line 1) or pyrophosphate (Fig. 3, line 2) caused a swift decline. The species followed at 300 nm could not have been Mn(III), because H2O2 was seen to instantly bleach the absorbance of Mn(III) acetate. These results indicate that both  and higher valent states of Mn(II) are needed for the formation of the A300 species. The rate of appearance of the A300 species was slower when NaHCO3 was the last component added than it was when H2O2 was added last (Fig. 3). This could be explained by the relative slowness of the formation of CO2 after the addition of the alkaline NaHCO3 to the reaction mixture buffered at pH 7.4. This view is supported by the fact that carbonic anhydrase at 50 μg/ml, when present in the reaction mixture, sharply increased the rate seen when NaHCO3 was added last and made it indistinguishable from line 2 in Fig. 3.
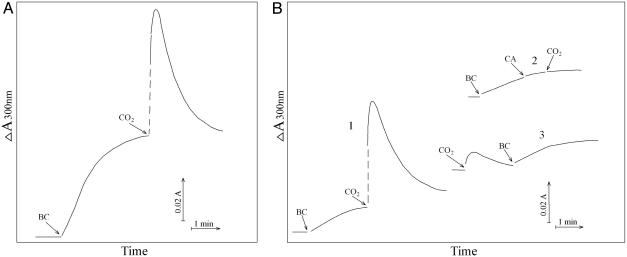
CO2 Is a Reactant. The addition of NaHCO3 initiated a rapid increase in A300 that approached a plateau within 3 min, as seen in Fig. 3. When CO2 was added, it caused a marked increase followed by a decline to the plateau that would have been reached in the absence of the addition of CO2, as seen in Fig. 4A. MnSOD (24 μg/ml) or pyrophosphate (0.5 mM) present at the outset prevented the increase in A300 (data not shown). The effect of added CO2 was even more striking when the amount of  used to start the reaction was halved. Thus, as shown in Fig. 4B, the increase in A300 was decreased by ≈5-fold when [
 ] was halved, in agreement with an exponential dependence of rate on [
 ]. Subsequent addition of CO2 again caused an abrupt but temporary increase in A300 (Fig. 4B, line 1). The presence of carbonic anhydrase eliminated the effect of added CO2 (Fig. 4B, line 2). When CO2 was added before, rather than after,
  , a very small and transient increase in A300 was seen, and the subsequent addition of
  gave the modest and limiting increase in A300 that would have been observed in the absence of the CO2 addition (Fig. 4B, line 3). Evidently, CO2 greatly increases A300 only when
  is also present. Clearly, CO2 and
  both are needed to support the reaction and behave synergistically.
Fig. 4.
Effect of CO2 on absorbance at 300 nm. (A) Conditions were as in Fig. 1. Reaction was started by addition of  at the first arrow and 0.15 ml of ice water saturated with CO2 added to the total volume of 3.0 ml at the second arrow. (B) Conditions were as in Fig. 1 except that
  was added to 10 mM. Line 1,
  added at the first arrow. Line 2, carbonic anhydrase (CA) was added to 50 μg/ml at the second arrow and CO2 added at the third arrow. Line 3, CO2 added at the first arrow and
  added at the second arrow.
The apparent difference between the effects of MnSOD and pyrophosphate, when added after the reaction was underway, as compared to their effects when added at the outset, is easily explained. Thus, there is overlap between the spectra of the A270 and A300 species. Thus, by the time the MnSOD or pyrophosphate had been added (Fig. 3), some of the stable A270 product had accumulated, and its absorbance at 300 nm prevented the complete ablation of the A300. In contrast, when MnSOD or pyrophosphate was present at the outset, they prevented production of both the A300 and A270 species.
It thus appears that the rapidly forming A300 species is needed for production of the A270 species.
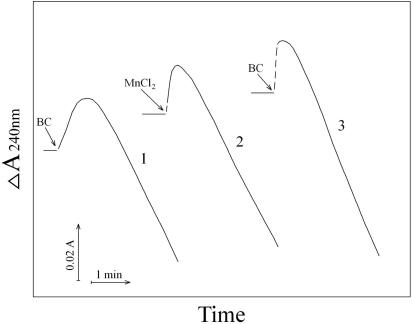
Consumption of H2O2. Absorbance at 240 nm reflects both H2O2 and the rapidly forming A300 species. Hence, the reaction between Mn(II), H2O2,  , and CO2 produces a transient increase at 240 nm followed by a linear decrease (Fig. 5). Starting the reaction by adding NaHCO3 last gave a slower increase in A240 than did adding MnCl2 last (Fig. 5, compare lines 1 and 2). This is explained by the slowness of the uncatalyzed dehydration of H2CO3 to CO2, as shown by the effect of carbonic anhydrase (Fig. 5, line 3). The linear decrease in A240 that followed the transient increase reflects consumption of H2O2, which was ≈0.5 mM/min, of H2O2, and it was not influenced by carbonic anhydrase (Fig. 5, compare lines 1 and 3). Ethanol at 1% did not inhibit, but MnSOD or pyrophosphate did when added after the linear rate had been achieved, after a lag of 5–10 s (data not shown).
Fig. 5.
Kinetics of absorbance changes at 240 nm. Conditions were as in Fig. 1. Line 1, reaction was started by the addition of  . Line 2, reaction was started by the addition of Mn(II). Line 3, carbonic anhydrase was present at 50 μg/ml, and reaction was started by the addition of
  .
.
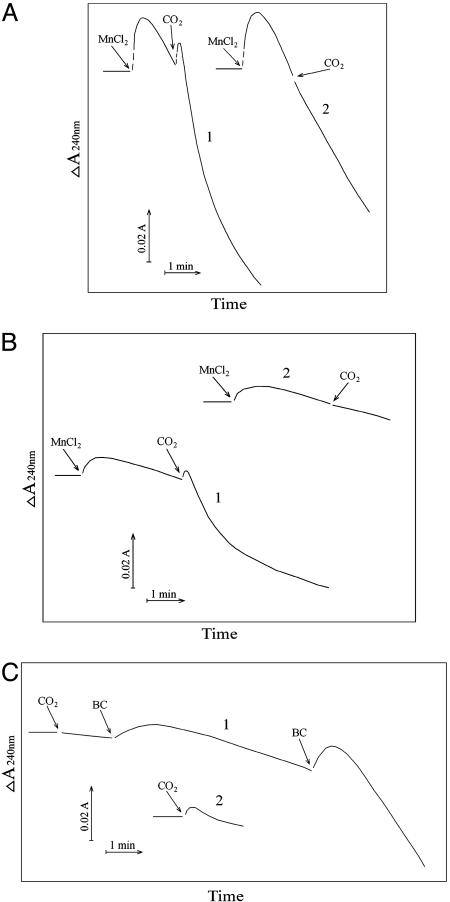
Addition of CO2 increased the consumption of H2O2 as illustrated by line 1 in Fig. 6A. Prior addition of carbonic anhydrase eliminated this effect of CO2, as shown by Fig. 6A, line 2. The effect of CO2 was even more striking when the concentration of  was decreased from 20 to 10 mM. Thus, as shown in Fig. 6B, the rate of H2O2 consumption was then much slower, ≈0.1 mM/min, and the effect of added CO2 was more obvious. The presence of carbonic anhydrase eliminated the effect of added CO2, as shown by Fig. 6A, line 2. CO2 was able to enhance the rate of H2O2 decomposition only if
  was present. Thus, as shown by line 1 in Fig. 6C, addition of CO2 to the Tris-buffered mixture of Mn(II) plus H2O2 was without effect, and subsequent additions of 10 mM
  gave the rates previously seen at these levels of
  in the absence of CO2 addition. Doubling the amount of CO2 added, in the absence of
  (Fig. 6C, line 2), had only a small effect, undoubtedly due to some conversion to
  . These results again bespeak a synergism between CO2 and
  , due to the requirement for both to support the decomposition of H2O2.
Fig. 6.
Effects of CO2 on absorbance changes at 240 nm. (A) Conditions were as in Fig. 1. Line 1, reaction was started by addition of Mn(II) at the first arrow, and then CO2 was added at the second arrow. Line 2 was as in line 1, but carbonic anhydrase was present at 50 μg/ml. (B) Conditions were as in A except that  was present at 10 mM. (C) Line 1, CO2 was added to Tris-buffered solution containing 10 mM H2O2 and 0.1 mM Mn(II) at the first arrow, and then
  to 10 mM was added at the second arrow, and at the third arrow
  was raised to 20 mM. Line 2, 0.3 ml of CO2 solution was added to the H2O2 + Mn(II) reaction mixture at the arrow.
Oxidation of NADH. Previous workers (11, 12, 14, 17) demonstrated that Mn(II) + H2O2 +  could cause the oxidation of diverse substrates, such as amino acids. We chose NADH because it absorbs at 340 nm, where the rapidly formed A300 species does not absorb significantly. Moreover,
  , considered a likely oxidant in this reaction system, is known to oxidize NADH with a rate constant of ≈109 M–1·s–1 at 25°C (18). It should also be noted that HO• attacks NADH at sites that do not yield NAD+, whereas
  does so (18). Line 1 in Fig. 7A shows that addition of
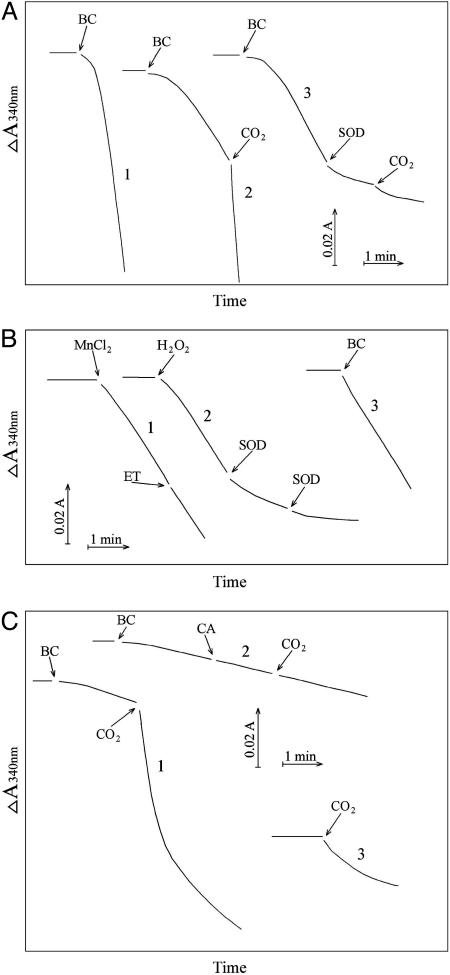
  to 20 mM to the Tris-buffered mixture of H2O2 + Mn(II) initiated oxidation of NADH at a rate of ≈0.02 mM/min after a brief lag. Halving the amount of
  added decreased the rate by 5.3-fold, and subsequent addition of CO2 greatly increased the rate (Fig. 7A, line 2). MnSOD inhibited the oxidation of NADH, and this inhibition was not overcome by subsequent addition of CO2 (Fig. 7A, line 3). The lags seen when
  was used to start the reaction were not as evident when Mn(II) or H2O2 was the last component added, or when carbonic anhydrase was present at the time
  was added (Fig. 7B). It follows that the lags seen in Fig. 7A were due to the time required for conversion of some of the
  to CO2. Ethanol added to 1% did not inhibit NADH oxidation (Fig. 7B, line 1), whereas MnSOD did so (Fig. 7B, line 2). Thus, HO• is not an intermediate in this process, but
  is. In full accord with the deductions so far, adding CO2 after
  caused a marked increase in the rate of NADH oxidation (Fig. 7C, line 1), and this effect of CO2 was eliminated if carbonic anhydrase was present (Fig. 7C, line 2). Addition of CO2 in the absence of
  transiently increased the rate due undoubtedly to the generation of some
  , the second component needed.
Fig. 7.
Oxidation of NADH. NADH was present at 0.1 mM, and oxidation was followed at 340 nm. (A) Line 1, conditions were as in Fig. 1 except as noted below, and  was added to 20 mM at the arrow. Line 2,
  was added to 10 mM at the first arrow, and 0.15 ml of CO2 solution was added at the second arrow. Line 3,
  was added to 10 mM at the first arrow, MnSOD was added to 30 μg/ml at the second arrow, and 0.15 ml of CO2 solution was added at the third arrow. (B) Mn(II) was added at 0.1 mM, H2O2 was added at 10 mM, and
  was added at 10 mM. Line 1, Mn(II) was added at the first arrow, and ethanol to 1% was added at the second arrow. Line 2, reaction was started with H2O2 at the first arrow, and then MnSOD was added to 6 μg/ml at the second arrow and to 18 μg/ml at the third arrow. Line 3, as in lines 2 and 3in A but carbonic anhydrase was present at 50 μg/ml. (C) Mn(II) was added at 0.1 mM, H2O2 at 10 mM, and
  , when present, at 5 mM. Line 1,
  was added at the first arrow, and 0.15 ml of CO2 solution was added at the second arrow. Line 2,
  was added at the first arrow, carbonic anhydrase to 50 μg/ml was added at the second arrow, and 0.15 ml of CO2 solution was added at the third arrow. Line 3, 0.15 ml of CO2 solution was added at the arrow, but
  was not present.
Discussion
One aspect of the toxicity of  is thought to involve the univalent oxidation of the [4Fe–4S] clusters of dehydrases, such as aconitase. This destabilizes the clusters causing release of Fe(II), and that released iron can then generate potent oxidants by reacting with hydroperoxides, in what is called Fenton chemistry (19). Iron is not the only metal cation that can participate in Fenton chemistry. Thus, Mn(II), Co(II), Cr(II), and Cu(II) can do likewise, and
  or CO2 has been shown to enhance the oxidations caused by several of these metals in the presence of H2O2 (11, 12, 14, 16, 20). In one of these cases, Xiao et al. (20) showed that CO2 enhanced the luminescence of luminol caused by Co(II) + H2O2. H2O2 decomposition and oxidations, catalyzed by Mn(II) + H2O2, in the presence of
  , have been studied by a number of workers, such as Sychev et al. (9–12) and the Stadtman group (13–15); the exponential dependence of rate on [
 ] has been noted, and mechanisms have been proposed.
Our present demonstration that both  and CO2 are required for this process explains the exponential dependence on [
 ], as elevating [
 ] also raises the [CO2] in equilibrium with it. Any valid mechanism must explain the dual requirement for
  and CO2 and also the involvement of
  . Moreover, analogy with the Cu,ZnSOD + H2O2 system indicates that
  is a likely participant, whereas HO• is not (1, 3–8). The role of
  could not be the reduction of Mn(III) to Mn(II), as suggested by the Stadtman group (13), because H2O2 itself rapidly accomplishes this reduction. On the other hand, the oxidation of Mn(II) to Mn(III) is also not likely to be the role of
  , as H2O2 would then be produced from the
  , yet rapid H2O2 consumption is a hallmark of this process.
The following scheme of reactions is in accord with the known properties of the system. It is proposed in the realization that it is an oversimplification that others may want to elaborate.
 |
[1] |
 |
[2] |
 |
[3] |
 |
[4] |
In reactions 1–4, H2O2 has been decomposed to H2O + O2, and  has been generated, in what may be viewed as the initiation phase, setting the stage for the chain reaction depicted by the following reactions. In what follows, the manganese may or may not be participating in the form of an
  complex.
 |
[5] |
 |
[6] |
 |
[7] |
 |
[8] |
 |
[9] |
 |
[10] |
 |
[11] |
 |
[12] |
The  generated in reaction 3 is essential for reactions 6 and 8, and it may be viewed as the initiating radical. This is in accord with the observation by Sychev et al. (10) that tetranitromethane, which reacts with
  at ≈109 M–1·s–1, strongly inhibited the decomposition of H2O2 and that the simultaneous addition of tetranitromethane and N,N′-dimethyl-p-nitrosoaniline prevented the oxidation of the N,N′-dimethyl-p-nitrosoaniline until all of the tetranitromethane was consumed. In our case, we used MnSOD, which scavenges
  as efficiently as does tetranitromethane, but which acts catalytically rather than stoichiometrically. The product of reaction 6 may itself act as the oxidizing species, or carbonate radical, made as in reaction 8, may be the oxidant that can oxidize H2O2 (reaction 9) or NADH (reaction 10). Reactions 6 and 7 or 8 and 9 may be alternative or simultaneous pathways. Note the similarity of pathways 6 and 7 as well as 8 and 9 to the classical Haber–Weiss chemistry (21). Because
  is merely acting as a reductant, other reductants in the cell could possibly trigger these potentially damaging processes. Reaction 12 is a termination reaction, and it explains the inhibition by MnSOD. The product of reaction 2 contains trivalent manganese, and it could be the site of inhibition by pyrophosphate. Oxidation of Tris by one or more of the oxidants generated in this scheme would account for the slowly forming and stable species followed at 270 nm. Sychev et al. (9, 10) worked without buffer and maintained pH by titration. Hence, it cannot be the case that Tris is needed for the process under study. We must rather conclude that Tris did not significantly interfere whereas phosphate, Hepes, and cacodylate did so.
The biological significance of Fenton chemistry has been questioned in part because the rate constants for the reactions of reduced metals, and their complexes, with H2O2 are not rapid, and their in vivo metal ligands are unknown (22). The present observations of the synergistic rate accelerations by  + CO2 plus the work of Sychev et al. (9–12) and the Stadtman group (13–16) overcome this bottleneck and may well be of importance in the imposition of oxidative stress in biological systems. In this regard, the observation of Stadtman and Berlett (16) that
  greatly enhances the ability of Fe(II) plus H2O2 to cause the oxidation of amino acids is also very interesting. The exponential dependence of rates on [
 ] can have two components. Thus, the second-order dependence reported by Sychev et al. (10) is explained by the dual need for
  and CO2. To this can be added the effect of
  in decreasing the amount of free hexaquo Mn(II) available for consumption of
  by the reaction Mn(II) +
  + 2H+ ⇄ Mn(III) + H2O2. This, together with the need for CO2 +
  , could explain the third-order dependence noted by the Stadtman group (13).
Acknowledgments
This work was supported by National Institutes of Health Grant DK5986A.
Abbreviation: SOD, superoxide dismutase.
References
- 1.Hodgson, E. K. & Fridovich, I. (1975) Biochemistry 14, 5299–5303. [DOI] [PubMed] [Google Scholar]
- 2.Sankarapandi, S. & Zweier, J. L. (1999) J. Biol. Chem. 274, 1226–1232. [DOI] [PubMed] [Google Scholar]
- 3.Liochev, S. I. & Fridovich, I. (1999) Free Radical Biol. Med. 27, 1444–1447. [DOI] [PubMed] [Google Scholar]
- 4.Zhang, H., Joseph, J., Felix, C. & Kalyanaraman, B. (2000) J. Biol. Chem. 275, 14038–14045. [DOI] [PubMed] [Google Scholar]
- 5.Zhang, H., Joseph, J., Gurney, M., Becker, D. & Kalyanaraman, B. (2002) J. Biol. Chem. 277, 1013–1020. [DOI] [PubMed] [Google Scholar]
- 6.Zhang, H., Andrekopoulos, C., Joseph, J., Chandran, K., Karoui, H., Crow, J. P. & Kalyanaraman, B. (2003) J. Biol. Chem. 278, 24078–24089. [DOI] [PubMed] [Google Scholar]
- 7.Liochev, S. I. & Fridovich, I. (2002) J. Biol. Chem. 277, 34674–34678. [DOI] [PubMed] [Google Scholar]
- 8.Liochev, S. I. & Fridovich, I. (2004) Proc. Natl. Acad. Sci. USA 101, 743–744. [DOI] [PMC free article] [PubMed] [Google Scholar]
- 9.Sychev, A. Y., Isak, V. G. & Lap, D. V. (1977) Russ. J. Phys. Chem. 51, 212–214. [Google Scholar]
- 10.Sychev, A. Y., Isak, V. G. & Lap, D. V. (1978) Russ. J. Phys. Chem. 52, 55–59. [Google Scholar]
- 11.Sychev, A. Y., Phannmeller, U. & Isak, V. G. (1983) Russ. J. Phys. Chem. 57, 1349–1351. [Google Scholar]
- 12.Sychev, A. Y., Him, M. H. & Isak, V. G. (1984) Russ. J. Phys. Chem. 58, 549–551. [Google Scholar]
- 13.Stadtman, E. R., Berlett, B. S. & Chock, P. B. (1990) Proc. Natl. Acad. Sci. USA 87, 384–388. [DOI] [PMC free article] [PubMed] [Google Scholar]
- 14.Berlett, B. S., Chock, P. B., Yim, M. B. & Stadtman, E. R. (1990) Proc. Natl. Acad. Sci. USA 87, 389–393. [DOI] [PMC free article] [PubMed] [Google Scholar]
- 15.Yim, M. B., Berlett, B. S., Chock, P. B. & Stadtman, E. R. (1990) Proc. Natl. Acad. Sci. USA 87, 394–398. [DOI] [PMC free article] [PubMed] [Google Scholar]
- 16.Stadtman, E. R. & Berlett, B. S. (1991) J. Biol. Chem. 266, 17201–17211. [PubMed] [Google Scholar]
- 17.Lane, B. S., Vogt, M., DeRose, V. J. & Burgess, K. (2002) J. Am. Chem. Soc. 124, 11946–11954. [DOI] [PubMed] [Google Scholar]
- 18.Goldstein, S. & Czapski, G. (2000) Chem. Res. Toxicol. 13, 736–741. [DOI] [PubMed] [Google Scholar]
- 19.Liochev, S. I. & Fridovich, I. (1999) Int. Union Biochem. Mol. Biol. Life 48, 157–161. [Google Scholar]
- 20.Xiao, C., Palmer, D. A., Wesolowski, D. J., Lovitz, S. B. & King, D. W. (2002) Anal. Chem. 74, 2210–2216. [DOI] [PubMed] [Google Scholar]
- 21.Haber, F. & Weiss, J. (1934) Proc. R. Soc. London Ser. A 147, 332–335. [Google Scholar]
- 22.Koppenol, W. H. (1991) Free Radical Biol. Med. 25, 385–391. [DOI] [PubMed] [Google Scholar]


