Abstract
Nitrogen cross sections of hybrid and complex glycans released from the glycoproteins IgG, gp120 (from human immunodeficiency virus), ovalbumin, α1-acid glycoprotein, thyroglobulin and fucosylated glycoproteins from the human parotid gland were measured with a travelling-wave ion mobility mass spectrometer using dextran as the calibrant. The utility of this instrument for isomer separation was also investigated. Some isomers, such as Man3GlcNAc3 from chicken ovalbumin and Man3GlcNAc3Fuc1 from thyroglobulin could be partially resolved and identified by their negative ion fragmentation spectra. Several other larger glycans, however, although existing as isomers, produced only asymmetric rather than separated arrival time distributions (ATDs). Nevertheless, in these cases, isomers could often be detected by plotting extracted fragment ATDs of diagnostic fragment ions from the negative ion spectra obtained in the transfer cell of the Waters Synapt mass spectrometer. Coincidence in the drift times of all fragment ions with an overall asymmetric ATD profile usually suggested that separations were due to conformers or anomers, whereas symmetrical ATDs of fragments showing differences in drift times indicated isomer separation. Although some significant differences in cross sections were found for the smaller isomeric glycans, the differences found for the larger compounds were usually too small to be analytically useful. Possible correlations between cross sections and structural types were also investigated and it was found that complex glycans tended to have slightly smaller cross sections than high-mannose glycans of comparable molecular weight. In addition, biantennary glycans containing a core fucose and/or a bisecting GlcNAc residue fell on different mobility-m/z trend lines to those glycans not so substituted with both of these substituents contributing to larger cross sections.
Keywords: T-wave ion mobility, N-linked carbohydrates, isomers, hybrid N-glycans, complex N-glycans
Introduction
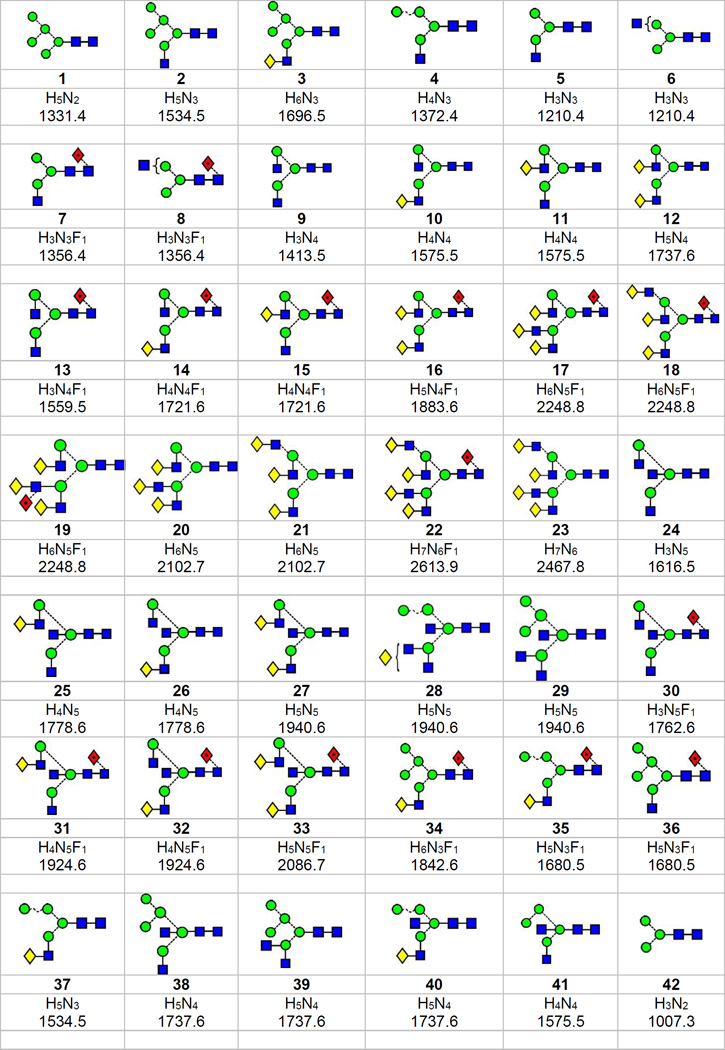
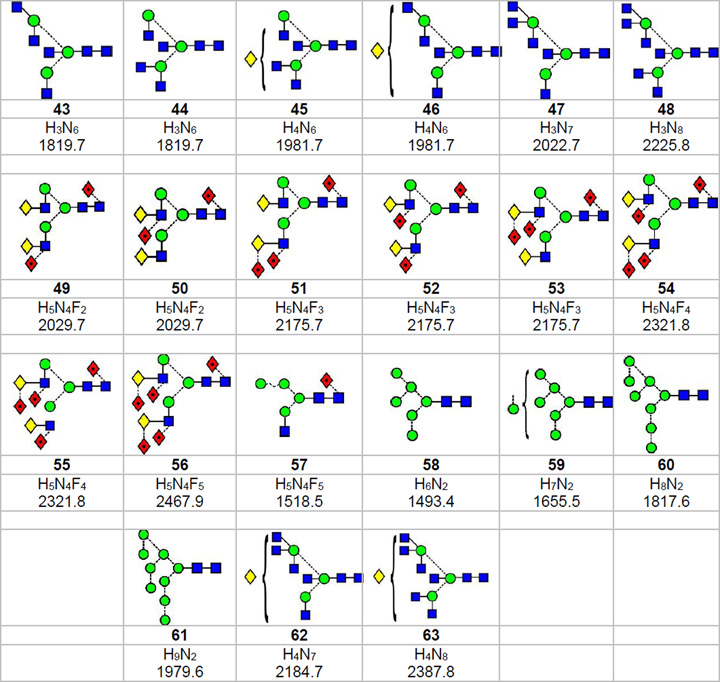
Biosynthesis of N-glycans (those glycans attached to the asparagine residue of glycoproteins in an Asn-Xxx-Ser(Thr) motif where Xxx is any amino acid except proline), involves attachment of a glycan of composition Glc3Man9GlcNAc2 to the protein followed by removal of the glucose residues and four of the mannose moieties to give the high-mannose glycan Man5GlcNAc2 (1, Scheme 1 (see Scheme 1 of the first paper in this two part series1 for the structures of these compounds)). This glycan is a substrate for GlcNAc-transferase I which adds a GlcNAc residue to the 2-position of the 3-branch mannose to give 2 which then becomes the substrate for other enzymes. One pathway involves addition of galactose to the 4-position of the added GlcNAc to give 3 followed by addition of sialic acid to the 3- or 6- positions of this galactose residue. These compounds are known as hybrid glycans. Alternatively or additionally, the two mannose residues can be removed from the 6-antenna of 2 to give 4 and 5 followed by addition of GlcNAc (9), galactose (10-12) and sialic acid to this antenna as described above. Further enzymes add fucose to the core GlcNAc (7, 8, 13-16) and additional GlcNAc-Gal-Neu5Ac antennae to either or both of the outer mannoses to give isomeric triantennary glycans such as 17 and 18 (and non-fucosylated analogues, e.g. 20 and 21) and the tetra-antennary glycans 22 and 23. GlcNAc residues (termed ‘bisecting GlcNAcs’) can also be added to the 4-position of the branching mannoses as in compounds 24-33. All of these latter compounds are known as complex glycans.
Scheme 1.
Structures of the N-glycans discussed in the text. Symbols for the glycan constituents and linkages between them are:  = GlcNAc,
  = mannose,
  = galactose,
  = fucose. Solid connecting line = β-linkage, broken line = α-linkage. The angle of the lines shows the linkage position:
  For more information see68. Compositions are given by H = hexose, N = GlcNAc, F = fucose. Monoisotopic masses listed below the compositions are of the [M+H2PO4]− ions.
Structural analysis of these glycans typically involves their release from glycoproteins by chemical or enzymatic methods followed by analysis by mass spectrometry or HPLC2–6. We have been evaluating the use of ion mobility and negative ion collision-induced dissociation (CID) for this purpose and the previous paper1 of this two part series discussed their application to the high-mannose glycans. In this paper we extend our investigation to the analysis of hybrid and complex glycans with particular reference to the use of these techniques to separate isomers. The ability of any analytical technique to be able to identify isomeric compounds is of particular importance in analyses of this type because many of the N-glycans released from glycoproteins are isobaric.
From Scheme 1, which contains the structures of the glycans discussed in this paper, it can be seen that several of the glycans, particularly 5 and 6; 7 and 8; 10 and 11; 14 and 15; 17-19; 25 and 26; 27-29; 31 and 32; 35 and 36; 12 and 38-40; 43 and 44; 45 and 46; 49 and 50; 51, 52 and 53; 54 and 55 are isobaric. Although mass spectrometry is capable of assigning compositions and providing branching and linkage information to the glycans, it is not a very powerful technique for discriminating between isomers unless preceded by a chromatographic inlet system. For N-linked glycans, at least, negative ion CID has been shown to be better than positive ion methods at detecting the presence of isomeric and other isobaric glycans in mixtures because of the predominance of cross-ring fragment ions that produce diagnostic mass-different ions for the isomers rather than the predominantly abundance-different glycosidic cleavage ions common to positive ion spectra7–10. In the previous paper on high-mannose glycans1, ion mobility, which separates on the basis of shape as well as mass and charge, combined with negative ion CID, was shown to be capable of partial resolution of several isomers of these compounds. Several other investigators have also used ion mobility to separate isomeric carbohydrates11–14 (and see previous paper for earlier references and the review by Gray et al.15), but only a few have examined N-glycans16–19. With reference to N-linked glycans, Plasencia et al.19 and Jiao et al.20 have proposed three structures for the glycan of composition Hex5HexNAc4 from ovalbumin and Isailovic et al.21 have reported differences in the arrival time distributions (ATDs) of sialylated biantennary N-glycans from human serum but, in this case, specific structures were not identified.
Several of the isomers encountered in the work on high-mannose glycans showed only marginal separation, detected only by asymmetric ATDs. Cross sections could not, therefore, be measured directly. However, cross sections of these compounds were obtained by plotting ATDs of mass-different isomer-specific fragment ions from their negative ion CID spectra22, 23. One of the problems encountered in the previous work1 was the appearance of asymmetric ATDs suggesting the presence of isomers but which were later shown to be due mainly to separation of reducing-terminal anomers24. Such anomers, or possibly additional conformers, could be differentiated from the isomers by similarity in the asymmetric ATD profiles between the molecular and fragment ions. In this paper, we report the cross sections of several complex and hybrid glycans and use extracted fragment ATDs to estimate the cross sections of isomers that do not produce resolved ATDs, Because of possible complications produced by separation of conformers, and we also looked at the effect of reduction on the ATD profiles.
In addition to isomer separation, we25, 26 and other investigators16, 27–30 have found that ion mobility is an excellent technique for effectively separating glycan or glycopeptide signals from those of other materials, particularly when ions are formed in different charge states. Neutral glycans yield predominantly singly-charged glycan peaks unlike many contaminating compounds that produce multiply charged ions. Within singly charged ion band there is frequently separation between compounds of different structural type, such as glycans and polyethylene glycol (PEG)31 and even between N-glycans and linear glycan polymers. Consequently, in this paper, we also examine the effect of glycan structure on the ability of ion mobility to differentiate glycans with particular structural characteristics.
Materials and Methods
materials
N-linked glycans were released with hydrazine32, 33 from the well-characterised glycoproteins porcine thyroglobulin34, 35, chicken ovalbumin36–38 bovine fetuin39 and α1-acid glycoprotein (AGP)40, 41 obtained from Sigma Chemical Co. Ltd., Poole, Dorset, UK. Fucosylated N-glycans from human parotid glands42–44 were released with hydrazine and re-N-acetylated43. N-glycans from gp120 expressed in CHO cells and from immunoglobulin G (IgG) were released with protein N-glycosidase F (PNGase F) from within NuPAGE gels essentially as described by Küster et al.25, 45 and as described in the previous paper1. Sialylated glycans from AGP were desialylated by heating with 1% acetic acid at 80°C for 30 mins. Methanol was obtained from BDH Ltd. (Poole, UK) and ammonium phosphate was from Aldrich Chemical Co. Ltd. (Poole, UK). Dextran from Leuconostoc mesenteroides was obtained from Fluka (Poole, UK).
Reduction of glycans
Glycans from ovalbumin, fetuin, thyroglobulin and AGP (about 0.1 mg of each mixture) in dimethylsulfoxide (DMSO, 100 µL) were acidified to pH 3.3 with acetic acid (2 µL) and reduced with an excess of sodium cyanoborohydride (~0.1 mg, Aldrich Chemical Co. Ltd. Poole, UK) overnight. The DMSO was evaporated and the samples were cleaned as described below.
Sample preparation for mass spectrometry
Following release from the glycoproteins, all glycan samples were cleaned with a Nafion® 117 membrane as described earlier by Börnsen et al.46 before examination by mass spectrometry. They were then dissolved in a solution of methanol:water (1:1, v:v) containing ammonium phosphate (0.05 M, to maximize formation of [M+H2PO4]− ions, the most common type of ion normally seen from biological samples). Samples were then centrifuged at 10,000 rpm (9503×g) for 1 min to sediment any particulate matter.
Ion mobility mass spectrometers
Travelling wave ion mobility experiments were carried out in nitrogen with the original (termed G1) Waters Synapt travelling wave ion mobility mass spectrometer (TWIMS), (Waters, Manchester, UK)47 fitted with an electrospray (ESI) ion source and with the newer Synapt G2 and G2Si instruments (Waters). Waters thin-wall nanospray capillaries and, later, in-house prepared capillaries were used for introducing the samples. Ion source conditions were: ESI capillary voltage, 1.0-1.2 kV cone voltage, 100–180 V, ion source temperature 80°C. The T-wave velocity and peak height voltages were 450 m/sec and 40 V respectively unless otherwise specified. Fragmentation was performed after mobility separation in the transfer cell with argon as the collision gas. The Synapt G1 instrument was externally calibrated with sialylated N-glycans released from bovine fetuin, the other two instruments were mass-calibrated with dextran oligomers from Leuconostoc mesenteroides (negative ion measurements) or with caesium iodide (both positive and negative ion. Data acquisition and processing were carried out using the Waters DriftScope (version 2.8) software and MassLynx™ (version 4.1). The scheme devised by Domon and Costello48 was used to name the fragment ions.
Cross sections of dextran oligomers (Glc2-Glc13), used to calibrate the travelling wave cell of the Synapt G2 and G2Si instruments, were obtained directly on a modified Synapt quadrupole/IMS/oa-TOF MS instrument containing a linear (not travelling wave) drift tube (Waters MS-Technologies, Manchester, UK)49–53. Calibration of the G2 and G2Si instruments was performed with the method described by Thalassinos et al. 54 as described in the previous paper. The corrected drift times of the glucose oligomers and cross sections were fitted by a power law equation of the type Y = Axn which May et al.55 have confirmed adequately fits data of this type. Estimated cross sections were also determined with the cross section Apex calculation algorithm supplied with DriftScope; results from the two methods were virtually identical. Projected helium cross sections were made with a helium:nitrogen cross correlation plot (R2 = 0.9989).
Results and Discussion
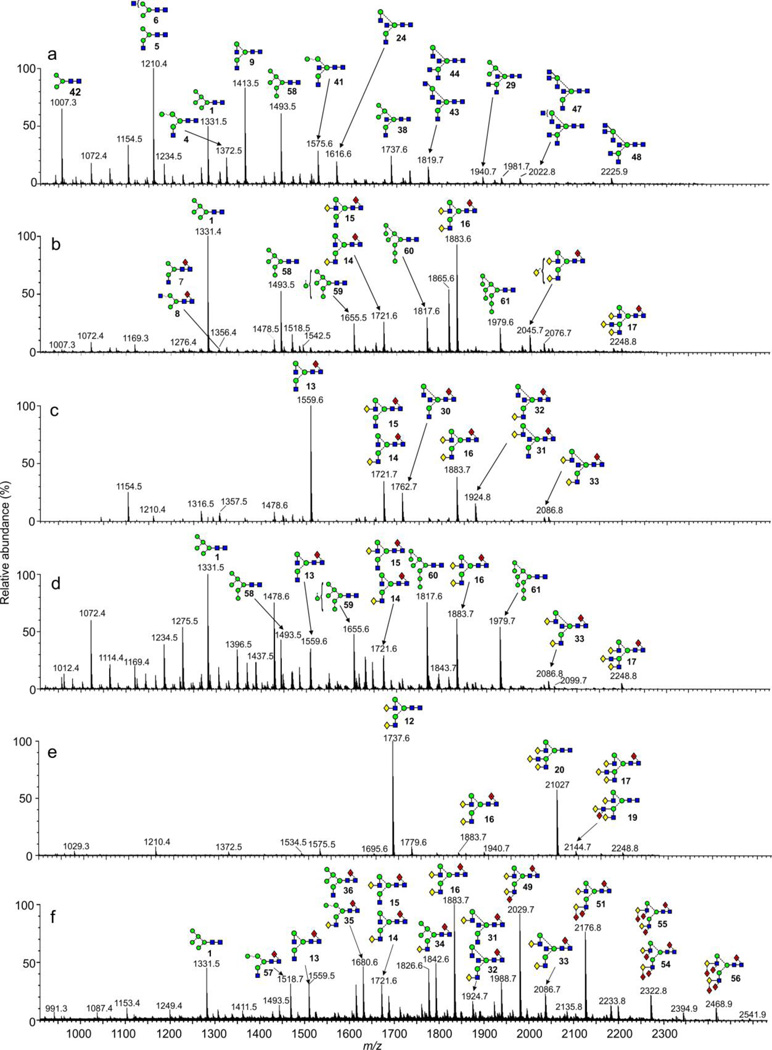
Results for high-mannose glycans reported earlier1 showed that many isomers of these N-glycans could be detected by ion mobility using extracted fragment ATDs. In addition, those having the full complement of mannose residues on the 6-branch of the 6-antenna, were shown to produce relatively larger cross sections than corresponding glycans where this mannose was missing. However, when these glycans were reduced, the ATDs from the larger glycans became more symmetrical and the difference less noticeable24. Asymmetry of the ATDs from higher mass high-mannose glycans was found to be due to partial resolution of anomers rather than isomers. Consequently, in the present study, glycans were also reduced to remove effects of anomer separation. Cross sections of the reduced glycans were in the region of 2 - 4 A2 higher than those of the unreduced glycans (Table 1). We looked for features in both the reduced and unreduced glycans among the hybrid and complex N-glycans that might be correlated to structure in addition to the ability of ion mobility to separate isomeric N-glycans. Glycans from chicken ovalbumin, thyroglobulin, IgG, AGP (desialylated), gp120 and human parotid glands were taken as representative examples. Negative ion mass spectra of the glycans released from these glycoproteins are shown in Figure 1.
Table 1. Estimated cross sections of hybrid and complex glycans.
Major isomers of high-mannose glycans included for comparison
| Compound | Structurea | m/zb | Source | Instrumentc | Cal.d | Cross section | |||
|---|---|---|---|---|---|---|---|---|---|
| Nitrogen | Hee | ||||||||
| Å2 | SD | n | Å2 | ||||||
| H3N2 | 42 | 1007.3 | Ovalbumin | G2Si | I | 284.6 | 0.16 | 12 | 206.6 |
| H3N3 | 5 | 1210.4 | Ovalbumin | G2Si | I | 310.0 | 0.20 | 9 | 229.4 |
| H3N3 | 6 | 1210.4 | Ovalbumin | G2Si | I | 322.1 | 0.19 | 9 | 240.4 |
| H5N2 | 1 | 1331.4 | Ovalbumin | G2Si | I | 339.0 | 0.18 | 12 | 256.1 |
| H4N3 | 4 | 1372.5 | Ovalbumin | G2Si | I | 336.0f | 0.36 | 12 | 253.4 |
| H3N4 | 9 | 1413.5 | Ovalbumin | G2Si | I | 347.7 | 0.19 | 12 | 262.6 |
| H6N2 | 58 | Ovalbumin | G2Si | I | 364.1 | 0.22 | 12 | 277.8 | |
| H5N3 | 2 | 1534.5 | gp120 | G2Si | E | 373.9 | - | - | 287.5 |
| H5N3 | 37 | 1534.5 | gp120 | G2Si | E | 357.6 | - | - | 272.2 |
| H3N4F1 | 13 | 1559.5 | IgG | G2Si | I | 377.9 | 1.00 | 6 | 290.5 |
| H4N4 | 10,11 | 1575.5 | Ovalbumin | G2Si | I | 365.3 | 0.49 | 12 | 278.8 |
| H3N5 | 24 | 1616.5 | IgG | G2Si | E | 378.8 | 1.36 | 5 | 291.2 |
| Ovalbumin | G2Si | I | 382.4 | 0.30 | 12 | 294.2 | |||
| H7N2 | 60 | 1655.5 | Thyroglobulin | G2Si | I | 387.9 | 0.53 | 12 | 299.2 |
| H5N3F1 | 35 | 1680.5 | gp120 | G2 G2Si |
E E |
389.4 385.4 |
- - |
1 1 |
300.9 296.9 |
| H5N3F1 | 36 | 1680.5 | gp120 | G2Si | E | 405.0 | - | 1 | 314.5 |
| H6N3 | 3 | 1696.6 | Ovalbumin | G2Si | I | 381.0 | 0.61 | 12 | 293.1 |
| H4N4F1 | 14,15 | 1721.6 | IgG | G2 | E | 399.0 | 1.2 | 4 | 309.5 |
| Thyroglobulin | G2Si | I | 398.8 | 0.78 | 3 | 308.6 | |||
| H4N4F1 | 14,15 | 1721.6 | Thyroglobulin | G2Si | I | 397.5 | 0.65 | 19 | 308.2 |
| H5N4 | 12 | 1737.6 | IgG, Fetuin AGP |
G2 G2 G2Si |
E E E |
392.0 388.4 392.4 |
0.29 1.30 0.57 |
9 5 2 |
303.2 299.5 303.5 |
| H5N4 | 38 | 1737.6 | Ovalbumin | G2Si | I | 393.5 | 0.28 | 12 | 304.8 |
| H3N5F1 | 30 | 1762.6 | IgG IgG |
G2 G2Si |
E E |
407.3 403.8 |
0.17 1.49 |
4 5 |
316.8 313.2 |
| H4N5 | 25,26,27 | 1778.6 | Ovalbumin | G2Si | I | 401.5 | 0.33 | 12 | 311.9 |
| H8N2 | 60 | 1817.6 | Thyroglobulin | G2Si | I | 418.5f | 2.28 | 12 | 327.0 |
| H3N6 | 43,44 | H3N6 | Ovalbumin | G2Si | I | 411.4g | 0.30 | 12 | 321.2 |
| H5N4F1 | 16 | 1883.6 | Thyroglobulin | G2Si | I | 418.8 | 0.96 | 19 | 327.3 |
| AGP | G2Si | E | 418.0 | 0.28 | 326.6 | ||||
| H4N5F1 | 31,32 | 1924.6 | IgG | G2Si | E | 420.4 | 0.21 | 5 | 328.5 |
| H5N5 | 27 | 1940.6 | IgG | G2Si | E | 421.6 | - | - | 329.3 |
| 28, 29 | Ovalbumin | G2Si | I | 420.6h | 0.58 | 12 | 330.3 | ||
| H9N2 | 61 | 1979.6 | Thyroglobulin | G2Si | I | 434.1f | 1.34 | 12 | 342.0 |
| H4N6 | 45,46i | 1981.7 | Ovalbumin | G2Si | I | 427.6 | 0.56 | 12 | 335.5 |
| H3N7 | 47 | 2022.7 | Ovalbumin | G2Si | I | 434.5 | 0.66 | 12 | 341.3 |
| H5N4F2 | 49, 50 | 2029.7 | Parotid | G2Si | E | 437.9 | 1.18 | 8 | 345.0 |
| H5N5F1 | 33 | 2086.7 | IgG | G2 G2Si |
E E |
443.9 439.4 |
0.30 0.95 |
4 4 |
349.2 345.7 |
| H6N5 | 20 | 2102.7 | AGP | G2Si | E | 441.8 | 0.78 | 2 | 348.8 |
| H5N4F3 | 51, 52, 53 | 2175.7 | Parotid | G2Si | E | 459.7 | 0.98 | 8 | 364.7 |
| H4N7 | 62 | 2184.7 | Ovalbumin | G2Si | I | 453.1 | 0.90 | 12 | 359.0 |
| H3N8 | 48 | 2225.8 | Ovalbumin | G2Si | I | 462.0 | 0.55 | 12 | 366.4 |
| H6N5F1 | 17 | 2248.7 | AGP | G2Si | E | 464.5 | 0.35 | 2 | 368.8 |
| H5N4F4 | 54, 55 | 2321.8 | Parotid | G2Si | E | 477.2 | 0.79 | 8 | 380.1 |
| H5N4F5 | 56 | 2467.8 | Parotid | G2Si | E | 498.7 | 1.06 | 8 | - |
| H7N6 | 23 | 2467.8 | AGP | G2Si | E | 484.9 | 0.00 | 2 | - |
| H7N6F1 | 22 | 2613.9 | AGP | G2Si | E | 510.4 | 0.42 | 2 | - |
Structures are in Scheme 1.
[M+H2PO4]- ion.
Measurements with the G2 instrument were averages of those made at various times over three years.
I = Internal calibration. E = External calibration; these were made on the same day and are the mean values obtained by varying the gas flow, wave velocity and wave height.
Estimated from helium/nitrogen correlation plot.
Asymmetric peak
Major isomer (minor isomer too low in abundance to give an accurate cross section measurement).
Isomers detected by fragment ion plots.
Isomers not resolved.
Figure 1.
Negative ion ESI spectra of N-glycans released from (a) chicken ovalbumin, (b) porcine thyroglobulin, (c) human IgG, (d), gp120, (e) α1-acid glycoprotein (AGP) and (f) human parotid glycoproteins. Symbols for the structures shown in this and the other figures are as defined in the legend to Scheme 1 with the addition of  = Neu5Ac (sialic acid). Numbers in bold accompanying the structures are listed in Scheme 1.
Ion mobility measurements
The earlier work confirmed that Glc2-Glc13 oligomers from dextran were suitable calibrants for the TWIMS cell and were used in this work53. Some measurements were made at various times over the course of three years with the G2 instrument whereas others were made with the G2Si instrument with calibration spectra run in the same session (see Table 1). It was found that multiple measurements of a given glycan made on the same day were virtually identical but those made some time apart with the G2 instrument, in particular, tended to be slightly different, sometimes by as much as 5 Å2. The various factors affecting the estimated cross sections on the TWIMS instrument were investigated further and will be the subject of a later report. In summary, factors such as IMS gas flow, gas velocity and wave height, and sample concentration made little difference to the measurements. The most reliable results were obtained with internal calibration (indicated by “I” in column 6 of Table 1).
General effects of structure on cross section
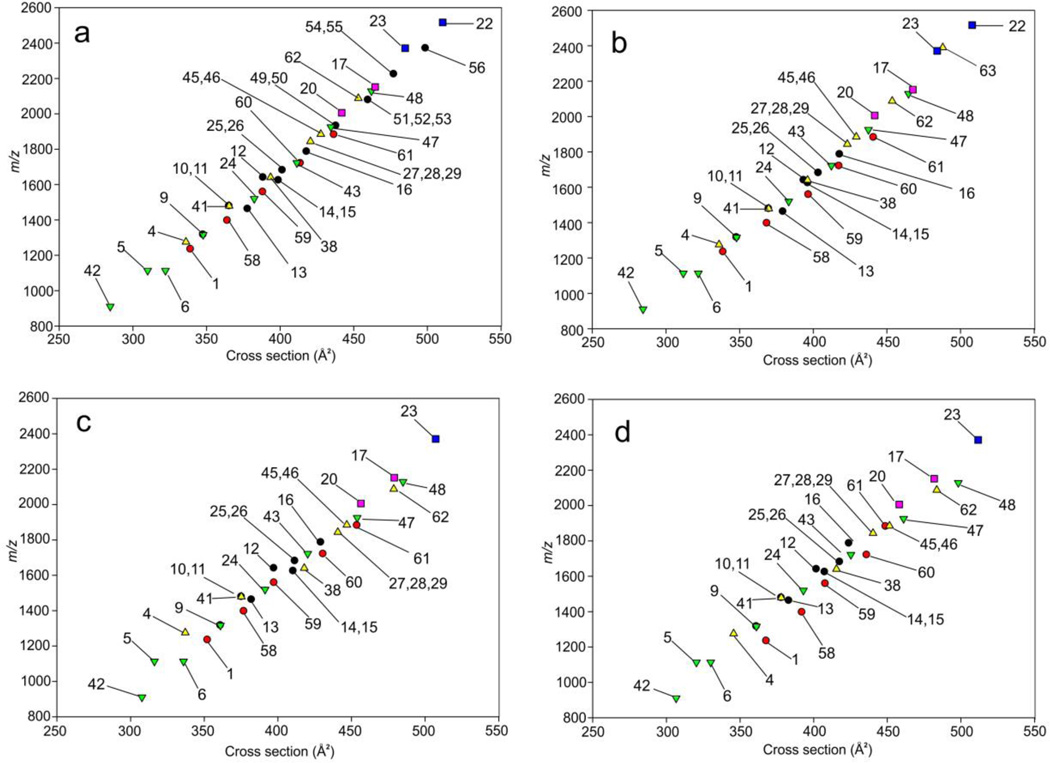
Figure 2a shows a plot of the measured cross sections of all major glycans from the glycan mixtures (high-mannose, hybrid and complex) against m/z in negative ion mode. In general, these fell roughly on the same trend line without any particular trend identifying a particular glycan type. Possible exceptions were the glycans Hex4GlcNAc3 (4) and Hex4GlcNAc4 (10, 11) which gave slightly smaller cross sections than those falling on the general trend line. The same result was seen after reduction (Figure 2b). In positive mode (Figure 2c), the same differences were seen although they appeared to be a little more pronounced whereas, after reduction (Figure 2d), the smaller high mannose glycans (particularly Man5GlcNAc2 (1) and Man6GlcNAc2 (58) showed significantly larger cross sections.
Figure 2.
(a) Plot of cross section against m/z for the phosphate adducts of the N-glycans. Numbers refer to the structures listed in Scheme 1. (b) A similar plot of the phosphate adducts of the reduced glycans. (c) Plot of cross section against m/z for the sodium adducts of the N-glycans (positive ion mode. (d) Corresponding plot of the sodium adducts of the reduced glycans.
Effect of substituents on cross sections of biantennary glycans
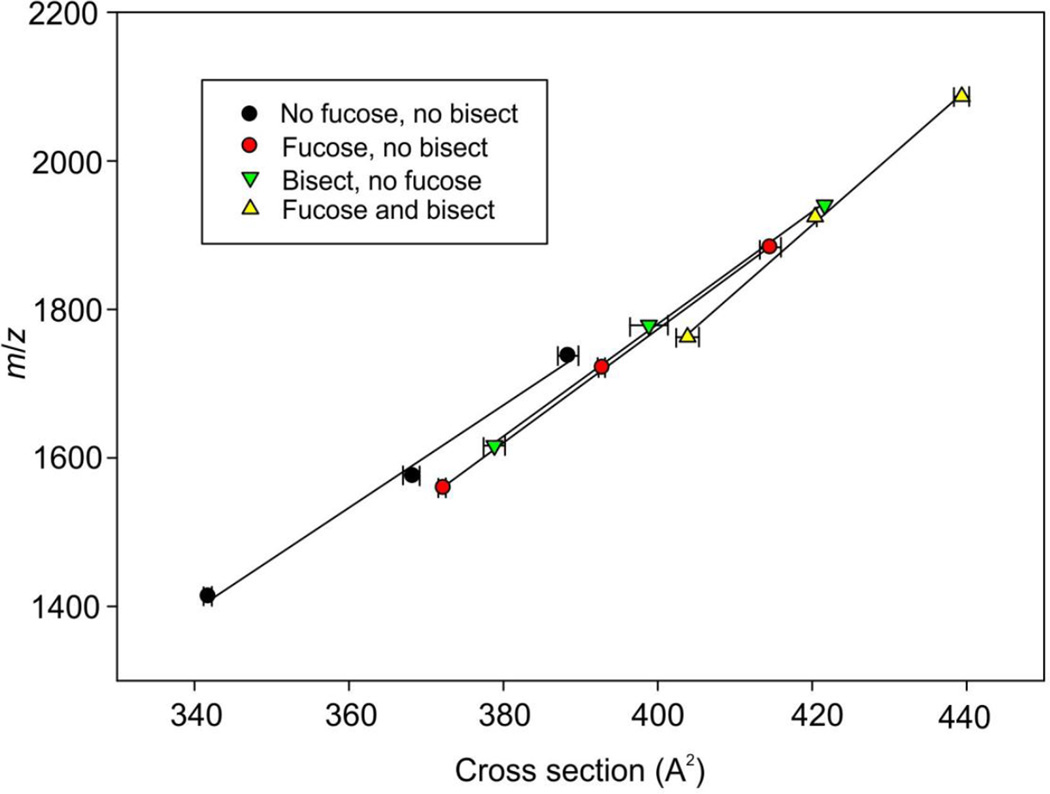
At a more detailed level, some trends were observed between fucosylated and bisected glycans obtained from IgG. The glycans in this glycoprotein (profile shown in Figure 1c) are biantennary complex carbohydrates with (13-16) and without (9-12) a fucose residue on the core GlcNAc and also, with a bisecting GlcNAc residue (24-27 and 30-33). Figure 3 shows the negative ion m/z:cross section plots of these compounds (phosphate adducts) measured with the Synapt G2 instrument. A parallel experiment with [M+Cl]− adducts on the G1 instrument gave identical results. The plots from the major fucosylated glycans with zero, one and two galactose residues (compounds 13-16, commonly known as G0F, G1F and G2F respectively) produced a linear relationship. A similar result was obtained for the corresponding compounds without fucose (9-12) but the plot was displaced towards shorter drift times (Figure 3). Thus, fucosylated glycans showed longer drift times and cross sections than their unfucosylated counterparts of similar molecular weight. Similar results were obtained in positive ion mode ([M+Na]+ ions) and from the G2 instrument (data not shown). When sialic acid was attached to the antennae, a similar effect was obtained; i.e. the presence of the core fucose residue produced a relative increase in the drift time of the trend line.
Figure 3.
Plot of estimated cross sections against m/z for the phosphate adducts of biantennary glycans from IgG with zero, one and two galactose residues. The four lines connect these glycans having additional core fucose (13-16, red circles), bisecting GlcNAc (24-27, green inverted triangles), both fucose and bisecting GlcNAc (30-33, yellow triangles) and no additional substituents (9-12, black circles). Error are standard deviations (n = 5).
Corresponding plots were made with the biantennary glycans containing a “bisecting” GlcNAc residue with (compounds 30-33) and without (24-27) a fucose residue. In each case, the plots were linear and the presence of the bisecting GlcNAc caused a shift to longer drift times although the effect was not as great as that for fucose. The effect of both a core-fucose residue and a bisecting GlcNAc was roughly additive (Figure 3). Again, similar results were obtained from the G1 instrument with [M+Cl]− ions. Unfortunately, the ions from the unfucosylated compounds with bisecting GlcNAc residues in the positive ion spectra of the IgG samples were not abundant enough to give reliable readings for cross sections.
Resolution of isomers
In general, the resolution of the ion mobility cell of the Synapt instruments was not sufficient to separate many of the isomers present in these samples. However extracted fragment ATDs of diagnostic ions22, 23, 56, 57 allowed the components at several m/z values to be deconvoluted as shown in the examples below. Comparisons of cross sections measured in this way with those measured directly with the drift tube instrument validated this approach. Cross sections of the glycans reported in this paper are listed in Table 1. Below are examples where this technique allowed isomers to be detected.
Glycans of composition Man3GlcNAc3 and Man3GlcNAc3Fuc1
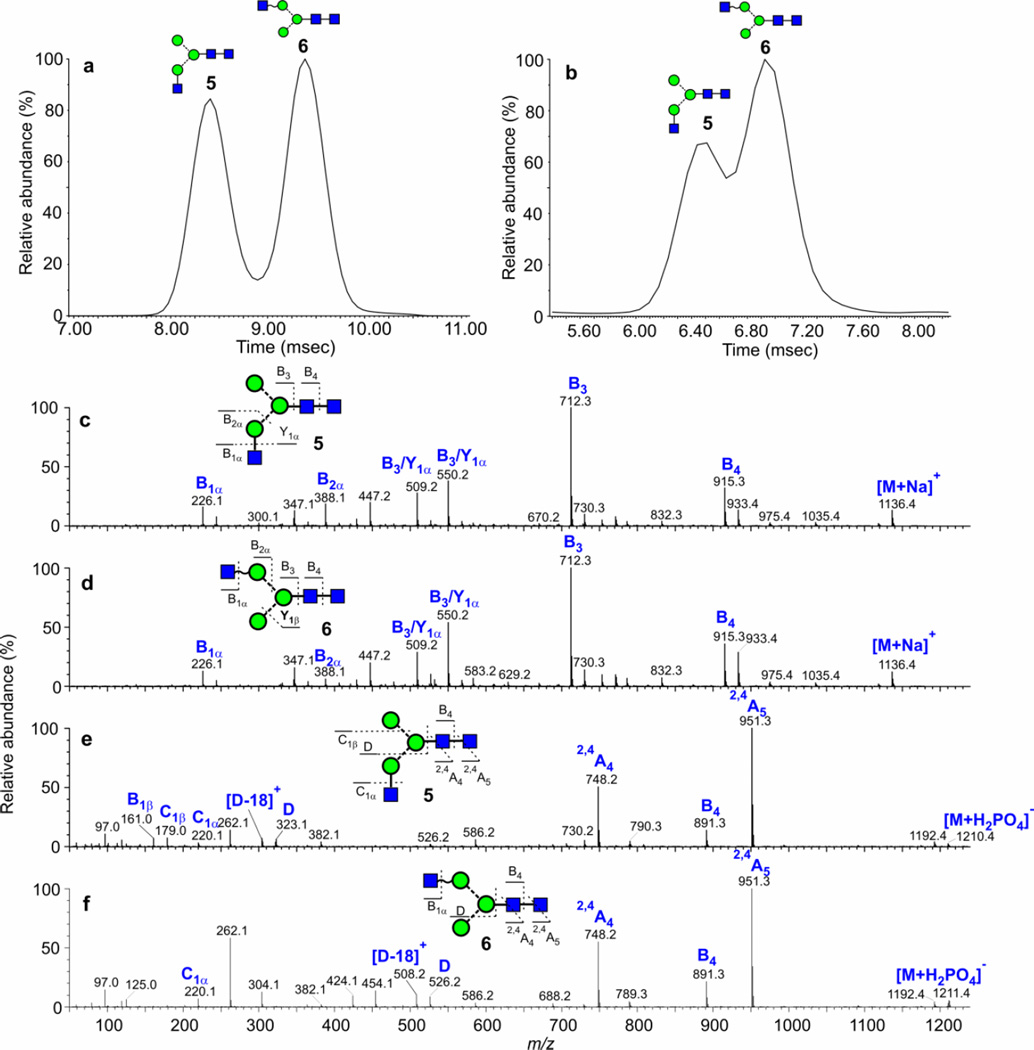
The ability of ion mobility to separate isomers of small N-linked glycans was demonstrated earlier with the Waters Synapt G1 instrument using the two Man3GlcNAc3 isomers (5, 6, Scheme 1) from chicken ovalbumin18 (glycan profile in Figure 1a). Although three peaks were detected in negative ion mode, only compounds 5 and 6 were identified. Later work with the G258 and G2Si instruments, reported here, reproduced the positive ion separation but only resolved two isomers in negative ion mode even though the resolution was higher and suggesting that, in fact, only two compounds were present. Resolution of the two isomers was almost to baseline in positive ion mode ([M+Na]+ ions, m/z 1136) (Figure 4a) although somewhat less so in negative mode with the [M+H2PO4]− ions (m/z 1210, Figure 4b). Reduction of the glycans made no difference to the separation. Structural assignments of the isomers were made by negative ion fragmentation (Figure 4e,f). These spectra showed that the isomer with the largest cross section had a GlcNAc residue attached to the 6-antenna (6) as indicated by the D, D-18, 0,3A3 and 0,4A3 ions at m/z 526, 508, 454 and 424 respectively (Figure 4f). These ions contain the branching mannose residue and substituents from the 6-antenna10. The linkage position of the GlcNAc residue to the 6-antenna was not determined. The isomer with the smaller cross section was the 3-substituted isomer 5 as shown by the appearance of the D, D-18, 0,3A3 and 0,4A3 ions 162 mass units lower at m/z 323, 305, 292 and 262 (Figure 4e). The positive ion spectra (Figures 4c and 4d) were virtually identical to each other and differed mainly in the relative abundance of the ion at m/z 388 ([Gal-GlcNAc+Na]+). This difference did not allow the individual isomers to be identified, clearly emphasising the advantage of using negative ion fragmentation for deducing the structures of N-glycans. Jiao et al.20 in an MSn study also reported the presence of isomers of the Man3GlcNAc3 glycan containing a GlcNAc residue on either antenna but their experiment did not involve ion mobility and did not allow the compounds to be separated. A third, bisected isomer reported in their paper was not detected by us using ion mobility and negative ion CID with the G2Si instrument. Although it is possible that this isomer might have been responsible for the third peak reported earlier with the G1 instrument, the reported spectrum18 was not consistent with a bisected structure of this type. Cross sections are listed in Table 1.
Figure 4.
(a) ATD plot of m/z 1136 (Man3GlcNAc3, 5, 6, M+Na]+ ion) from chicken ovalbumin recorded with the Synapt G2 instrument (wave velocity 600 m/sec, wave height 40 V) showing separation of isomers. (b) Corresponding negative ion plot ([M+H2PO4]− ions, wave velocity 450, wave height 40 V), (c and d) Positive ion CID spectra of the compounds producing the two peaks in the ATD profile shown in panel a. (e and f) Negative ion CID spectra of the compounds producing the two peaks in the ATD profile shown in panel b. Fragment ions are labelled according to the scheme proposed by Domon and Costello48.
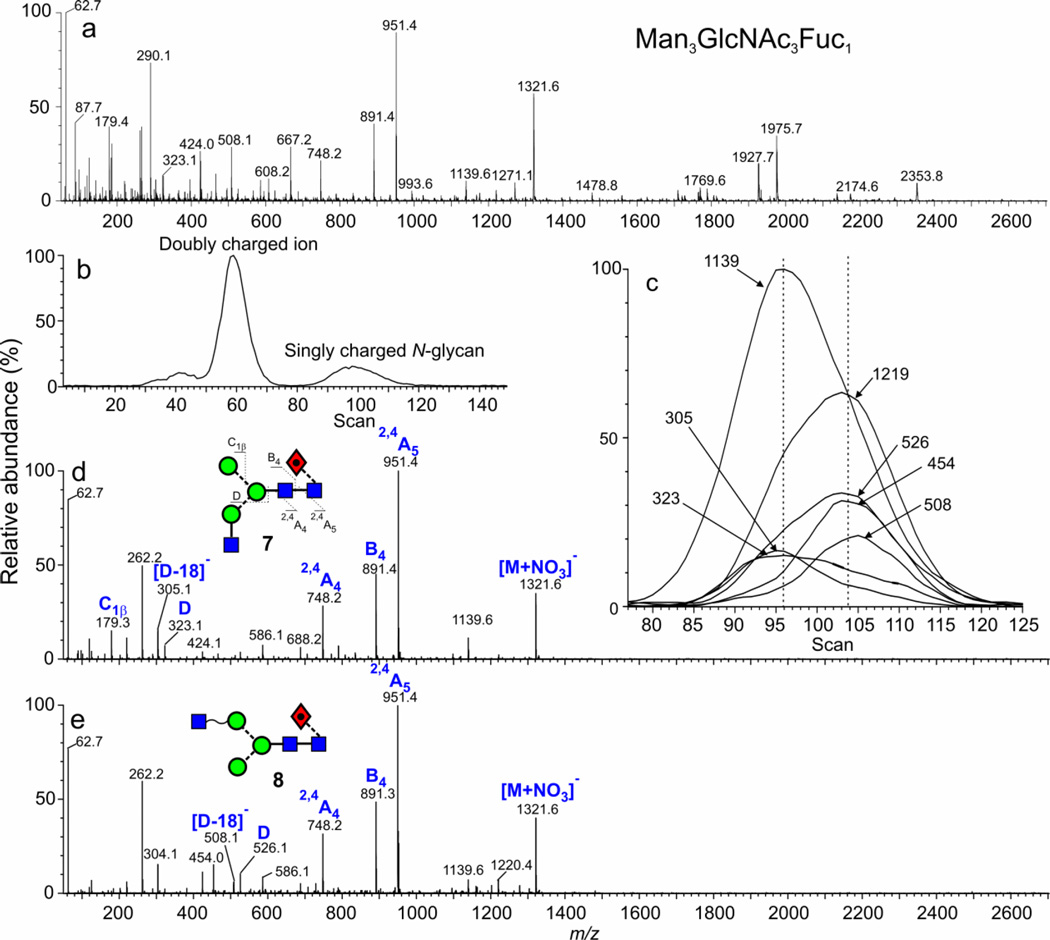
The fucosylated analogues of these isomeric glycans (7, 8), present in the mixture of glycans released from thyroglobulin (Figure 1b) and gp120 (Figure 1d) also showed separation but the difference in cross sections were less, such that only a single broad ATD peak was observed. Possibly different linkage isomers were present to those being separated than for the un-fucosylated isomers discussed above, but this was not determined. However, the CID spectra did confirm substitution of the third GlcNAc residue on either antenna. As discussed below, other pairs of isomers were found that gave different estimated cross sections and where the unfucosylated pair gave better separations than those isomers bearing a core-fucose. These isomers (7, 8) were also separated as nitrate adducts from thyroglobulin (equivalent to m/z 1356.4 in the glycan profile of phosphate adducts shown in Figure 1b) but, in this case, the molecular ion at m/z 1321.5 was coincident with that from an abundant doubly charged sialylated glycopeptide giving a complicated CID spectrum (Figure 5a). This situation provided an excellent example of where ion mobility could be used to separate these compounds. The fragments from the doubly charged ion, which fell in a different mobility band (Figure 5b), were removed by selecting only the singly charged ions from the DriftScope display (Figure 5b). Then, the CID spectra were extracted from each side of the ATD peak from the N-glycan (Figures 5d and 5e). These spectra were characteristically different and showed that the second isomer (Figure 5e) was the one with the GlcNAc residue on the 6-antenna (8). The diagnostic ions for this isomer were the D, [D-18]− and 1,3A3 ions at m/z 526, 508 and 454 respectively9, 10. In the spectrum recorded from the left-hand edge of the ATD peak (smaller cross section), these ions were missing but the D and [D-18]− ions were replaced by the corresponding ions 203 mass units lower at m/z 323 and 305 respectively showing that the GlcNAc residue was located on the 3-antenna (7). Although the shape of the ATD peak (Figure 5b) did not reflect the presence of these isomers, they were detected by differences in the extracted fragment ATDs (from Figure 5d and 5e) which maximized at different positions within the width of the ATD peak (Figure 5c), confirming the presence of isomers (indicated by the two dotted lines in Figure 5c). As with the related unfucosylated glycan from ovalbumin (5, 6), the positive ion spectra for the two isomers showed little difference except for the relative abundance of the ion at m/z 388 and did not allow structures to be assigned to the ions.
Figure 5.
(a) Negative ion CID spectrum of the ion at m/z 1321 from the nitrate adducts of N-glycans released from porcine thyroglobulin (G1 instrument, wave velocity 450 m/sec, wave height 14 V) (b) ion mobility profile of m/z 1321 showing separation of singly and doubly charged ions (c) extracted fragment ATDs from the singly charged ion at m/z 1321 obtained in the transfer cell (d) CID spectrum from the leading edge of the mobility peak (compound 7) (e) CID spectrum from the trailing edge of the mobility peak (compound 8).
Hybrid glycans from gp120
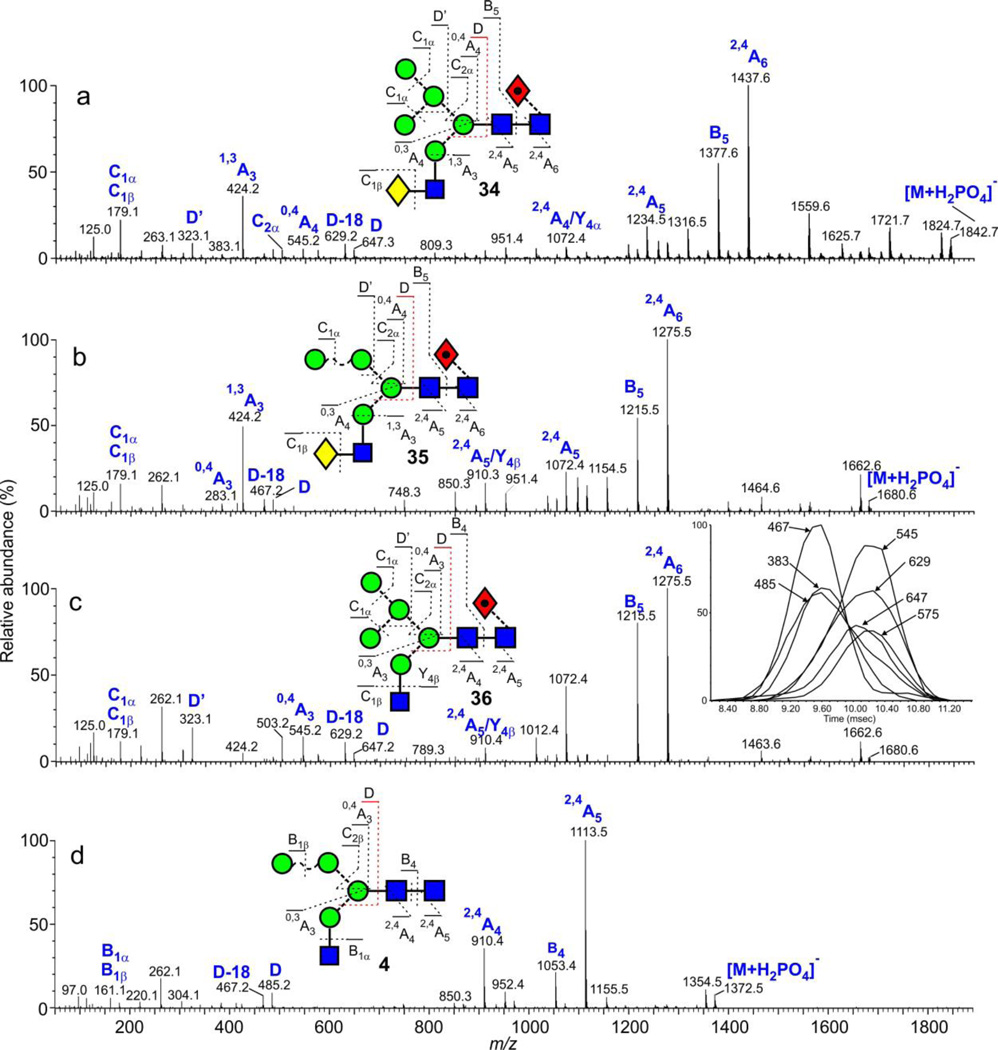
Other isomeric compounds that could be separated by ion mobility were the hybrid glycan pairs H5N3 (2, 37)26 and H5N3F1 (35, 36, positive ion)58 reported in earlier publications. Negative ion spectra of compounds 35 and 36 are shown in Figure 6 together with that of Hex6GlcNAc3Fuc1 (34, Figure 6a) released from gp120 to illustrate the general fragmentation of these hybrid glycans. 2,4A6 and 2,4A5 cross-ring fragment ions at m/z 1437 and 1234 respectively together with the B5 fragment at m/z 1377 define the β1→4-linked chitobiose core and the presence of the fucose residue at the 6-position of the reducing-terminal GlcNAc. The cross-ring fragment at m/z 424 (Gal-GlcNAc-O-CH=CH2-O−) is diagnostic for the galactose-terminated antenna and the composition of the 6-antenna is specified by the D, D-18, 0,3A4, 0,4A4 and B2α ions at m/z 647, 629, 575, 545 and 503 respectively. All fragment ions show the same profile as the ATD of the molecular ion as would be expected for a single compound.
Figure 6.
(a) Negative ion CID spectrum of the hybrid N-glycan Gal1Man5GlcNAc3Fuc1 (34, m/z 1842.6). (b) Negative ion CID spectrum of the hybrid N-glycan Gal1Man4GlcNAc3Fuc1 (35, m/z 1680.5). (c) Negative ion CID spectrum of the hybrid N-glycan Man5GlcNAc3Fuc1 (36, m/z 1680.5). The inset shows extracted fragment ATDs of diagnostic fragment ions from the spectra shown in panels b and c. (a) Negative ion CID spectrum of the hybrid N-glycan Man4GlcNAc3 (4, m/z 1372.4).
The ion at m/z 1680.5 in the negative ion CID spectrum of the gp120 glycans contains the two compounds (35 and 36). It shows an asymmetrical ATD peak attributable to these two compounds and extracted fragment ATDs clearly resolve two constituents (inset to Figure 6c). Plotting spectra from each side of the ATD peaks from these compounds (with and without fucose) allowed reasonably clean spectra of each of the constituents to be extracted (Figure 6b and 6c, with fucose and see Figure 4 from reference26 for the compounds without fucose). Thus, the 2,4A6(5), 2,4A5(4) and B5(4) ions at m/z 1275, 1072 and 1215 respectively (Figure 6), which have the same asymmetric profile as the molecular ions, define the same core and fucose location in both compounds 35 and 36. The first constituent (35, Figure 6b) produced the 1,3A3 cross-ring fragment at m/z 424 confirming the Gal-GlcNAc antenna and a shift of the D, D-18, 0,3A3, 0,4A3 and B2α ions to m/z 485, 467, 413, 383 and 341 respectively reflecting the absence of one mannose residue from the 6-antenna. The linkage position of the mannose on the 6-antenna was not determined. The spectrum of the second constituent (36, Figure 6c) exhibited D, D-18, 0,3A3, 0,4A3 and B2α ions at the same mass as in the spectrum of compound 1 reflecting the extra mannose in the 6-antenna. Positive ion spectra of these two glycans, extracted from an asymmetrical ATD peak have been published58.
Cross sections were calculated from these fragment ions using extract fragment ATDs (G2Si instrument) by the method described by Thalassinos et al.54 (Table 1). As was found in the earlier study on high-mannose glycans, drift times extracted from ions in the full mass spectrum were slightly higher than those measured from the same ion when selected for fragmentation and, consequently, an offset, calculated from the ions at m/z 1655 of 0.49 msec was added to the measurements of the fragment ions. This method gave cross sections of 385.4 and 405.0 A2 for compounds 35 and 36 respectively. Compound 35 was considerably more abundant than compound 36 and its cross section was measured directly from the full spectrum. The value of 385.7 A2 agreed very well with that measured by the fragment ion method for the first peak, thus validating the method.
The ion at m/z 1534.5 (Hex5GlcNAc3) in the negative ion spectrum of the gp120 glycans was produced by the corresponding compounds (2, 37) without fucose. These compounds were similarly separated by ion mobility (not shown) and cross sections of 373.9 A2 and 357.6 A2 respectively were measured for the two compounds by extracted fragment ATDs. Glycans with and without core fucose and with only four hexose residues (Hex4GlcNAc3 and Hex4GlcNAc3Fuc1, m/z 1372.4 and 1518.5 respectively) in the spectrum of gp120 glycans appeared to lack the Gal-GlcNAc-containing species and to be represented by only the high-mannose glycans (4 and its core-fucosylated analogue 57). The spectrum of Man4GlcNAc3 (4) is shown in Figure 6d.
Glycans of composition Hex5GlcNAc4 (m/z 1737.6) from ovalbumin
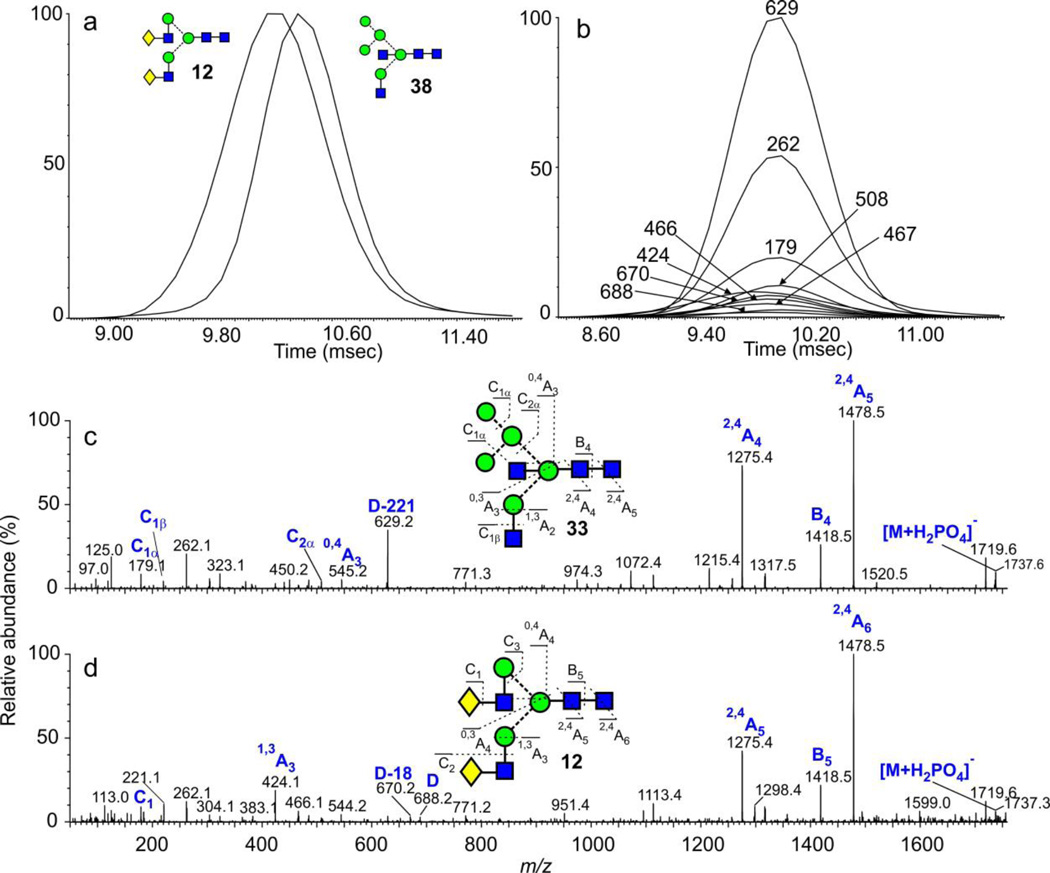
The glycan of composition Hex5GlcNAc4 from ovalbumin has predominantly the bisected hybrid structure 38 and is used as a reference standard because it has always been assumed to be a single compound. Its CID spectrum (Figure 7c) contained a prominent ion at m/z 629 formed as a fragment of the D ion (formal loss of the chitobiose core and the 3-antenna) by elimination of the bisecting GlcNAc residue. This prominent ion (m/z 629), in the absence of the related D ion, has been shown to be diagnostic for bisecting glycans with three mannose residues in the 6-antenna9, 10 confirming the structure of glycan 38. However, a recent publication19 reported three peaks in the mobility spectrum of the [M+2Na]2+ ion from this glycan (per-methylated derivative) obtained from ovalbumin from the same commercial source. These compounds were assigned the structures 38, 39 and 40 on the basis of molecular modelling. Three compounds of this composition were also detected from ovalbumin by Saba et al.59 using SymGlycan software but, in this case, isomers 12, 38 and 39 were proposed. Relative quantities were not reported. The symmetrical ATD peak (Figure 7a) and mobility-separated fragmentation spectrum of this compound as its [M+Na]+ and [M+2Na]2+ ions recorded by us from our sample with the Synapt G2 and G2Si instruments showed little evidence of more than one compound (38). Also, ion profiles of most fragment ions in the negative ion spectrum ([M+H2PO4]− ion) from both the PNGase F- and endoH-released glycan were virtually identical. Figure 7b shows the ion profiles from the PNGase F-released glycans. It has yet to be determined if permethylation increases the ability to separate these isomers or if our sample has a different composition from the one used by Plasencia et al.19.
Figure 7.
(a) ATD profiles of the [M+H2PO4]− ions from the isomeric biantennary (12) and hybrid (38) glycans of composition Hex5GlcNAc4 (m/z 1737). Both peaks have been normalized to 100%. (b) Extracted fragment ATDs of diagnostic fragment ions for the peak at m/z 1737.6 from chicken ovalbumin. The spectrum is shown in panel c. Most ions arise from the bisected hybrid glycan (38). (d) Negative ion CID spectrum of the biantennary complex glycan Man5GlcNAc4 (12, m/z 1737.6). The ion at m/z 424 characterizes the biantennary structure.
The minor ion at m/z 424 ([Gal-GlcNAc-O-CH=CH-O]−) in the spectrum shown in Figure 7c, is a 1,3A cross-ring cleavage ion and is an abundant (frequently the base peak) diagnostic ion for glycans containing Gal-GlcNAc chains10 as in the example above and suggests the presence of compounds 12 or 40 in trace amounts. The ion at m/z 466 (Gal-GlcNAc + 101) is also characteristic of this structural feature. The ATD profile of the ion at m/z 424 was slightly displaced to the left (smaller cross section) compared with those of the other fragment ions (Figure 7b) suggesting that it was not from compound 40 (assuming that the same relationship exists between cross sections in positive and negative ion modes). The positive ion cross section of compound 40 reported by Plasencia et al. was considerably higher than that of the main compound (38). Figure 7d shows the spectrum extracted from the left-hand region of the ATD peak (8.9 - 9.8 msec, Figure 7a). It contained prominent ions at m/z 688 and 670, corresponding to the D and D-18 ions from the biantennary glycan 12. In addition, the cross section of this glycan calculated from the fragment ions matched that of the biantennary glycan 12 (obtained from IgG and de-sialylated fetuin, Table 1); Figure 7a shows the ATDs of this compound (from bovine fetuin) and compound 38 (from ovalbumin) showing a similar difference in drift times. The smaller cross section of the complex biantennary glycan (12) compared with the bisected hybrid glycan (38) is consistent with the results on general trends discussed above. Slightly better separation of these compounds has been obtained previously in positive ion mode58 and is shown in Figure 2d.
The fragmentation spectrum of glycan 39, reported by Plasencia et al, would contain a prominent E-type fragment ion at m/z 507. An extracted fragment ATD of this ion gave two peaks; one was coincident with the bisected compound (38), the other displayed a longer drift time. However, this extracted fragment ATD, although suggestive, was not enough to confirm the presence of compound 39. Plasencia et al. report a cross section smaller than that of glycan 38. In our sample, therefore, the peak at m/z 1737 (Hex5GlcNAc4) appears to consist mainly of the bisected glycan 38, together with a very small amount of the biantennary glycan 12. Definitive evidence for the presence of compounds 39 and 40 in our sample was not obtained. Reduction gave only a single ATD peak with no sign of isomer separation. Unfortunately, the recent study by Jiao et al.20 on isomers from ovalbumin did not include this compound.
Glycans of composition Hex4GlcNAc4 (m/z 1575.5) from ovalbumin
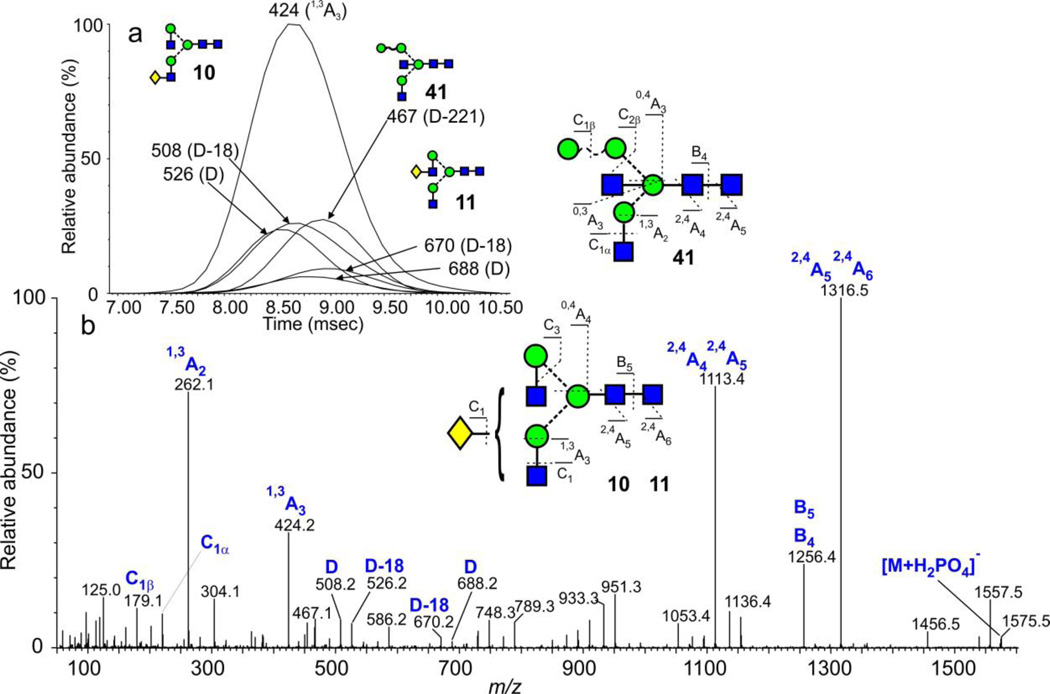
Many of the other ions from ovalbumin are produced by isomers36 but few could be separated by ion mobility with the G2 instrument. One instance where isomers were partially separated was the peak at m/z 1575.5 corresponding to Hex4GlcNAc4 (phosphate adduct, Figure 8). In this example, three compounds were detected. The composition corresponded mainly to the structures 10 and 11 and the presence of these compounds was confirmed by extracted fragment ATDs of the 1,3A3, D and D-18 ions (Inset to Figure 8). The negative ion CID spectrum of this ion (Figure 8) was more complicated than that observed from reference spectra of compounds 10 and 11 (obtained from IgG), consistent with work by Jiao et al.20 who reported the presence of five isomers at this mass following investigations by MSn on permethylated samples. Da Silva et al.36, on the other hand, only reported the presence of the bisected compound 41. This latter compound should produce a D-221 ion at m/z 467 and this ion was present, although at a relatively low abundance. Its cross section was similar to that of the 6-Gal isomer of the biantennary glycan (11). Reduction gave a similarly shaped ATD peak as that shown in Figure 8a (slightly extended at the right-hand edge) consistent with the presence of isomers.
Figure 8.
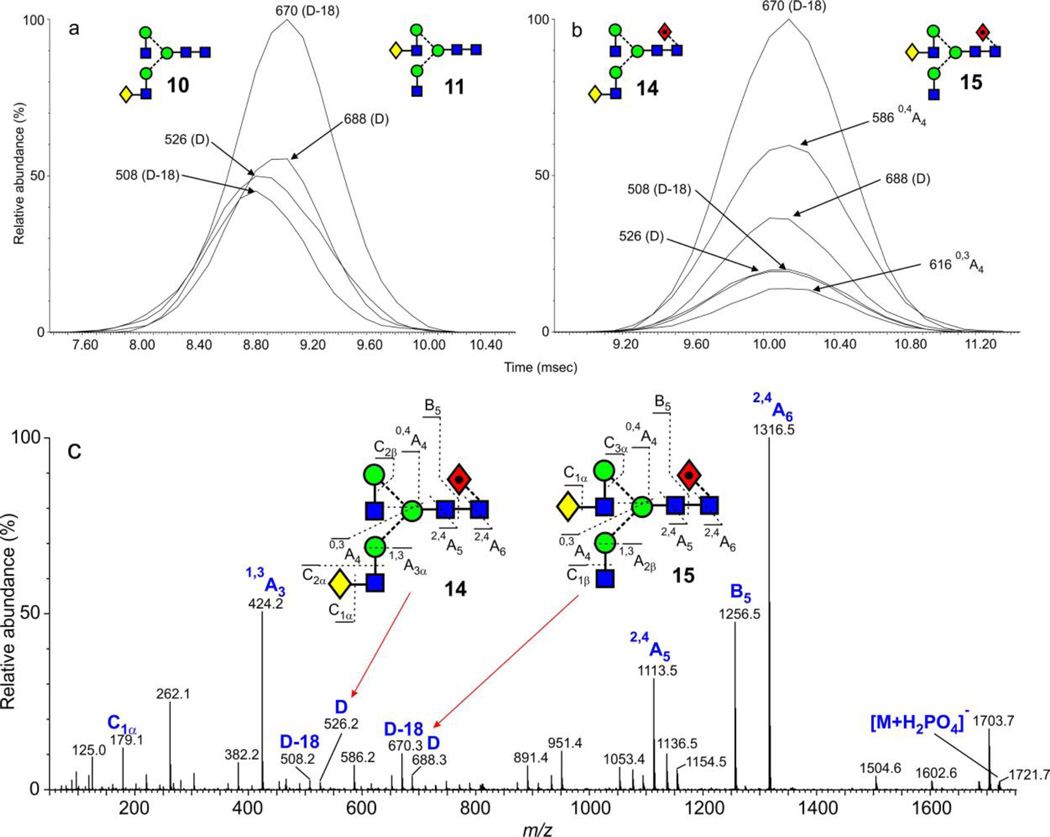
(a) ATDs of the D and D-18 fragment ions from the [M+H2PO4]− ions from the monogalactosylated biantennary glycans (10, 11, m/z 1575.5) from IgG showing slight separation of the two isomers (10, 11). (b) Corresponding plots from the core-fucosylated glycans (14, 15) showing no separation. (c) Negative ion CID spectrum of the [M+H2PO4]− ions from the two fucosylated monogalactosylated biantennary glycans (14, 15) from IgG with D and D-18 ions confirming the presence of the two isomers.
Glycans of composition Hex5GlcNAc5 (m/z 1940.6) from ovalbumin
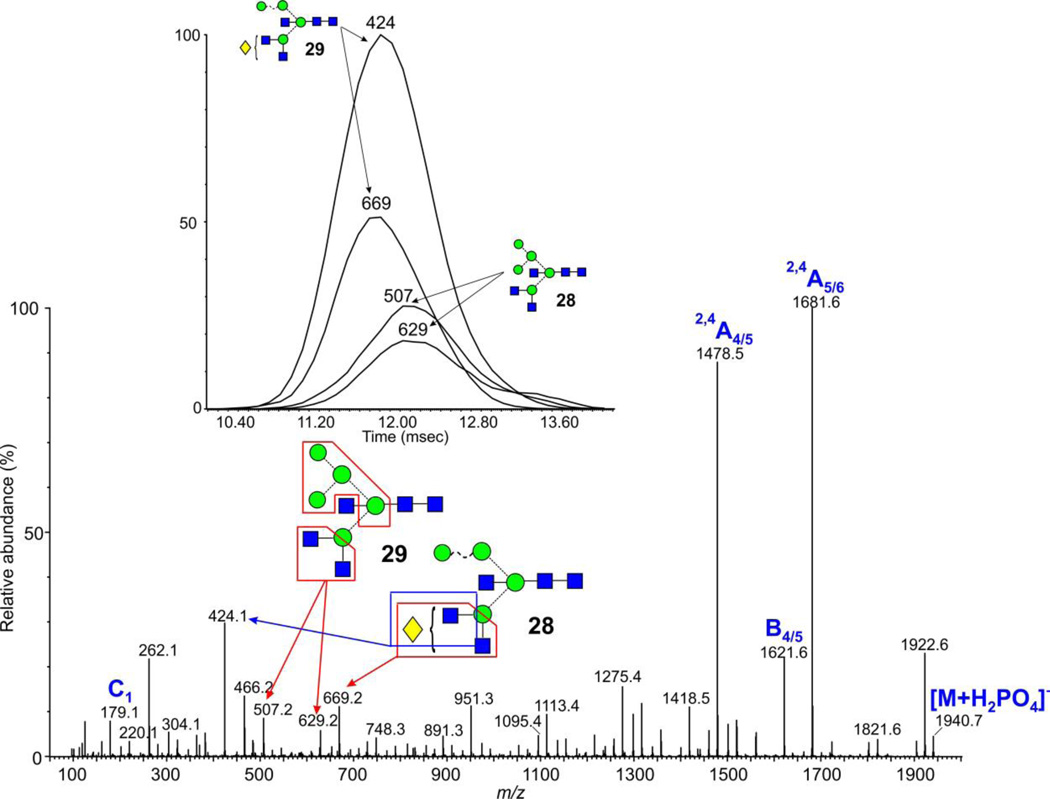
Separations were also found with the two glycans 28 and 29 which showed slightly different drift times as demonstrated by the separation of the diagnostic fragment ions illustrated in Figure 9.
Figure 9.
Negative ion mobility extracted CID spectrum of the ion at m/z 1940.7 from ovalbumin. The inset shows the extracted fragment ATDs of ions diagnostic for the two isomers shown and the boxes on the structures indicate the origin of the ions.
Biantennary glycans
The biantennary glycans from IgG (glycan profile in Figure 1c) with one galactose residue (10, 11, 14, 15) exist as isomers with the galactose residue on either antennae. The presence of these isomers can be clearly seen in the negative ion fragmentation spectrum (Figure 10c, mixed isomers) by the two sets of D and D-18 ions at m/z 526/508 (3-galactose isomer 14) and at m/z 688/670 (6-galactose isomer 15), consistent with the data in Figure 10 and with HPLC data, the isomer with the galactose on the 6-antenna was the more abundant. It would be expected that these isomers would show a difference in drift time and this was found to be the case for the pair 10 and 11 without fucose (as in Figure 8a). A difference of about 5 Å2 was measured. Extracted fragment ATDs of the diagnostic fragments are shown in Figure 10a where it can be seen that the isomer with the galactose in the 6-antenna has the longer drift time and, hence cross-section. Its longer drift time is consistent with the result from the Man3GlcNAc3 isomers (above). However, no isomeric separation could be achieved in either the G1 or G2 instruments with the corresponding pair of isomers (14 and 15) with a fucose residue on the core. Figure 10b shows the relevant single fragment ion profiles. However, some limited separation was found earlier for chlorine adducts of the glycans released with the enzyme endo H and, thus, missing the terminal GlcNAc residue with its attached fucose60.
Figure 10.
(a) ATDs of the D, D-18 and D-221 fragment ions from the [M+H2PO4]− ions of the monogalactosylated biantennary glycans (10, 11) and bisected hybrid glycans (Hex4GlcNAc4, m/z 1575.5 from ovalbumin showing slight separation of the isomers. (b) Negative ion CID spectrum of the peak at m/z 1575.5 from chicken ovalbumin containing a mixture of the glycans 10, 11 and 41.
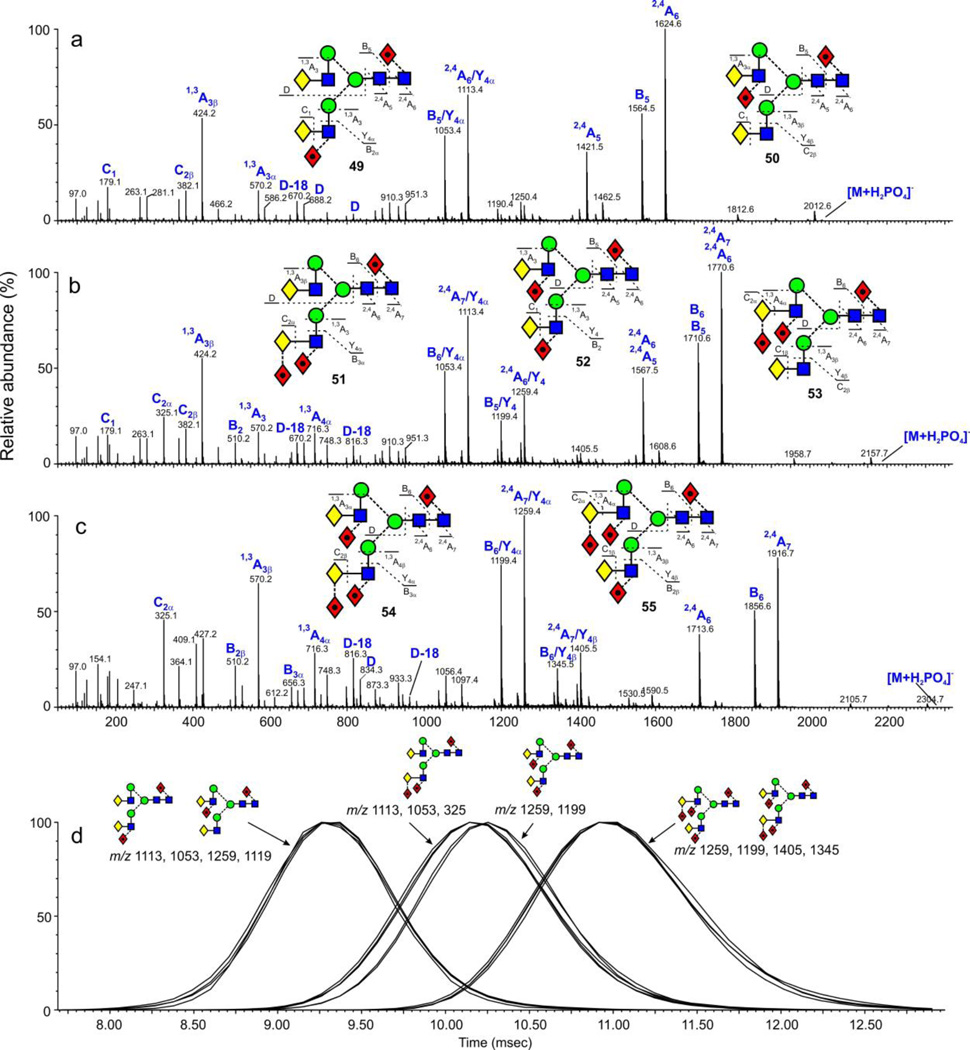
Biantennary glycans from the human parotid gland (Figure 1f) exist with zero (16) and with one to five fucose residues (49-56). The di- (49, 50), tri- (51, 52, 53) and tetra-fucosylated glycans exist as isomers. Negative ion CID spectra of the ion at m/z 2029.7 (Figure 11a) showed that it was produced by the two difucosylated glycans 49 and 50 with compound 49 being dominant. Extracted fragment ATDs (smooth: mean, window size ±2) of the D, D-18 and 0,4A4 ions (m/z 688, 670, 616 and 834, 816, 762 showed no significant difference in drift time indicating little or no separation between these isomers. Three isomers (51, 52, 53) of the trifucosylated biantennary glycans (m/z 2175.7, Figure 11b) were present. Extracted fragment ATDs of the D, D-18 and 0,4A4 ions (m/z 688, 670, 616 and 834, 816, 762 respectively) for compounds 51 and 52 showed a slight difference in drift time for the D and D-18 ions (masses as above) suggesting slight differences in cross section and this was confirmed by extracted fragment ATDs for the pairs of ions at m/z 1113.4, 1199.4 and 1259.5, 1199.5 which are formed by loss of the 3-antenna from the 2,4A7 (m/z 1770.6) and 2,4A6 (m/z 1710.6) respectively (full details of the fragmentation of these compounds will be published separately). The extracted fragment ATD of m/z 325 (C1 fragment from the difucosylated 3-antenna) showed coincidence with the fragment ATDs of the ions (m/z 1113.5 and 1199.4) that had lost the difucosylated 3-antenna Figure 11d). However, because of the very small differences in the measured cross sections, these differences would not be a reliable indicator of structure. Fragments from the third isomer (53, Figure 11c) were too weak for symmetrical ATDs to be extracted. No corresponding separations were observed for the isomers (54, 55) of the tetra-fucosylated glycans (m/z 2321.8, Figure 11d).
Figure 11.
(a) Negative ion CID spectra of the di-fucosylated biantennary N-glycans from parotid glycoproteins. (b) Negative ion CID spectra of the tri-fucosylated biantennary N-glycans from parotid glycoproteins. (c) Negative ion CID spectra of the tetra-fucosylated bantennary N-glycans from parotid glycoproteins. (d) Extracted fragment ATDs of diagnostic ions (see text) defining the isomers of the tri-fucosylated biantennary glycans. Fragment ATDs were smoothed with the mean algorithm (window size ± 2 scans) from MassLynx and are all normalized to 100%.
Triantennary glycans
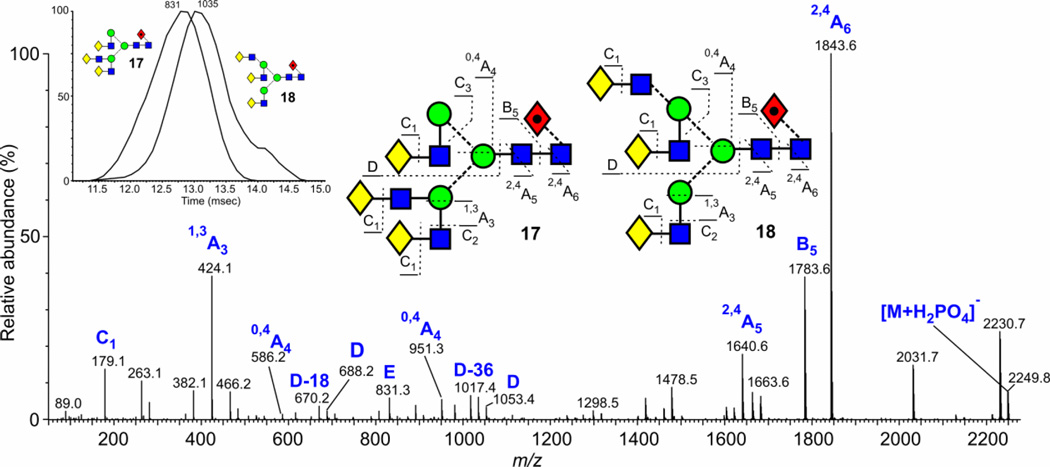
Two triantennary structures are commonly found in N-glycan mixtures. These have structures 17, 18, 20 and 21, and are readily identified by their production of diagnostic ions61. The isomers with two branches on the 3-antenna (17, 20) gives rise to a prominent fragment at m/z 831 and D and D-18 ions at m/z 688 and 670 whereas, in the spectrum of the other isomers (18, 21), the ion at m/z 831 is missing and the D and D-18 ions shift to m/z 1053 and 1035 accompanied by another fragment (D-36) at m/z 1017. Figure 12 shows a spectrum from gp120 where both isomers occur together. Extracted fragment ATDs of these diagnostic ions (m/z 831 and 1035, inset to Figure 12) showed that the isomer with the 6-branched antenna has a slightly larger cross section (about 6 Å2) than the other isomer but the spectra were rather too weak to obtain a reliable cross section measurement. The measurement in Table 1 for glycan 20 was from AGP (Figure 1e). The isomer of glycan 17 from AGP where the fucose resides on a GlcNAc of the 3-antenna (19) showed a very slightly larger cross section (about 3 A2) than that of the core-fucosylated glycan 17. Extracted fragment ATDs of the two sets of 2,4A6, B5 and 2,4A5 (m/z 1843, 1783, 1640 and 1989, 1929, 1786 for compounds 17 and 19 respectively) revealed the presence of the two compounds and the structures were confirmed by the presence of ions at m/z 831 (from 17), the corresponding fucosylated ion at m/z 977 (from 19) together with the ion at m/z 670 (Gal-(Fuc)GlcNAc-CH=CH2-O− from 19).
Figure 12.
Negative ion CID spectrum of the mixture of the two triantennary glycans 17 and 18 (Gal3Man3GlcNAc5Fuc1, m/z 2248.8 from gp120 (JFRC). The isomer with the branched 3-antenna (17) is characterized by the ions at m/z 831 (E), 688 (D) and 670 (D-18) and the isomer with the branched 6-antenna (18) produces the ions at m/z 1053 (D), 1035 (D-18) and 1017 (D-36)61. The inset is of the ATD profiles of the ions at m/z 831 and 1035 showing slight separation.
Conclusions
The above examples clearly show that ion mobility mass spectrometry adds a further dimension to the analysis of N-linked carbohydrates by mass spectrometry. Some isomeric separation was possible in both positive and negative ion modes but appeared to be marginally better in positive ion mode with, for example, [M+Na]+ ions from Man3GlcNAc3. Fragmentation, however, was considerably more informative in negative ion mode and yielded mass different ions from which the structures of the glycans and the presence of isomers could be deduced. Thus, good separation of the isomers of Man3GlcNAc3 (5, 6) from chicken ovalbumin was obtained and negative ion fragmentation allowed their structures to be determined. Several of the other glycans from ovalbumin were isomeric but, although some ATD peak broadening was observed with some of them, there was no obvious isomeric separation. However, if the compounds were fragmented in the transfer cell, extracted fragment ATDs showed that, in several cases, there was some separation within the peaks allowing isomers to be detected. The differences in cross section of many of these isomers were only a few Å2 and often less than the experimental error in measurements made at different times. Thus, although isomers could sometimes be detected using extracted fragment ATDs, use of their estimated cross sections for identification purposes was sometimes marginal unless internal calibration was used. In general only isomers of the smaller complex or hybrid glycans showed significant differences in cross section and it was noted that the presence of core fucose generally decreased the ability of ion mobility to separate isomers.
Some correlations between cross sections and structure were observed. Predominantly, substitution in the 6-antenna, as found earlier with the high-mannose glycans, usually produced larger cross sections than substitution on the 3-antenna. This effect was observed for the addition of GlcNAc to Man3GlcNAc2, for galactosylation of the unfucosylated biantennary glycans and for the isomers of triantennary glycans. Glycans carrying a bisecting GlcNAc residue tended to have larger cross sections than isobaric glycans lacking this feature.
There is always the possibility with this work that the separation observed in the mobility cell is due to conformers of a single compound rather than to isomers. Recent work from this laboratory on reduced N-glycans24 has shown that the predominant factor leading to asymmetrical ATD peaks in the larger high-mannose glycans is the anomeric configuration of the reducing terminal GlcNAc residue. This phenomenon is not new; separation of anomeric mono- and oligo-saccharides by ion mobility, particularly as [M+Na]+ ions from methyl glycosides, has been reported on several occasions62–66 and it has been proposed that separations reflect the way in which the adducted cation is bound to the individual sugar67. Whether this effect applies to the location of the phosphate adduct in the compounds reported in this paper has yet to be determined. As noted earlier24, asymmetric ATDs were observed from the higher high-mannose glycans leading to uncertainty in the estimated cross sections (note the larger variation in measurements for Man8GlcNAc2 (60) and Man9GlcNAc2 (61) in Table 1, compared to those of the smaller high-mannose glycans 1, 58, 59). These asymmetric ATDs, which were found to be due to reducing-terminal anomers, were rendered symmetrical by reduction. In contrast to the high-mannose glycans, little or no significant effects attributable to anomeric separations were observed with the hybrid and complex glycans. However, for compounds producing asymmetric ATDs, it would be wise to fragment the compound and check if the drift time peaks of fragments attributable to potential isomers maximise at the same point in time. Following reduction, the smaller high-mannose glycans showed larger cross sections than complex glycans of equivalent molecular weight but with other glycans, although the reduced form generally showed larger cross sections than the unreduced glycans, no consistent correlation with structure was noted.
The ability of ion mobility to separate isomers, albeit with rather low resolution at present, will be a great asset because one of the disadvantages of mass spectrometry (without fragmentation) is its difficulty in distinguishlng between such compounds. The ion mobility resolution obtained with the Synapt instruments does not yet match that of an HPLC column but is expected to rise with further instrumental developments. Ultimately, it might be possible to achieve adequate separations in the gas phase in milliseconds rather than the tens or hundreds of minutes required at present with LC-MS systems.
The work presented here, and by other investigators, shows that ion mobility has much to offer in glycobiology and is able to solve problems such as isomer resolution that, up to now, have required chromatographic separation. Combined with its ability to extract glycan ions from complex mixtures and, thus, eliminate some clean-up stages25, and by the production of negative ion CID spectra, the technique provides a much more rapid and information-rich method for the structural determination of N-glycans than has been available up to now.
Acknowledgments
We thank Professor Raymond Dwek for his help and encouragement. This work was supported by the International AIDS Vaccine Initiative Neutralizing Antibody Center CAVD grant (Glycan characterization and Outer Domain glycoform design), the Scripps CHAVI-ID (1UM1AI100663) and by the Oxford Glycobiology Bequest.
Abbreviations
- ATD
arrival time distribution
- CID
collision-induced decomposition
- ESI
electrospray ionization
- Fuc
fucose
- G1
Waters Synapt ion mobility mass spectrometer, first generation
- G2
Waters Synapt ion mobility mass spectrometer, second generation
- G0, G1, G2
biantennary glycans with zero, one and two galactose residues respectively
- G0F, G1F, G2F
Core fucosylated biantennary glycans with zero, one and two galactose residues respectively
- Gal
galactose
- Glc
glucose
- GlcNAc
N-acetylglucosamine
- HEK
human embryonic kidney
- HPLC
high-performance liquid chromatography
- Hex
hexose
- IgG
immunoglobulin G
- LC
liquid chromatography
- Man
mannose
- MS
mass spectrometry
- Neu5Ac
N-acetylneuraminic acid (sialic acid)
- PAGE
polyacrylamide gel electrophoresis
- PEG
polyethylene glycol
- PNGase F
protein N-glycosidase F
- TOF
time-of-flight
- TW IM-MS
T-wave ion mobility spectrometry
References
- 1.Harvey DJ, Scarff CA, Edgeworth M, Struwe WB, Pagel K, Thalassinos K, Crispin M, Scrivens J. Travelling-wave ion mobility and negative ion fragmentation of high mannose N-glycans. J. Mass Spectrom. 2016;51:219. doi: 10.1002/jms.3738. [DOI] [PMC free article] [PubMed] [Google Scholar]
- 2.Harvey DJ. Proteomic analysis of glycosylation: structural determination of N- and O-linked glycans by mass spectrometry. Expert Rev. Proteomics. 2005;2:87. doi: 10.1586/14789450.2.1.87. [DOI] [PubMed] [Google Scholar]
- 3.Harvey DJ. In: Electrospray and MALDI Mass Spectrometry: Fundamentals, Instrumentation, Practicalities, and Biological Applications. 2nd. Cole RB, editor. Hoboken, NJ, USA: John Wiley and Sons Inc; 2010. p. 723. [Google Scholar]
- 4.Alley WR, Jr, Mann BF, Novotny MV. High-sensitivity analytical approaches for the structural characterization of glycoproteins. Chem. Rev. 2013;113:2668. doi: 10.1021/cr3003714. [DOI] [PMC free article] [PubMed] [Google Scholar]
- 5.Alley WR, Jr, Novotny MV. Structural glycomic analyses at high sensitivity: A decade of progress. Annu. Rev. Anal. Chem. 2013;6:237. doi: 10.1146/annurev-anchem-062012-092609. [DOI] [PMC free article] [PubMed] [Google Scholar]
- 6.Harvey DJ. In: The analysis of post-translational modifications using mass spectrometry. Griffiths JR, Unwin R, editors. Wiley; 2016. In Press. [Google Scholar]
- 7.Harvey DJ. Fragmentation of negative ions from carbohydrates: Part 2, Fragmentation of high-mannose N-linked glycans. J. Am. Soc. Mass Spectrom. 2005;16:631. doi: 10.1016/j.jasms.2005.01.005. [DOI] [PubMed] [Google Scholar]
- 8.Harvey DJ. Fragmentation of negative ions from carbohydrates: Part 1; Use of nitrate and other anionic adducts for the production of negative ion electrospray spectra from N-linked carbohydrates. J. Am. Soc. Mass Spectrom. 2005;16:622. doi: 10.1016/j.jasms.2005.01.004. [DOI] [PubMed] [Google Scholar]
- 9.Harvey DJ. Fragmentation of negative ions from carbohydrates: Part 3, Fragmentation of hybrid and complex N-linked glycans. J. Am. Soc. Mass Spectrom. 2005;16:647. doi: 10.1016/j.jasms.2005.01.006. [DOI] [PubMed] [Google Scholar]
- 10.Harvey DJ, Royle L, Radcliffe CM, Rudd PM, Dwek RA. Structural and quantitative analysis of N-linked glycans by MALDI and negative ion nanospray mass spectrometry. Anal. Biochem. 2008;376:44. doi: 10.1016/j.ab.2008.01.025. [DOI] [PubMed] [Google Scholar]
- 11.Hoffmann W, Hofmann J, Pagel K. Energy-resolved ion mobility-mass spectrometry - A concept to improve the separation of isomeric carbohydrates. J. Am. Soc. Mass Spectrom. 2014;25:471. doi: 10.1007/s13361-013-0780-0. [DOI] [PubMed] [Google Scholar]
- 12.Huang Y, Dodds ED. Discrimination of isomeric carbohydrates as the electron transfer products of group II cation adducts by ion mobility spectrometry and tandem mass spectrometry. Anal. Chem. 2015;87:5664. doi: 10.1021/acs.analchem.5b00759. [DOI] [PubMed] [Google Scholar]
- 13.Ewing MA, Glover MS, Clemmer DE. Hybrid ion mobility and mass spectrometry as a separation tool. Journal of Chromatography A (2016) 2016;1439:3. doi: 10.1016/j.chroma.2015.10.080. [DOI] [PubMed] [Google Scholar]
- 14.Hinneburg H, Hofmann J, Struwe WB, Thader A, Altmann F, Silva DV, Seeberger PH, Pagel K, Kolarich D. Distinguishing N -acetylneuraminic acid linkage isomers on glycopeptides by ion mobility-mass spectrometry. Chem. Commun. 2016;52:4381. doi: 10.1039/c6cc01114d. [DOI] [PubMed] [Google Scholar]
- 15.Gray CJ, Thomas B, Upton R, Migas LG, Eyers CE, Barran PE, Flitsch SL. Applications of ionmobilitymass spectrometry for high throughput, high resolution glycan analysis. Biochim. Biophys. Acta. 2016 doi: 10.1016/j.bbagen.2016.02.003. In Press. [DOI] [PubMed] [Google Scholar]
- 16.Fenn LS, McLean JA. Simultaneous glycoproteomics on the basis of structure using ion mobility-mass spectrometry. Mol. Biosyst. 2009;5:1298. doi: 10.1039/b909745g. [DOI] [PubMed] [Google Scholar]
- 17.Fenn LS, McLean JA. Structural separations by ion mobility-MS for glycomics and glycoproteomics. Methods Molec. Biol. 2013;951:171. doi: 10.1007/978-1-62703-146-2_12. [DOI] [PMC free article] [PubMed] [Google Scholar]
- 18.Williams JP, Grabenauer M, Carpenter CJ, Holland RJ, Wormald MR, Giles K, Harvey DJ, Bateman RH, Scrivens JH, Bowers MT. Characterization of simple isomeric oligosaccharides and the rapid separation of glycan mixtures by ion mobility mass spectrometry. Int. J. Mass Spectrom. 2010;298:119. [Google Scholar]
- 19.Plasencia MD, Isailovic D, Merenbloom SI, Mechref Y, Clemmer DE. Resolving and assigning N-linked glycan structural isomers from ovalbumin by IMS-MS. J. Am. Soc. Mass Spectrom. 2008;19:1706. doi: 10.1016/j.jasms.2008.07.020. [DOI] [PMC free article] [PubMed] [Google Scholar]
- 20.Jiao J, Zhang H, Reinhold VN. High performance IT-MSn sequencing of glycans (spatial resolution of ovalbumin isomers) Int. J. Mass Spectrom. 2011;303:109. doi: 10.1016/j.ijms.2011.01.016. [DOI] [PMC free article] [PubMed] [Google Scholar]
- 21.Isailovic D, Kurulugama RT, Plasencia MD, Stokes ST, Kyselova Z, Goldman R, Mechref Y, Novotny MV, Clemmer DE. Profiling of human serum glycans associated with liver cancer and cirrhosis by IMS-MS. J. Proteome Res. 2008;7:1109. doi: 10.1021/pr700702r. [DOI] [PMC free article] [PubMed] [Google Scholar]
- 22.Harvey DJ, Scrivens JH, Holland R, Williams JP, Wormald MR. Ion-mobility separation coupled with negative ion fragmentation of N-linked carbohydrates; Paper presented at the 56th ASMS Conference on Mass Spectrometry, Denver; 2008. Proceedings CD MOG 09.10. [Google Scholar]
- 23.Hermannová M, Iordache AM, Slováková K, Havlíček V, Pelantová H, Lemr K. Arrival time distributions of product ions reveal isomeric ratio of deprotonated molecules in ion mobility–mass spectrometry of hyaluronan-derived oligosaccharides. J. Mass Spectrom. 2015;50:854. doi: 10.1002/jms.3596. [DOI] [PubMed] [Google Scholar]
- 24.Harvey DJ, Abrahams JL. Fragmentation and ion mobility properties of negative ions from N-linked carbohydrates: Part 7: Reduced glycans. Rapid Commun. Mass Spectrom. 2016;30:627. doi: 10.1002/rcm.7467. [DOI] [PubMed] [Google Scholar]
- 25.Harvey DJ, Sobott F, Crispin M, Wrobel A, Bonomelli C, Vasiljevic S, Scanlan CN, Scarff C, Thalassinos K, Scrivens JH. Ion mobility mass spectrometry for extracting spectra of N-glycans directly from incubation mixtures following glycan release: Application to glycans from engineered glycoforms of intact, folded HIV gp120. J. Am. Soc. Mass Spectrom. 2011;22:568. doi: 10.1007/s13361-010-0053-0. [DOI] [PubMed] [Google Scholar]
- 26.Harvey DJ, Crispin M, Bonomelli C, Scrivens JH. Ion mobility mass spectrometry for ion recovery and clean-up of MS and MS/MS spectra obtained from low abundance viral samples. J. Am. Soc. Mass Spectrom. 2015;26:1754. doi: 10.1007/s13361-015-1163-5. [DOI] [PMC free article] [PubMed] [Google Scholar]
- 27.Fenn LS, McLean JA. Biomolecular structural separations by ion mobility–mass spectrometry. Anal. Bioanal. Chem. 2008;391:905. doi: 10.1007/s00216-008-1951-x. [DOI] [PubMed] [Google Scholar]
- 28.Fenn LS, McLean JA. Enhanced carbohydrate structural selectivity in ion mobility-mass spectrometry analyses by boronic acid derivatization. Chem. Commun. 2008:5505. doi: 10.1039/b810421b. [DOI] [PubMed] [Google Scholar]
- 29.Fenn LS, Kliman M, Mahsut A, Zhao SR, McLean JA. Characterizing ion mobility-mass spectrometry conformation space for the analysis of complex biological samples. Anal. Bioanal. Chem. 2009;394:235. doi: 10.1007/s00216-009-2666-3. [DOI] [PMC free article] [PubMed] [Google Scholar]
- 30.Li H, Bendiak B, Siems WF, Gang DR, Hill HH., Jr Ion mobility-mass correlation trend line separation of glycoprotein digests without deglycosylation. Int. J. Ion Mobil. Spectrom. 2013;16:105. doi: 10.1007/s12127-013-0127-3. [DOI] [PMC free article] [PubMed] [Google Scholar]
- 31.Harvey DJ, Scarff CA, Edgeworth M, Crispin M, Scanlan CN, Sobott F, Allman S, Baruah K, Pritchard L, Scrivens JH. Travelling wave ion mobility and negative ion fragmentation for the structural determination of N-linked glycans. Electrophoresis. 2013;34:2368. doi: 10.1002/elps.201200669. [DOI] [PubMed] [Google Scholar]
- 32.Patel T, Bruce J, Merry A, Bigge C, Wormald M, Jaques A, Parekh R. Use of hydrazine to release in intact and unreduced form both N- and O-linked oligosaccharides from glycoproteins. Biochemistry. 1993;32:679. doi: 10.1021/bi00053a037. [DOI] [PubMed] [Google Scholar]
- 33.Wing DR, Field MC, Schmitz B, Thor G, Dwek RA, Schachner MS, Rademacher TW. The use of large-scale hydrazinolysis in the preparation of N-linked oligosaccharide libraries: application to brain tissue. Glycoconj. J. 1992;9:293. doi: 10.1007/BF00731089. [DOI] [PubMed] [Google Scholar]
- 34.de Waard P, Koorevaar A, Kamerling JP, Vliegenthart JFG. Structure determination by 1H NMR spectroscopy of (sulfated) sialylated N-linked carbohydrate chains released from porcine thyroglobulin by peptide-N 4-(N-acetyl-b-glucosaminyl)asparagine amidase-F. J. Biol. Chem. 1991;266:4237. [PubMed] [Google Scholar]
- 35.Kamerling JP, Rijkse I, Maas AAM, van Kuik JA, Vliegenthart JFG. Sulfated N-linked carbohydrate chains in porcine thyroglobulin. FEBS Letts. 1988;241:246. doi: 10.1016/0014-5793(88)81070-6. [DOI] [PubMed] [Google Scholar]
- 36.Da Silva MLC, Stubbs HJ, Tamura T, Rice KG. 1H-NMR characterization of a hen ovalbumin tyrosinamide N-linked oligosaccharide library. Arch. Biochem. Biophys. 1995;318:465. doi: 10.1006/abbi.1995.1255. [DOI] [PubMed] [Google Scholar]
- 37.Harvey DJ, Wing DR, Küster B, Wilson IBH. Composition of N-linked carbohydrates from ovalbumin and co-purified glycoproteins. J. Am. Soc. Mass Spectrom. 2000;11:564. doi: 10.1016/S1044-0305(00)00122-7. [DOI] [PubMed] [Google Scholar]
- 38.Yang Y, Barendregt A, Kamerling JP, Heck AJR. Analyzing protein micro-heterogeneity in chicken ovalbumin by high-resolution native mass spectrometry exposes qualitatively and semi-quantitatively 59 proteoforms. Anal. Chem. 2013;85:12037. doi: 10.1021/ac403057y. [DOI] [PMC free article] [PubMed] [Google Scholar]
- 39.Green ED, Adelt G, Baenziger JU, Wilson S, van Halbeek H. The asparagine-linked oligosaccharides on bovine fetuin. Structural analysis of N-glycanase-released oligosaccharides by 500-Megahertz 1H-NMR spectroscopy. J. Biol. Chem. 1988;263:18253. [PubMed] [Google Scholar]
- 40.Fournet B, Montreuil J, Strecker G, Dorland L, Haverkamp J, Vliegenthart JFG, Binette JP, Schmid K. Determination of the primary structures of 16 asialo-carbohydrate units derived from human plasma a1-acid glycoprotein by 360 MHz 1H NMR spectroscopy and permethylation analysis. Biochemistry. 1978;17:5206. doi: 10.1021/bi00617a021. [DOI] [PubMed] [Google Scholar]
- 41.Küster B, Hunter AP, Wheeler SF, Dwek RA, Harvey DJ. Structural determination of N-linked carbohydrates by matrix-assisted laser desorption/ionization mass spectrometry following enzymatic release within sodium dodecyl sulfate-polyacrylamide electrophoresis gels: application to species-specific glycosylation of a1-acid glycoprotein. Electrophoresis. 1998;19:1950. doi: 10.1002/elps.1150191113. [DOI] [PubMed] [Google Scholar]
- 42.Gillece-Castro BL, Prakobphol A, Burlingame AL, Leffler H, Fisher SJ. Structure and bacterial receptor activity of a human salivary proline-rich glycoprotein. J. Biol. Chem. 1991;266:17358. [PubMed] [Google Scholar]
- 43.Guile GR, Harvey DJ, O'Donnell N, Powell AK, Hunter AP, Zamze S, Fernandes DL, Dwek RA, Wing DR. Identification of highly fucosylated N-linked oligosaccharides from the human parotid gland. Eur. J. Biochem. 1998;258:623. doi: 10.1046/j.1432-1327.1998.2580623.x. [DOI] [PubMed] [Google Scholar]
- 44.Yamashita K, Tachibana Y, Nakayama T, Kitamura M, Endo Y, Kobata A. Structural studies of the sugar chains of human parotid alpha-amylase. J. Biol. Chem. 1980;255:5635. [PubMed] [Google Scholar]
- 45.Küster B, Wheeler SF, Hunter AP, Dwek RA, Harvey DJ. Sequencing of N-linked oligosaccharides directly from protein gels: In-gel deglycosylation followed by matrix-assisted laser desorption/ionization mass spectrometry and normal-phase high performance liquid chromatography. Anal. Biochem. 1997;250:82. doi: 10.1006/abio.1997.2199. [DOI] [PubMed] [Google Scholar]
- 46.Börnsen KO, Mohr MD, Widmer HM. Ion exchange and purification of carbohydrates on a Nafion(R) membrane as a new sample pretreatment for matrix-assisted laser desorption-ionization mass spectrometry. Rapid Commun. Mass Spectrom. 1995;9:1031. [Google Scholar]
- 47.Giles K, Pringle SD, Worthington KR, Little D, Wildgoose JL, Bateman RH. Applications of a travelling wave-based radio-frequency-only stacked ring ion guide. Rapid Commun. Mass Spectrom. 2004;18:2401. doi: 10.1002/rcm.1641. [DOI] [PubMed] [Google Scholar]
- 48.Domon B, Costello CE. A systematic nomenclature for carbohydrate fragmentations in FAB-MS/MS spectra of glycoconjugates. Glycoconj. J. 1988;5:397. [Google Scholar]
- 49.Pringle SD, Giles K, Wildgoose JL, Williams JP, Slade SE, Thalassinos K, Bateman RH, Bowers MT, Scrivens JH. An investigation of the mobility separation of some peptide and protein ions using a new hybrid quadrupole/travelling wave IMS/oa-ToF instrument. Int. J. Mass Spectrom. 2007;261:1. [Google Scholar]
- 50.Bush MF, Hall Z, Giles K, Hoyes J, Robinson CV, Ruotolo BT. Collision cross sections of proteins and their complexes: A calibration framework and database for gas-phase structural biology. Anal. Chem. 2010;82:9557. doi: 10.1021/ac1022953. [DOI] [PubMed] [Google Scholar]
- 51.Pagel K, Natan E, Hall Z, Fersht AR, Robinson CV. Intrinsically disordered p53 and its complexes populate compact conformations in the gas phase. Angew. Chem. Int. Ed. 2013;52:361. doi: 10.1002/anie.201203047. [DOI] [PubMed] [Google Scholar]
- 52.Pagel K, Harvey DJ. Ion mobility mass spectrometry of complex carbohydrates - collision cross sections of sodiated N-linked glycans. Anal. Chem. 2013;85:5138. doi: 10.1021/ac400403d. [DOI] [PubMed] [Google Scholar]
- 53.Hofmann J, Struwe WB, Scarff CA, Scrivens JH, Harvey DJ, Pagel K. Estimating collision cross sections of negatively charged N-glycans using travelling wave ion mobility-mass spectrometry. Anal. Chem. 2014;86:10789. doi: 10.1021/ac5028353. [DOI] [PubMed] [Google Scholar]
- 54.Thalassinos K, Grabenauer M, Slade SE, Hilton GR, Bowers MT, Scrivens JH. Characterization of phosphorylated peptides using traveling wave-based and drift cell ion mobility mass spectrometry. Anal. Chem. 2009;81:248. doi: 10.1021/ac801916h. [DOI] [PubMed] [Google Scholar]
- 55.May JC, Goodwin CR, Lareau NM, Leaptrot KL, Morris CB, Kurulugama RT, Mordehai A, Klein C, Barry W, Darland E, Overney G, Imatani K, Stafford GC, Fjeldsted JC, McLean JA. Conformational ordering of biomolecules in the gas phase: Nitrogen collision cross sections measured on a prototype high resolution drift tube ion mobility-mass spectrometer. Anal. Chem. 2014;86:2107. doi: 10.1021/ac4038448. [DOI] [PMC free article] [PubMed] [Google Scholar]
- 56.Li H, Bendiak B, Siems WF, Gang DR, Hill J, Herbert H. Ion mobility mass spectrometry analysis of isomeric disaccharide precursor, product and cluster ions. Rapid Commun. Mass Spectrom. 2013;27:2699. doi: 10.1002/rcm.6720. [DOI] [PMC free article] [PubMed] [Google Scholar]
- 57.Gaye MM, Kurulugama R, Clemmer DE. Investigating carbohydrate isomers by IMS-CID-IMS-MS: Precursor and fragment ion cross-sections. Analyst. 2015;140:6922. doi: 10.1039/c5an00840a. [DOI] [PubMed] [Google Scholar]
- 58.Harvey DJ, Scarff CA, Crispin M, Scanlan CN, Bonomelli C, Scrivens JH. MALDI-MS/MS with traveling wave ion mobility for the structural analysis of N-linked glycans. J. Am. Soc. Mass Spectrom. 2012;23:1955. doi: 10.1007/s13361-012-0425-8. [DOI] [PubMed] [Google Scholar]
- 59.Saba J, Zumwalt A, Meitei NS, Apte A, Viner R. Automated glycan structural isomer differentiation using a bioinformatics tool; Proceedings of the 59th ASMS Conference on Mass Spectrometry and Allied Topics, Denver; 2011. TP08 170. [Google Scholar]
- 60.Harvey DJ, Edgeworth M, Krishna BA, Bonomelli C, Allman S, Crispin M, Scrivens JH. Fragmentation of negative ions from N-linked carbohydrates: Part 6: Glycans containing one N-acetylglucosamine in the core. Rapid Commun. Mass Spectrom. 2014;28:2008. doi: 10.1002/rcm.6980. [DOI] [PubMed] [Google Scholar]
- 61.Harvey DJ, Crispin M, Scanlan C, Singer BB, Lucka L, Chang VT, Radcliffe CM, Thobhani S, Yuen C-T, Rudd PM. Differentiation between isomeric triantennary N-linked glycans by negative ion tandem mass spectrometry and confirmation of glycans containing galactose attached to the bisecting (b1-4-GlcNAc) residue in N-glycans from IgG. Rapid Commun. Mass Spectrom. 2008;22:1047. doi: 10.1002/rcm.3470. [DOI] [PubMed] [Google Scholar]
- 62.Gabryelski W, Froese KL. Rapid and sensitive differentiation of anomers, linkage, and position isomers of disaccharides using High-Field Asymmetric Waveform Ion Mobility Spectrometry (FAIMS) J. Am. Soc. Mass Spectrom. 2003;14:265. doi: 10.1016/S1044-0305(03)00002-3. [DOI] [PubMed] [Google Scholar]
- 63.Hernandez O, Isenberg S, Steinmetz V, Glish GL, Maitre P. Probing mobility-selected saccharide isomers: Selective ion-molecule reactions and wavelength-specific IR activation. J. Phys. Chem. A. 2015;119:6057. doi: 10.1021/jp511975f. [DOI] [PubMed] [Google Scholar]
- 64.Clowers BH, Dwivedi P, Steiner WE, Hill HHJ, Bendiak B. Separation of sodiated isobaric disaccharides and trisaccharides using electrospray ionization-atmospheric pressure ion mobility-time of flight mass spectrometry. J. Am. Soc. Mass Spectrom. 2005;16:660. doi: 10.1016/j.jasms.2005.01.010. [DOI] [PubMed] [Google Scholar]
- 65.Li H, Giles K, Bendiak B, Kaplan K, Siems WF, Hill HH., Jr Resolving structural isomers of monosaccharide methyl glycosides using drift tube and traveling wave ion mobility mass spectrometry. Anal. Chem. 2012;84:3231. doi: 10.1021/ac203116a. [DOI] [PMC free article] [PubMed] [Google Scholar]
- 66.Both P, Green AP, Gray CJ, Šardzík R, Voglmeir J, Fontana C, Austeri M, Rejzek M, Richardson D, Field RA, Widmalm G, Flitsch SL, Eyers CE. Discrimination of epimeric glycans and glycopeptides using IM-MS and its potential for carbohydrate sequencing. Nat. Chem. 2014;6:65. doi: 10.1038/nchem.1817. [DOI] [PubMed] [Google Scholar]
- 67.Dwivedi P, Bendiak B, Clowers BH, Hill HHJ. Rapid resolution of carbohydrate isomers by electrospray ionization ambient pressure ion mobility spectrometry-time-of-flight mass spectrometry (ESI-APIMS-TOFMS) J. Am. Soc. Mass Spectrom. 2007;18:1163. doi: 10.1016/j.jasms.2007.04.007. [DOI] [PubMed] [Google Scholar]
- 68.Harvey DJ, Merry AH, Royle L, Campbell MP, Dwek RA, Rudd PM. Proposal for a standard system for drawing structural diagrams of N- and O-linked carbohydrates and related compounds. Proteomics. 2009;9:3796. doi: 10.1002/pmic.200900096. [DOI] [PubMed] [Google Scholar]


