Abstract
Our understanding of mechanisms by which the expression of IFN-γ is regulated is limited. Herein, we identify two evolutionarily conserved noncoding sequence elements (IFNgCNS1 and IFNg CNS2) located ≈5 kb upstream and ≈18 kb downstream of the initiation codon of the murine Ifng gene. When linked to the murine Ifng gene (–3.4 to +5.6 kb) and transiently transfected into EL-4 cells, these elements clearly enhanced IFN-γ expression in response to ionomycin and phorbol 12-myristate 13-acetate and weakly enhanced expression in response to T-bet. A DNase I hypersensitive site and extragenic transcripts at IFNgCNS2 correlated positively with the capacity of primary T cell subsets to produce IFN-γ. Transcriptionally favorable histone modifications in the Ifng promoter, intronic regions, IFNgCNS2, and, although less pronounced, IFNgCNS1 increased as naïve T cells differentiated into IFN-γ-producing effector CD8+ and T helper (TH) 1 T cells, but not into TH2 T cells. Like IFN-γ expression, these histone modifications were T-bet-dependent in CD4+ cells, but not CD8+ T cells. These findings define two distal regulatory elements associated with T cell subset-specific IFN-γ expression.
IFN-γ is a key cytokine, produced primarily by natural killer cells and T lymphocytes, which facilitates host defense to intracellular pathogens. Naïve T cells produce little IFN-γ. After activation, naïve CD8+ T cells proliferate and are intrinsically programmed to differentiate into effector cells that are cytotoxic and secrete IFN-γ. By contrast, CD4+ T cells differentiate into two functionally distinct subsets depending on the environmental context: T helper 1 (TH1) cells that efficiently produce IFN-γ or TH2 cells that produce IL-4, IL-5, and IL-13.
T cell subset-specific expression of TH1 and TH2 cytokines is primarily regulated at the level of transcription by the collaborative effort of a number of transcription factors. T-bet is the “master regulator” that directs naive CD4+ T cells toward the TH1 phenotype, whereas GATA-3 enforces the TH2 phenotype (1). On the molecular level, T-bet and GATA-3 activate cytokine production in part by maintaining histone hyperacetylation (2, 3), thus keeping the respective cytokine loci accessible to the transcriptional machinery. Although T-bet is essential for the expression of IFN-γ and the TH1 cell fate in CD4+ T cells (4), effector CD8+ T cells also express a T-bet paralog, eomesodermin, which directs the expression of IFN-γ, perforin, and granzyme B (5).
Regulation of transcription in eukaryotes is a complex process that involves the cooperation of the promoter with more distal regulatory elements, which may include enhancers, insulators, silencers, and locus control regions. These distal regulatory regions are commonly located within ≈50 kb upstream or downstream of the gene. These regions may be identified through DNase I hypersensitive (DH) site mapping (6). More recently, bioinformatics has been applied to facilitate the identification of regulatory elements by searching for noncoding regions that are evolutionarily conserved (7). Loots et al. (8) used this approach to identify regulatory regions conserved between mouse and human in the Il4/Il13 locus. One of these, referred to as conserved noncoding sequence 1 (CNS-1), is a potent IL-4 enhancer (8) and overlaps two TH2-specific DH sites (9). Deletion of CNS-1 (8, 10) resulted in significant decreases in IL-4, IL-5, and IL-13 production, suggesting a global role of this regulatory element in transcriptional regulation of the TH2 cytokine locus.
In contrast to the well studied TH2 cytokine locus, our knowledge about mechanisms controlling expression of the signature TH1 cytokine IFN-γ is limited. DNase I hypersensitivity mapping in differentiated TH1 T cells revealed three prominent sites within the Ifng gene (11). Our group showed that the immediate 108 bp of 5′ flanking sequence of the human IFN-γ promoter contains two regulatory elements that are necessary and sufficient for activation-induced promoter function in transiently transfected Jurkat and primary human T cells (12, 13). Although luciferase reporter transgenes driven by these two regulatory elements were preferentially active in TH1 vs. TH2 T cells (14), these elements were insufficient to direct robust T cell subset- and activation-specific expression in vivo, as were transgene constructs containing up to 3.4 kb of 5′ flank (15). Recently, a human IFN-γ transgene with ≈90 kb of 5′ and 3′ flanking sequences achieved both high level and TH1-selective expression of human IFN-γ in murine T cells (16). These findings strongly suggest that distal regulatory elements contribute to IFN-γ expression in vivo. Herein, we report the identification of two distal regions in the Ifng locus that enhance the expression of murine IFN-γ and are associated with T cell subset-specific histone modifications and extragenic transcription.
Methods
Mice. C57BL/6 mice were used for all experiments, with the exception of studies with T-bet–/– mice and controls, which were on a BALB/c background [a gift from L. Glimcher (Harvard University, Boston)] (4). Mice were housed in specific pathogen-free conditions.
Plasmids. The bicistronic T-bet-GFP (T-bet/MigRI) retrovirus was a gift from S. Reiner (University of Pennsylvania, Philadelphia) (17). The 9-kb murine Ifng clone extended from –3.4 kb to +5.6 kb relative to the translation start site (18). DNA for the upstream (IFNgCNS1) and downstream (IFNgCNS2) murine Ifng-conserved noncoding sequences was generated by using the Expand High Fidelity PCR System (Roche Diagnostics) and a bacterial artificial chromosome clone provided by R. Locksley (University of California, San Francisco) (19) as template. These sequences were inserted upstream and/or downstream, respectively, of the 9-kb Ifng genomic clone in pBluescriptII (see Supporting Text, which is published as supporting information on the PNAS web site). Similar constructs in which three T-box binding sites (at –66, –104, and –263) were mutated thereby abolishing T-bet responsiveness of the promoter (20) were created by replacing the wild-type KpnI–SnaB1 promoter fragment with the same fragment from plasmid IFN-g A-3447 (provided by K. Murphy, Washington University, St. Louis). All constructs were verified by sequencing. T-bet-pcDNA3 was created by subcloning a 1.6-kb EcoRI fragment bearing murine T-bet cDNA from the T-bet/MigRI vector into the EcoRI site of pcDNA3 (Invitrogen). The β-actin promoter Renilla luciferase reporter has been described (13).
Transient Transfection. EL-4 cells were transfected as described (1) with 10 μg of IFN-γ reporter, 5.83 μg of T-bet-pcDNA3 or pcDNA3, and 5 μg of β-actin promoter Renilla luciferase plasmids. Cells were allowed to recover for 1–3 h at 37°C and then were either not stimulated or stimulated with 1.5 μM ionomycin, 25 ng/ml phorbol 12-myristate 13-acetate (PMA), both, or both in the presence of cyclosporin A 500 ng/ml. After 24 h, supernatants were assayed for murine IFN-γ by using a DuoSet ELISA (R & D Systems), and cell lysates were assayed for Renilla luciferase (Promega).
Purification and Activation of T Cells. Naïve T cells were enriched from spleen and lymph nodes by negative selection of B220+I-Ab+CD44+ cells with streptavidin-conjugated magnetic beads (Dynal) followed by positive selection of CD4+ or CD8+ cells by using an AutoMacs (Miltenyi Biotec). T cells were stimulated as described (21) on plates coated with anti-CD3 and anti-CD28 under TH1- or TH2-polarizing conditions for CD4+ T cells and in medium containing IL-2 only (10 ng/ml, Chiron) for CD8+ T cells.
Retroviral Transduction. Phoenix-Eco packaging cells were transfected as described (22). Purified naïve CD4+ cells were polarized under TH1 or TH2 conditions for 4 days, resuspended at 2 × 10⁶ cells per ml in fresh medium containing 12 μg/ml polybrene and 1:4 volume of 2× concentrate of viral supernatant, centrifuged at 1,500 × g for 90 min at 25°C, and incubated for 24 h at 37°C before being supplied with fresh medium. After 72 h, cells were stained with anti-CD4-allophycocyanin. CD4+/GFP+ cells were purified by flow cytometric cell sorting as described (21). Cells were left to recover under nonpolarizing conditions (10 ng/ml IL-2) for 3 days.
DNase I Hypersensitivity Analysis. Naïve CD4+ cells were activated with plate-bound anti-CD3 and anti-CD28 in the presence of antigen-presenting cells and cultured under TH1 or TH2 conditions for 7 days, then restimulated and cultured for 7 more days. Nuclei were purified and digested with DNase I (Invitrogen) as described (23). DNA was digested overnight with either HpaI or SspI to detect hypersensitive sites in IFNgCNS1 or BamHI to detect sites in IFNgCNS2.
Chromatin Immunoprecipitation (ChIP). ChIP with anti-dimethylhistone H3 lysine 4 (H3-K4), anti-acetyl histone H3 and H4 (Upstate Biotechnologies), or polyclonal anti-T-bet (a gift from L. Glimcher or from Santa Cruz Biotechnology) was done as described (21). The amount of immunoprecipitated DNA was quantified by real-time PCR on a DNA Engine Opticon (MJ Research) with Brilliant SYBR Green QPCR kit (Stratagene) as described (ref. 21; for primer sequences, see Table 1, which is published as supporting information on the PNAS web site).
Analysis of Gene Expression. Total RNA was purified with a RNAqueous-4PCR kit (Ambion), treated with DNase I and converted to cDNA by using a Retroscript kit and random hexamers (Ambion). Gene expression was measured by real-time quantitative RT-PCR (21).
Isolation of Extragenic Transcripts. Naïve CD4+ cells were cultured under TH1 or TH2 conditions for 3 days without antigen-presenting cells. Nascent transcripts from 10–30 × 106 cells were isolated and reverse transcribed by using random hexamers and SuperscriptII (Invitrogen) (24). cDNA was quantified by real-time PCR by comparison to a standard curve generated with dilutions of genomic DNA and corrected for input by amplifying β-actin transcripts.
Results
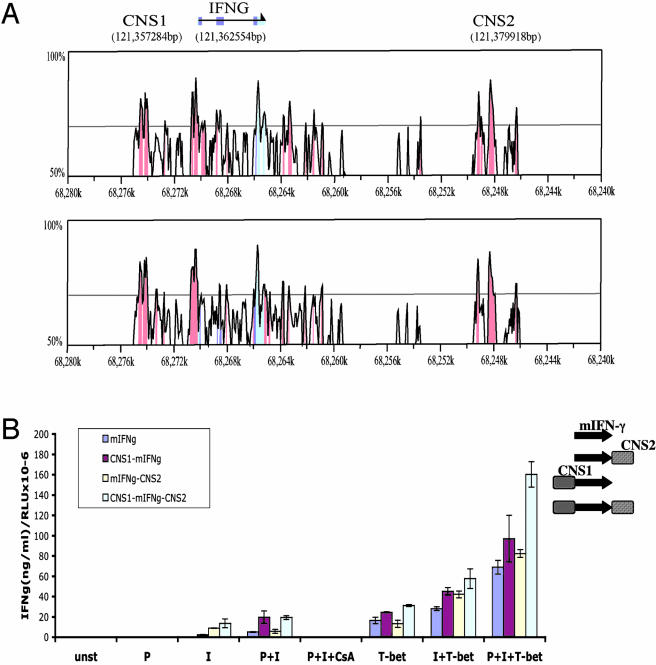
Identification of IFNgCNS1 and -2. As an initial approach to identify regulatory elements that may help to control IFN-γ expression, we searched genome databases for conserved noncoding regions near the Ifng gene (25). In addition to the promoter and portions of the coding region, two stretches of highly homologous (>75%) sequences between human, mouse, and rat were evident (Fig. 1A). The proximal boundary of one (IFNgCNS1) is 5.27 kb upstream, and the other (IFNgCNS2) is 17.36 kb downstream of the murine Ifng translation start site. Neither overlapped with any known ORFs, suggesting that they may contain regulatory sequences. Both regions contained sets of short (8–12 bp) evolutionary conserved sequences (26), including potential T-box and nuclear factor of activated T cell (NFAT) transcription factor binding sites (Fig. 7, which is published as supporting information on the PNAS web site, and data not shown).
Fig. 1.
Conserved noncoding regions with enhancer activity in the Ifng locus. (A) Peaks of similarity in pairwise sequence alignments of the Ifng locus between human and mouse (Upper) or human and rat (Lower) shown as VISTA plots. Conserved sequences are shown relative to their position in the human genome on the horizontal axes below each panel. The percentage sequence identity is indicated on the vertical axes. Conserved noncoding sequences (CNS) are shown in red, coding exons are shown in blue, and 5′ and 3′ UTRs are shown in turquoise. The position in the mouse genome of the first base of IFNgCNS1, the translation start site, and IFNgCNS2 are shown at the top, where the horizontal arrow indicates the direction of transcription. (B) IFNgCNS1 and -2 exhibit enhancer activity. EL-4 cells were transiently transfected with a 9-kb murine Ifng gene alone (mIFNg) or with IFNgCNS1, IFNgCNS2, or both (see Right) and a β-actin luciferase control plasmid, and either not stimulated (unst) or stimulated with PMA (P), ionomycin (I), or PMA plus ionomycin (P+I), without or with cyclosporin A (CsA). Cells were also cotransfected with a T-bet expression vector or pcDNA. IFN-γ was assessed by ELISA and normalized to luciferase activity [relative light units (RLU)]. The graph is representative of two to five independent experiments with each sample analyzed in duplicate.
IFNgCNS1 and -2 Exhibit Enhancer Activity. To test the possibility that these regions possessed transcriptional regulatory activity, we cloned IFNgCNS1 upstream and/or IFNgCNS2 downstream of the 9-kb murine Ifng gene, then transfected these plasmids into EL-4 cells. EL-4 cells expressed near background levels of endogenous murine IFN-γ in response to activation or T-bet transfection (data not shown), allowing Ifng transgene-encoded cytokine expression to be determined by IFN-γ ELISA normalized to β-actin promoter-driven Renilla luciferase activity. None of the constructs responded to PMA alone (Fig. 1B). IFNgCNS2 and IFNgCNS1 independently and additively enhanced IFN-γ expression in response to ionomycin alone, and this expression was undetectable in their absence. IFNgCNS1 also clearly enhanced expression in response to PMA plus ionomycin, but the effect of IFNgCNS2 was no longer apparent. Expression from all constructs in response to ionomycin or PMA plus ionomycin was abolished by the calcineurin inhibitor, cyclosporin A, indicating the involvement of nuclear factor of activated T cells (NFAT) in these responses. T-bet alone induced substantial expression in cells transfected with the 9-kb Ifng gene. IFNgCNS1 enhanced the response to T-bet, and IFNgCNS2 augmented this effect, but the fold increase compared to the 9-kb Ifng gene alone was small (≈2-fold) and consistently less than that observed in response to ionomycin or PMA plus ionomycin. Similarly, when T-bet, PMA and ionomycin were used in combination, expression increased in a greater than additive manner, but as for T-bet alone, IFNgCNS1 plus IFNgCNS2 augmented the response only ≈2-fold. Consistent with their modest effect on responses to T-bet, IFNgCNS1 and -2 did not restore T-bet responsiveness to a 9-kb Ifng gene in which three proximal promoter T-box sites were mutated (Fig. 8, which is published as supporting information on the PNAS web site), indicating that the response to T-bet in this assay requires and is predominantly caused by interaction with the proximal promoter.
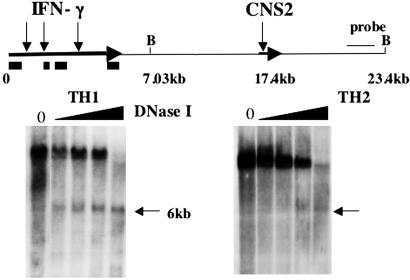
Identification of a DH Site at IFNgCNS2. Enhancer activity often correlates with the establishment of DH sites. To determine whether this was true for IFNgCNS1 or IFNgCNS2, we performed Southern blots to search for DH sites in CD4+ T cells grown under TH1 or TH2 conditions for 2 weeks. As expected, under these conditions, TH1 cells produced substantial amounts of IFN-γ mRNA (data not shown), but TH2 cells did not. A prominent DNase I concentration-dependent DH site was detected as a 6-kb band in BamHI cut DNA and coincides with the 5′ end of the IFNgCNS2 region (Fig. 2). This DH site was strong in TH1 cells but not in TH2 cells, in which a faint band of similar size was detectable only at the highest DNA loads and DNase I concentrations. The IFNgCNS2 DH site was also evident in DNA from cells cultured for only 1 week under TH1 conditions (data not shown). We were unable to detect a DH site in the IFNgCNS1 region in primary TH1, TH2, or CD8 T cells with or without restimulation with ionomycin and PMA.
Fig. 2.
IFNgCNS2 harbors a DH site. CD4+ T cells were grown under TH1 or TH2 conditions for 2 weeks. Positions of previously described DH sites in the Ifng gene (11), with black boxes depicting exons, and the site identified in this study at the 5′ end of IFNgCNS2 are shown by downward arrows. B, BamHI sites.
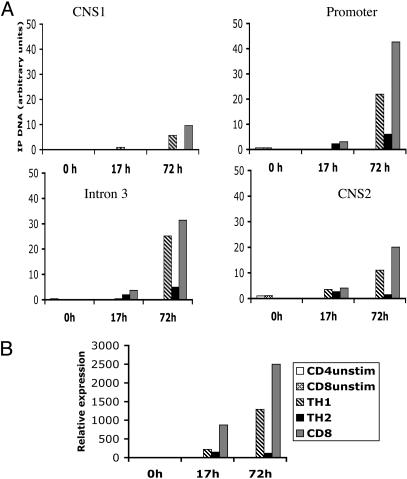
Posttranslational Histone Modifications in the Ifng Locus. DH sites do not invariably coincide with regulatory elements, but such elements may nonetheless be detected by specific histone modifications: acetylated histones H3 and H4 and dimethylated H3 on lysine 4 (H3-K4) (27). To further explore chromatin organization, we used ChIP to search for these transcriptionally favorable histone modifications. Previously, it was shown that stimulation of naïve T cells leads to nonselective histone hyperacetylation at the Ifng promoter during the first 17 h, which increases progressively over time in TH1 conditions but declines in TH2 conditions (2). To test whether IFNgCNS1 or IFNgCNS2 respond similarly, naïve CD4+ T cells were activated under TH1 or TH2 conditions, and naïve CD8+ T cells were activated under nonpolarizing conditions. There was little or no acetylated H3 (Fig. 3A) or dimethylated H3-K4 (data not shown) at the promoter, intron 3, IFNgCNS1, or IFNgCNS2 at 0 h. At 17 h, we detected slight increases in H3 acetylation, which was not TH1 specific and was least evident at IFNgCNS1. By 72 h, acetylated H3 increased substantially and selectively in CD4+ TH1 and CD8+ T cells (Fig. 3A). These transcriptionally favorable histone modifications paralleled IFN-γ mRNA expression (Fig. 3B).
Fig. 3.
T cell polarization affects histone acetylation in IFNgCNS1 and -2. (A) Naïve T cells were cultured in vitro under TH1 or TH2 conditions (for CD4+ cells) or in the presence of IL-2 only (for CD8+ cells), then harvested at different time points (0, 17, and 72 h). Chromatin was precipitated with anti-acetyl histone H3 antibody, and the amounts of precipitated DNA were determined by real-time quantitative PCR. Samples collected at 0 h are naïve unstimulated CD4+ (CD4 unstim) or CD8+ T (CD8 unstim) cells. (B) IFN-γ mRNA expression in the same cell samples as determined by real-time quantitative RT-PCR. One of two independent experiments with similar results is shown. IP, immunoprecipitated.
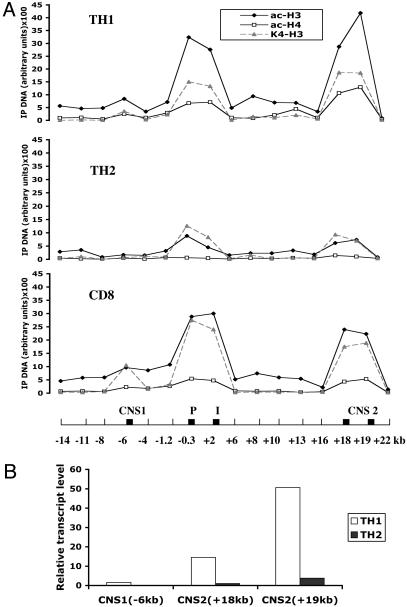
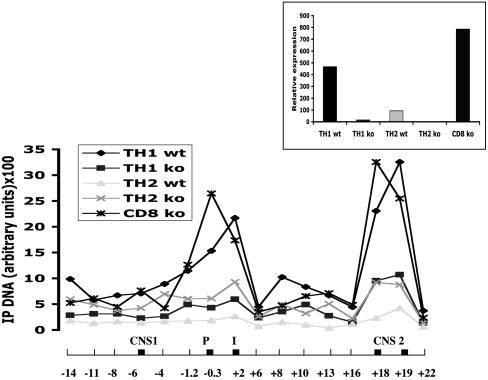
The overall pattern of histone modifications in IFN-γ producing T cell subsets was similar. After 3 days in culture, CD8+ and CD4+ T cells cultured in TH1 conditions exhibited two major peaks of histone H3 and H4 acetylation at the promoter–third intron and IFNgCNS2, and a minor peak at IFNgCNS1, which were much less evident in CD4+ T cells cultured in TH2 conditions (Fig. 4A). In some experiments, histone acetylation was comparable at IFNgCNS2, the promoter, and third intron at 3 days (Figs. 4A and 6), whereas in others, acetylation was stronger at the promoter and third intron than at IFNgCNS2 (Fig. 3A, 72 h). The patterns of histone H3 and H4 acetylation and H3-K4 dimethylation correlated closely. Contrary to the Ifng locus, a substantial increase in acetylated H3 and H4 and dimethylated H3-K4 was detected at the IL-4 promoter in TH2 but not TH1 cells (data not shown).
Fig. 4.
Histone modifications parallel extragenic transcription in the Ifng locus. Naïve T cells were polarized in vitro as described in Fig. 3. (A) Chromatin was immunoprecipitated (IP) by using anti-acetyl-histone H3 (ac-H3), antiacetyl-histone H4 (ac-H4), or anti-dimethyl-histone H3 lysine 4 (K4-H3) antibody. Each region was analyzed with two different primer sets. The horizontal axis shows the Ifng locus with positions numbered relative to the start site, and black boxes representing IFNgCNS1, the promoter (P), third intron (I), and IFNgCNS2. One of two independent experiments with similar results is shown. (B) Chromatin-bound extragenic transcripts in the IFNgCNS1 and -2 regions from CD4+ T cells cultured for 3 days in TH1 or TH2 conditions were quantified by real-time RT-PCR and normalized to β-actin transcripts. One of three independent experiments with similar results is shown.
Fig. 6.
Transcriptionally favorable histone modifications in the Ifng gene, IFNgCNS1 and -2, are T-bet-dependent in TH1 cells, but not in CD8+ T cells. T cells from T-bet–/– or control BALB/c mice were cultured for 3 days as in Fig. 3, then ChIP was performed with anti-acetyl histone H3 antibody. (Inset) IFN-γ mRNA expression is shown. One of two experiments with similar results is shown. IP, immunoprecipitated.
Extragenic Transcripts at the Ifng Locus Are Induced by TH1 Polarization. Low-level intergenic/extragenic transcription has been associated with locus control regions and enhancers in the β-globin (28), MHC class II (23), and Il4/Il13 loci (29), and may be required for chromatin remodeling in specific chromosomal domains (30). To determine whether such transcripts could be detected at the Ifng locus, we tested for the presence of extragenic chromatin-attached transcripts in CD4+ T cells cultured under TH1 or TH2 conditions for 3 days. TH1-specific chromatin-attached transcripts were clearly and reproducibly observed at IFNgCNS2 (Fig. 4B and Fig. 9, which is published as supporting information on the PNAS web site). Nascent transcripts were also detected at IFNgCNS1, but at substantially lower levels. We refer to these transcripts as extragenic because they do not represent any genes, ORFs, or expressed sequence tags present in the sequence data libraries. Extragenic transcription correlated with transcriptionally favorable histone modifications and the presence of a DH site at IFNgCNS2.
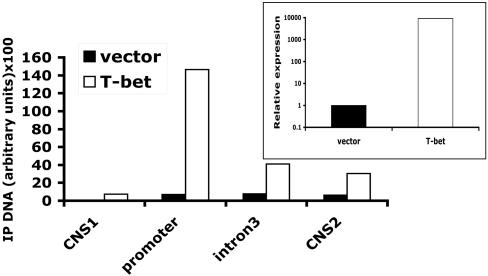
T-Bet Binds to and Affects Histone Modifications in the Ifng Locus. It has been proposed that T-bet acts both as a transcriptional activator and as an initiator of chromatin remodeling to assure mitotic inheritance of remodeled chromatin for the Ifng gene in developing TH1 cells (17). To examine whether T-bet-induced chromatin modifications extend to include IFNgCNS1 and -2, CD4+ T cells were polarized under TH2 conditions for 4 days, and then transduced with a bicistronic T-bet-GFP retrovirus or control GFP retrovirus. Three days later, CD4+GFP+ cells were isolated by flow cytometric cell sorting and cultured under nonpolarizing conditions in the presence of IL-2 only. The amounts of dimethylated H3-K4 increased substantially in cells transduced with T-bet, with the greatest effect observed at the Ifng promoter and progressively smaller effects at intron 3 and IFNgCNS2 followed by IFNgCNS1 (Fig. 5). As expected, IFN-γ mRNA was elevated dramatically in CD4+ cells infected with the T-bet retrovirus (Fig. 5 Inset).
Fig. 5.
T-bet induces transcriptionally favorable histone modifications in IFNgCNS1 and -2. CD4+ TH2 cells were transduced with either a bicistronic T-bet-GFP retrovirus (T-bet) or a control GFP retrovirus (vector). ChIP was performed by using anti-dimethyl-H3-K4 antibody as in Fig. 4. (Inset) IFN-γ mRNA expression was assessed in parallel. One of two experiments with similar results is shown. IP, immunoprecipitated.
These results indicate that T-bet can override TH2 conditions to enhance transcriptionally favorable histone modifications throughout the Ifng locus. To determine whether T-bet was required to induce these histone modifications, we isolated naive CD4+ and CD8+ cells from BALB/c and T-bet–/– BALB/c mice, and cultured CD4+ T cells in TH1 or TH2 conditions and CD8+ T cells in IL-2 only for 3 days. The lack of T-bet resulted in a sharp reduction in IFN-γ mRNA expression and in acetylated H3 (Fig. 6) and dimethylated H3-K4 (data not shown) at the promoter, intron 3, IFNgCNS1, and IFNgCNS2 in TH1 cells, to levels similar to those in wild-type or T-bet–/– TH2 cells (Fig. 6). In contrast to TH1 cells, neither IFN-γ mRNA expression nor histone modifications in the Ifng locus were affected in CD8+ T-bet–/– T cells. As expected, the absence of T-bet did not substantially alter the abundance of acetylated H3 or dimethylated H3-K4 in the Il4 promoter (data not shown).
In addition to the promoter, there are potential T-bet-binding sites within IFNgCNS1 and -2. To determine whether T-bet binds to these sites at the endogenous locus, ChIP was performed by using T-bet antibodies and the same primer sets used for histone analysis. T-bet binding was strongest at the promoter, but also clear and consistent at IFNgCNS1 in primary TH1 cells and in the long-term TH1 cell line, AE7 (Fig. 7); reproducible but weaker binding was detected at IFNgCNS2 in AE7 cells, but binding in primary TH1 cells was inconsistent.
Discussion
This report describes two distal regulatory elements, IFNgCNS1 and -2, which are located upstream and downstream of the Ifng gene, respectively, and are conserved between mouse, rat, and human. When linked to the 9-kb murine Ifng gene, these regions enhanced expression in transiently transfected EL-4 cells. Addition of IFNgCNS2 enabled IFN-γ expression in response to ionomycin alone, and the further addition of IFNgCNS1 led to expression in response to ionomycin that was ≈50% of that seen with PMA plus ionomycin. Thus, these two distal elements enhance expression in response to signals downstream of the T cell receptor, and, in particular, to increased intracellular calcium. In contrast to these effects, IFNgCNS1 and -2 led to a more modest ≈2-fold increase in T-bet-induced expression. Moreover, this effect required intact T-bet binding sites in the proximal promoter, suggesting that the weak enhancement of T-betinduced expression by these elements might result from altered accessibility rather than direct transcriptional activation.
Consistent with a role for T-bet in locus accessibility, endogenous T-bet was required for the accumulation of transcriptionally favorable acetylated histones H3 and H4 and dimethylated H3-K4 in CD4 TH1 cells, and was sufficient to induce such changes in CD4 T cells cultured in TH2 conditions. Like IFN-γ expression, these histone modifications were T-bet-dependent in CD4+ but not CD8+ T cells. Histone modifications were strongest at the promoter, intron 3, and IFNgCNS2, and weakest at IFNgCNS1. The presence of transcriptionally favorable histone modifications at IFNgCNS2 correlated with detection of a DH site at the proximal boundary of this region. By contrast, histone modifications correlated only in part with the binding of T-bet at the endogenous locus, which was strongest at the promoter, consistent but weaker at IFNgCNS1, and weak and inconsistent at IFNgCNS2 in primary TH1 cells.
While this report was in preparation, Lee et al. (31) also identified, by using bioinformatics, the region we refer to as IFNgCNS1. Consistent with our results, they found that this region, when linked to a luciferase reporter embedded in the 5′ UTR of the human IFN-γ gene and then transfected into Jurkat T cells, exhibited strong enhancer activity in response to T-bet or activation with PMA plus ionomycin. Lee at al. (31) detected a DH site in this region in D5 cells, a long-term TH1 cell line. This DH site was evident in cells acutely activated with PMA plus ionomycin and was barely detectable in resting D5 cells; they did not report DH studies with primary TH1 or CD8 T cells. We have been unable to detect a DH site in IFNgCNS1 in primary TH1 or CD8 T cells, but did detect transcriptionally favorable histone modifications in this region, although the magnitude was less than in the gene proximal regulatory elements and IFNg CNS2. Nonetheless, our findings and those of Lee et al. (31) both suggest that IFNgCNS1 is likely to be involved in Ifng gene regulation.
Our findings are consistent with a model in which the promoter is transactivated in response to both transcription factors activated downstream of the T cell receptor and to T-bet, and acts as an organizing center for the initiation and propagation of transcriptionally favorable histone modifications for locus remodeling. The rapid and parallel remodeling at the promoter and IFNgCNS2, despite the presence of a large intervening region between them that does not accumulate these histone modifications (Figs. 4 and 6), suggests that, in chromatin, these two regions might be approximated (presumably by looping), as previously shown for the promoter and the IFNgCNS1 region (32).
Our studies extend the paradigm of distal regulatory elements contributing to T cell subset-specific cytokine production to the signature TH1 cytokine IFN-γ. The contribution of IFNgCNS1 and -2 to the physiological regulation of Ifng in vivo can now be addressed through targeted deletion of these elements.
Supplementary Material
Acknowledgments
We thank H. Harowicz, B. Fallen, and F. Lewis for support and technical assistance, K. Makar and all members of the Wilson laboratory for fruitful discussions, and M. Groudine and M. Bulger for helpful suggestions on ChIP and DNase I HS assays. This work was supported by National Institutes of Health Grants HD18184, HD39454, and HD02602 and National Science Foundation Grant DBI-0218798.
This paper was submitted directly (Track II) to the PNAS office.
Abbreviations: THn, T helper n; DH, DNase I hypersensitive; CNS-1, conserved noncoding sequence 1; PMA, phorbol 12-myristate 13-acetate; ChIP, chromatin immunoprecipitation.
References
- 1.Szabo, S. J., Kim, S. T., Costa, G. L., Zhang, X., Fathman, G. C. & Glimcher, L. H. (2000) Cell 100, 655–669. [DOI] [PubMed] [Google Scholar]
- 2.Avni, O., Lee, D., Macian, F., Szabo, S. J., Glimcher, L. H. & Rao, A. (2002) Nat. Immunol. 3, 643–651. [DOI] [PubMed] [Google Scholar]
- 3.Fields, P. E., Kim, S. T. & Flavell, R. A. (2002) J. Immunol. 169, 647–650. [DOI] [PubMed] [Google Scholar]
- 4.Szabo, S., Sullivan, B. M., Stemmann, C., Satoskar, A. R., Sleckman, B. P. & Glimcher, L. H. (2002) Science 295, 338–342. [DOI] [PubMed] [Google Scholar]
- 5.Pearce, E. L., Mullen, A. C., Martins, G. A., Krawczyk, C. M., Hutchins, A. S., Zediak, V. P., Banica, M., DiCioccio, C. B., Gross, D. A., Mao, C., et al. (2003) Science 302, 1041–1043. [DOI] [PubMed] [Google Scholar]
- 6.Li, Q., Peterson, K. R., Fang, X. & Stamatoyannopolous, G. (2002) Blood 100, 3077–3086. [DOI] [PMC free article] [PubMed] [Google Scholar]
- 7.Pennachio, L. A. & Rubin, E. M. (2003) J. Clin. Invest. 111, 1099–1106. [DOI] [PMC free article] [PubMed] [Google Scholar]
- 8.Loots, G. G., Locksley, R. M., Blankenspoor, C. M., Wang, Z. E., Miller, W., Rubin, E. M. & Frazer, K. A. (2000) Science 288, 136–140. [DOI] [PubMed] [Google Scholar]
- 9.Takemoto, N., Koyano-Nakagawa, N., Yokota, T., Arai, N., Miyatake, S. & Arai, K. (1998) Int. Immunol. 10, 1981–1985. [DOI] [PubMed] [Google Scholar]
- 10.Mohrs, M., Blankenspoor, C. M., Wang, Z. E., Loots, G. G., Afzal, V., Hadeiba, H., Shinkai, K., Rubin, E. M. & Locksley, R. M. (2001) Nat. Immunol. 2, 842–847. [DOI] [PubMed] [Google Scholar]
- 11.Agarwal, S. & Rao, A. (1998) Immunity 9, 765–775. [DOI] [PubMed] [Google Scholar]
- 12.Penix, L., Weaver, W. M., Pang, Y., Young, H. A. & Wilson, C. B. (1993) J. Exp. Med. 178, 1483–1496. [DOI] [PMC free article] [PubMed] [Google Scholar]
- 13.Sweetser, M. T., Hoey, T., Sun, Y. L., Weaver, W. M., Price, G. A. & Wilson, C. B. (1998) J. Biol. Chem. 273, 34775–34783. [DOI] [PubMed] [Google Scholar]
- 14.Aune, T. M., Penix, L. A., Rincon, M. R. & Flavell, R. (1997) Mol. Cell. Biol. 17, 199–208. [DOI] [PMC free article] [PubMed] [Google Scholar]
- 15.Zhu, H., Yang, J., Murphy, T. L., Ouyang, W., Wagner, F., Saparov, A., Weaver, C. T. & Murphy, K. M. (2001) J. Immunol. 167, 855–865. [DOI] [PubMed] [Google Scholar]
- 16.Soutto, M., Zhou, W. & Aune, T. M. (2002) J. Immunol. 169, 6664–6667. [DOI] [PubMed] [Google Scholar]
- 17.Mullen, A. C., High, F. A., Hutchins, A. S., Lee, H. W., Villarino, A. V., Livingston, D. M., Kung, A. L., Cereb, N., Yao, T.-P., Yang, S. Y. & Reiner, S. L. (2001) Science 292, 1907–1910. [DOI] [PubMed] [Google Scholar]
- 18.Fox, H. S., Bond, B. L. & Parslow, T. G. (1991) J. Immunol. 146, 4362–4367. [PubMed] [Google Scholar]
- 19.Grogan, J. L., Mohrs, M., Harmon, B., Lacy, D. A., Sedat, J. W. & Locksley, R. M. (2001) Immunity 14, 205–215. [DOI] [PubMed] [Google Scholar]
- 20.Cho, J. Y., Grigura, V., Murphy, T. L. & Murphy, K. (2003) Int. Immunol. 15, 1149–1160. [DOI] [PubMed] [Google Scholar]
- 21.Makar, K. W., Perez-Melgoza, M., Shnyreva, M., Weaver, W. M., Fitzpatrick, D. R. & Wilson, C. B. (2003) Nat. Immunol. 4, 1183–1190. [DOI] [PubMed] [Google Scholar]
- 22.Ouyang, W., Ranganath, S. H., Eindel, K., Bhattacharya, D., Murphy, T. L., Sha, W. C. & Murphy, K. M. (1998) Immunity 9, 745–755. [DOI] [PubMed] [Google Scholar]
- 23.Siebenlist, U., Henninghausen, L., Battey, J. & Leder, P. (1984) Cell 37, 381–391. [DOI] [PubMed] [Google Scholar]
- 24.Masternak, K., Peyraud, N., Krawczyk, M., Barras, E. & Reith, W. (2003) Nat. Immunol. 4, 132–137. [DOI] [PubMed] [Google Scholar]
- 25.Dubchak, I., Brudno, M., Loots, G. G., Pachter, L., Mayor, C., Rubin, E. M. & Frazer, K. A. (2000) Genome Res. 10, 1304–1306. [DOI] [PMC free article] [PubMed] [Google Scholar]
- 26.Blanchette, M. & Tompa, M. (2002) Genome Res. 12, 739–748. [DOI] [PMC free article] [PubMed] [Google Scholar]
- 27.Bulger, M., Schubeler, D., Bender, M. A., Hamilton, J., Farrell, C. M., Hardison, R. C. & Groudine, M. (2003) Mol. Cell. Biol. 23, 5234–5244. [DOI] [PMC free article] [PubMed] [Google Scholar]
- 28.Ashe, H. L., Monks, J., Wijgerde, M., Fraser, P. & Proudfoot, N. (1997) Genes Dev. 11, 2494–2509. [DOI] [PMC free article] [PubMed] [Google Scholar]
- 29.Omori, M., Yamashita, M., Inami, M., Ukai-Tadenuma, M., Kimura, M., Nigo, Y., Hosokawa, H., Hasegawa, A., Taniguchi, M. & Nakayama, T. (2003) Immunity 19, 281–294. [DOI] [PubMed] [Google Scholar]
- 30.Gribnau, J., Diderich, K., Pruzina, S., Calzolari, R. & Frazer, P. (2000) Mol. Cell 5, 377–386. [DOI] [PubMed] [Google Scholar]
- 31.Lee, D. U., Avni, O., Chen, L. & Rao, A. (2004) J. Biol. Chem. 279, 4802–4810. [DOI] [PubMed] [Google Scholar]
- 32.Eivazova, E. R. & Aune, T. M. (2004) Proc. Natl. Acad. Sci. USA 101, 251–256. [DOI] [PMC free article] [PubMed] [Google Scholar]
Associated Data
This section collects any data citations, data availability statements, or supplementary materials included in this article.


