Abstract
The mechanisms causing persistence of embryonal cells that later give rise to tumors is unknown. One tumorigenic factor in the embryonal childhood tumor neuroblastoma is the MYCN protooncogene. Here we show that normal mice developed neuroblast hyperplasia in paravertebral ganglia at birth that completely regressed by 2 weeks of age. In contrast, ganglia from MYCN transgenic (TH-MYCN) mice demonstrated a marked increase in neuroblast hyperplasia and MycN expression during week 1. Regression of neuroblast hyperplasia was then delayed and incomplete before neuroblastoma tumor formation at 6 and 13 weeks in homo- and hemizygote mice, respectively. Paravertebral neuronal cells cultured from perinatal TH-MYCN mice exhibited 3- to 10-fold resistance to nerve growth factor (NGF) withdrawal, compared with normal mice. Both low- and high-affinity NGF receptors were expressed in perinatal neuroblast hyperplasia but not in neuroblastoma tumor tissue. MYCN transgene amplification was present at low levels in perinatal neuroblast hyperplasia from both homo- and hemizygote TH-MYCN mice. However, only in hemizygous mice did tumor formation correlate with a stepwise increase in the frequency of MYCN amplification. These data suggest that inappropriate perinatal MycN expression in paravertebral ganglia cells from TH-MYCN mice initiated tumorigenesis by altering the physiologic process of neural crest cell deletion. Persisting embryonal neural crest cells underwent further changes, such as MYCN amplification and repression of NGF receptor expression, during tumor progression. Our studies provide a model for studying perinatal factors influencing embryonal tumor initiation.
Keywords: neuroblastoma, regression, in vivo model
Cell death in the developing central and peripheral nervous systems is necessary to control neuronal cell numbers and shape the nervous system to permit physiologic functioning. Embryonal neural cell deletion depends on the delicate interactions between neurons, neurotrophins, and their receptors (1). Most postmitotic neurons, which have been induced to stimulate cell cycle progression or DNA replication, die by apoptosis (2, 3). However, perinatal superior cervical ganglia (SCG) cells overexpressing the MycN oncoprotein reentered S phase and resisted cell death induced by nerve growth factor (NGF) withdrawal (3). Thus, perturbation of neuronal cell death processes at some sites within the nervous system could lead to aberrant consequences, such as embryonal tumorigenesis.
Many malignant diseases of childhood arise in embryonal cell types that have persisted beyond birth by unknown mechanisms to later give rise to tumors in early childhood. Neuroblastoma is an embryonal tumor of paravertebral, autonomic nervous tissues and is uniquely characterized by a high incidence of spontaneous tumor regression (4, 5). The factors that distinguish tumor regression from progression are unknown but may involve abnormal signaling through neurotrophins and their receptors, as suggested by analyses of primary human neuroblastoma tissue and cell lines (6-8).
One important factor in the genesis of human neuroblastoma is the protooncogene, MYCN (9). MYCN encodes a nuclear phosphoprotein member of the c-myc family of helix-loop-helix transcription factors and is selectively expressed in the migrating neural crest and developing kidney (10, 11). Amplification of MYCN is found in the primary tumor cells from 25-30% of patients and is the most powerful prognostic factor in children affected by the disease (9). Transgenic mice with MycN expression targeted to the neural crest (TH-MYCN mice) developed neuroblastoma with a phenotype very similar to the human disease (12). However, we and others have failed to show a consistent association between high-level MycN expression and poor prognosis among the majority of patients whose tumor cells have only a single copy of MYCN (13, 14). We report here that inappropriate MycN expression soon after birth in paravertebral ganglia caused neuroblast hyperplasia in TH-MYCN mice. Neuroblast hyperplasia was also evident in normal mice but underwent early regression. In contrast, regression of neuroblast hyperplasia in TH-MYCN mice was delayed and incomplete, and later tumor formation correlated with MYCN amplification and loss of NGF receptor expression. Our results elucidate mechanisms of embryonal tumor initiation.
Materials and Methods
TH-MYCN Mice. TH-MYCN mice carry in the germline the human MYCN cDNA under the control of the rat tyrosine hydroxylase promoter and are reported in ref. 12. A total of 231 mice resulting from the cross-breeding of hemizygous TH-MYCN mice were used in a blinded, weekly, histologic audit of tumorprone paravertebral tissues over the developmental time period of 1 week before birth (embryonic day 14) through to 20 weeks of age. Paraffin-embedded tissue stained with hematoxylin/eosin were reviewed by light microscopy by two independent observers, and each section was scored for the presence of ≥30-cell neuroblast hyperplasia. Animals were genotyped according to the method described in ref. 15, and the results were sorted according to genotype.
Immunohistochemistry and Terminal Deoxynucleotidyltransferase-Mediated dUTP Nick End Labeling (TUNEL) Staining. Approximately 16 samples for each time point were chosen for immunohistochemical or TUNEL analysis based on genotype. The following antibodies were used in immunohistochemical expression studies: anti-TrkA rabbit polyclonal antibody (BD Biosciences) at 1:1,000 dilution; anti-tyrosine hydroxylase rabbit polyclonal antibody (Chemicon, Temecula, CA) at 1:150 dilution; anti-βIII-tubulin rabbit polyclonal antibody (Convance) at 1:1,000 dilution; MycN (Ab-1) mouse monoclonal antibody (Oncogene Research Products, Boston) at 1:20 dilution; and anti-p75 rabbit polyclonal antibody (Promega) at 1:500 dilution. Sections were incubated with a biotinylated anti-rabbit secondary antibody (DAKO), with the exception of the anti-MycN antibody, and tertiary staining was undertaken with peroxidase-conjugated streptavidin at a dilution of 1:500 (DAKO). The immune complex was visualized by using liquid 3,3-diaminobenzidine (DAB) as a chromagen. Appropriate isotype control antibodies were used (DAKO). MycN staining was performed by using the Tissue Tackle DAB mouse immunohistochemistry system according to the manufacturer's instructions (Merck). Sections were counterstained with hematoxylin. TUNEL staining was performed by using the in situ cell death detection kit POD (Roche) according to the manufacturer's instructions. Evaluation of immunohistochemical and TUNEL staining was performed, using a light microscope, by two independent observers blinded to the mouse genotype, and the intensity of staining was graded on a semiquantitative scale of 0-3+.
Primary Ganglion Culture and Immunofluorescent Staining of Primary Cultures. SCG and celiac ganglia (CG) were dissected from normal and TH-MYCN mice at birth and 1 and 2 weeks of age. Ganglia were placed in Hanks' balanced salt solution (Invitrogen) containing 1 mg/ml collagenase (Sigma) at 4°C for 30 min and then dissociated by adding 0.05% trypsin at 37°C for 5-12 min. Samples were then washed twice, resuspended, and triturated in Neurobasal-A media (Invitrogen) supplemented with 0.5 mM l-glutamine, 25 μM glutamic acid, penicillinstreptomycin (1% vol/vol), and B27 (Invitrogen; 2% vol/vol; complete media). Cells were counted by using standard trypan blue exclusion. Ganglion cells were cultured in complete Neurobasal-A media on poly-d-lysine and laminin-coated coverslips in 24-well plates in the presence of 10 μg/ml anti-NGF antibody (Chemicon) or isotype control (Cedarlane Laboratories) and NGF (50 ng/ml; GroPep, Adelaide, Australia) for 48 h. Ganglion cells were then washed gently, and the medium was replaced by complete Neurobasal-A media and NGF (50 ng/ml) for a further 7 days. The number of neurons surviving withdrawal of NGF was quantitated by using immunofluorescent staining for the neuron-specific marker βIII-tubulin and expressed as the percentage of neurons positive for βIII-tubulin remaining, after NGF withdrawal, compared with control.
Analysis of MYCN Gene Copy Number. Real-time PCR analysis of gene dosage was performed according to the method described in ref. 16. Fluorescence in situ hybridization studies were carried out on touch preparations prepared from frozen tumors and brain tissue or on cytospin preparations from dissociated ganglia. The MYCN transgene plasmid (12) was used as a probe and labeled with digoxigenin-11-dUTP (Roche) by using a nick translation kit (Roche) according to the manufacturer's instructions. Secondary staining was performed with a sheep, antidigoxigenin-fluorescein, Fab fragment antibody (4 μg/ml; Roche) and enhanced with an Alexa Fluor 488 donkey anti-sheep, IgG antibody at 1:1,000 dilution (Molecular Probes). Cells were counterstained with DAPI. Dual-color fluorescence in situ hybridization was performed to determine mitotic cells by using a mouse autosome chromosome-specific probe (D13Mit35, ID Labs, London, ON, Canada), which was biotin-labeled and stained with Texas red avidin (ID Labs). Labeling of the MYCN transgene and probe was observed at ×1,000 in 200 cells counted in five fields for each tissue. Thus, for each tissue and at each time point, MYCN amplification was evaluated in a mean of 200 cells. Individual cells were scored as amplified if the number of labeled transgenes exceeded the expected for a given genotype.
RT-PCR. RNA was obtained from CG and SCG cells, before culture. RT-PCR was performed by standard methodology (17) with the following DNA primers: human MYCN, 5′-CGACCACAAGGCCCTCAGTA-3′ (forward) and 5′-CAGCCTTGGTGTTGGAGGAG-3′ (reverse); mouse β-actin, 5′-GACGGCCCAGTCATCACTAATG-3′ (forward) and 5′-TGCCACAGGATCCATACCC-3′ (reverse). PCR products were separated by base pair size on gels by using standard gel electrophoresis.
Statistical Analysis. Results are expressed as mean values with 95% confidence intervals. For experiments involving two groups of mice, comparisons were made by using the two-tailed, un-paired Student t tests. For experiments involving three groups of mice, one-way ANOVA was performed, and when that analysis revealed a statistically significant difference between groups, pairwise differences between groups were determined with the use of Fisher's protected least significant difference correction. P < 0.05 and 0.01 were considered statistically significant. All data were analyzed with the use of statview 4.1 software (Abacus Concepts, Berkeley, CA).
Ethical Approval. The present study was approved by the Animal Care and Ethics Committee of the University of New South Wales and was conducted under the Animal Research Act 1985 (New South Wales, Australia) and the Australian Code of Practice for the Care and Use of Animals for Scientific Purposes (1997).
Results
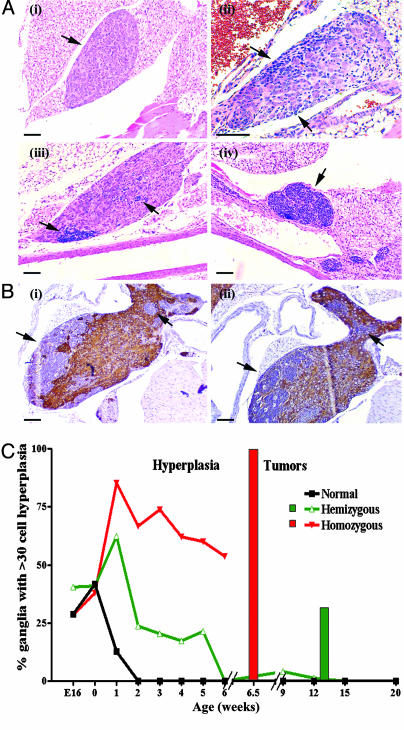
Regression of Perinatal Neuroblast Hyperplasia Precedes Neuroblastoma Formation in TH-MYCN Mice. TH-MYCN mice developed large, paravertebral thoracic or abdominal tumors at a median of 6.5 (±0.27) weeks in 100% of homozygotes and by 13 (±2.67) weeks in 33% of hemizygotes (18). These tumors were indistinguishable from human neuroblastoma tissue based on histologic, immunohistochemical, and cytogenetic studies (12). To better define the process of tumor initiation and to investigate TH-MYCN mice for evidence of neuroblastoma tumor regression, we undertook a histologic audit of tumor-prone, paravertebral ganglia from TH-MYCN mice (n = 158) and nontransgenic or normal littermates (n = 73). We observed groups of 30-500 small, blue round cells in ganglia from TH-MYCN mice, from embryonic day 14 to postnatal week 6, which we have called neuroblast hyperplasia (Fig. 1A). Unlike the surrounding neuronal cells, these cells did not express either tyrosine hydroxylase or βIII-tubulin on immunohistochemical studies (Fig. 1B). Hyperplasias were most often observed as single lesions within a ganglion and were observed most frequently in the CG complex (50.8%) and the SCG (26.7%). In the case of both homozygote and hemizygote mice, the frequency and size of the neuroblast hyperplasia rapidly increased from birth to 1 week of age, then gradually diminished in frequency (Fig. 1C). At 6 weeks of age, hemizygote TH-MYCN mice had no evidence of neuroblast hyperplasia.
Fig. 1.
Neuroblast hyperplasia. (A) Photomicrographs of hematoxylin/eosin staining of paravertebral ganglia. Arrows indicate areas of neuroblast hyperplasia. (i) Paravertebral ganglia with no evidence of hyperplasia (3 weeks old). Early neuroblast hyperplasia was identified by clusters of basophilic (blue) neuroblasts in paravertebral ganglia in both day 0 normal (ii) and TH-MYCN (iii) mice. (iv) Advanced hyperplasias from TH-MYCN mice (3 weeks old). (Scale bars, 100 μm.) (B) Immunohistochemical staining in an inferior cervical (stellate) ganglia with hyperplastic lesions from a TH-MYCN mouse (2 weeks old). Arrows indicate advanced hyperplastic lesions. (Scale bar, 100 μm.) (i) Detection of tyrosine hydroxylase expression (TH). (ii) Detection of βIII-tubulin expression. Hyperplastic lesions were negative for both TH and βIII-tubulin, whereas neuronal cells were positive. Isotype IgG controls were negative (data not shown). (C) Percentage of paravertebral ganglia demonstrating hyperplastic lesions in normal and TH-MYCN mice. Hyperplastic lesions were defined as ≥30 cells. Each line represented one of the three genotypes resulting from the crossing of hemizygous TH-MYCN mice. The bar graph indicates tumor incidence among TH-MYCN mice.
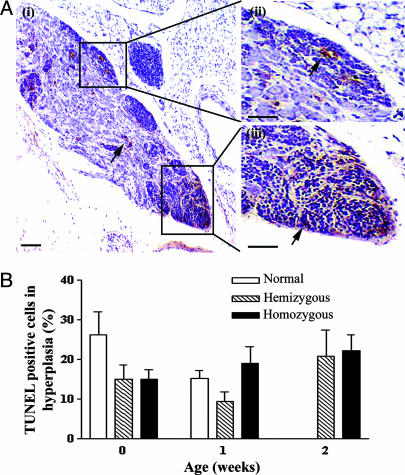
Surprisingly, nontransgenic littermates also demonstrated neuroblast hyperplasia in perinatal, paravertebral ganglia (Fig. 1 A). Although the frequency of hyperplasias in normal mouse ganglia was equivalent to TH-MYCN ganglia at birth, these lesions were not evident beyond the age of 1 week in normal mice. Lesions from all ages of transgenic and normal mice were diffusely TUNEL-positive on immunohistochemical analysis, suggesting that neuroblast hyperplasias regressed by apoptosis (Fig. 2A). No difference was observed in the timing or proportion of neuroblasts undergoing apoptosis in normal or TH-MYCN mice (Fig. 2B).
Fig. 2.
The level of apoptosis in neuroblast hyperplasia. (A) TUNEL immunohistochemical staining for apoptotic cells as indicated by arrows in paravertebral ganglia of 2-week-old TH-MYCN mice, counterstained with hematoxylin. (i) Hyperplastic lesions are boxed (ii and iii) with increased magnification. (Scale bars, 100 μm.) (B) Quantitation of TUNEL-positive cells in hyperplastic lesions of both normal and TH-MYCN mice. Results are expressed as mean values with 95% confidence intervals.
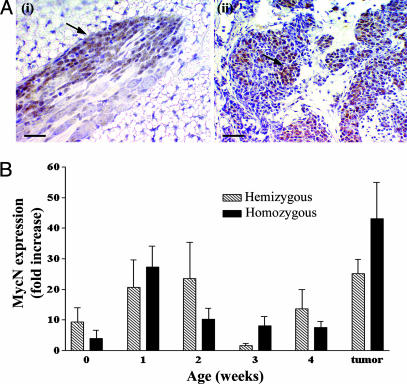
The Pattern of MycN Expression in Neuroblast Hyperplasia and Tumor Tissue. We observed that MycN expression was highest in hyperplasias at week 1 of age, and in tumor tissue (Fig. 3A). Early overexpression of the MycN protein coincided with the sudden increase of neuroblast hyperplasia in TH-MYCN mice at 1 week of age. During regression, MycN protein expression decreased to background levels (Fig. 3B). The pattern of MycN expression was diffusely homogeneous in hyperplasias but markedly heterogeneous in tumor tissue. MycN expression was not evident in neuroblast hyperplasias from normal mice. We did not observe neuroblast hyperplasia in the adrenal medulla of TH-MYCN mice, despite a low level of MycN expression (Fig. 7, which is published as supporting information on the PNAS web site).
Fig. 3.
MycN expression level in neuroblast hyperplasia. (A) Immunohistochemical staining for MycN expression in tissues from TH-MYCN mice with hematoxylin counterstain. (i) Homogeneous MycN expression in early hyperplasia (2-week-old TH-MYCN mouse). (Scale bar, 20 μm.) (ii) Heterogeneous MycN overexpression in tumors as indicated by arrows from a TH-MYCN mouse. (Scale bar, 100 μm.) (B) Histogram quantifying MycN expression over time in tissues from TH-MYCN mice, compared with MycN staining in tissues from normal mice. Mean values are represented by the fold increase in the percentage of positive cells in hyperplastic lesions when compared with the percentage of positive cells in normal mice. Error bars represent 95% confi-dence intervals.
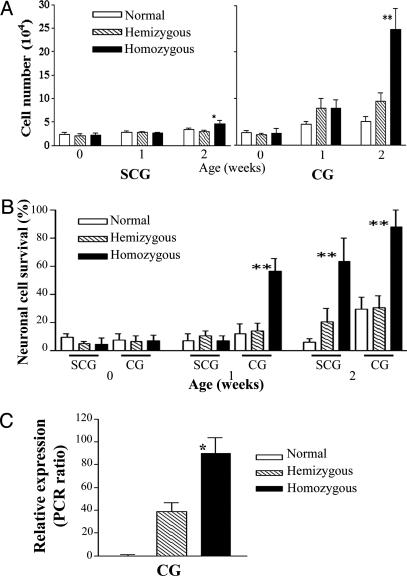
Perinatal Primary Ganglion Cells from TH-MYCN Mice Are Resistant to Death Stimuli. Neuroblast hyperplasia in ganglia from TH-MYCN mice underwent regression; however, this process was delayed and incomplete when compared with ganglia from normal mice. We hypothesized that ganglion cells from TH-MYCN mice would demonstrate resistance to death stimuli, such as withdrawal of NGF (3). We established primary cultures of SCG and CG cells from normal and TH-MYCN mice. Viable cell counts taken after dissociation of SCG and CG, and before culture, reflected our in vivo observation that TH-MYCN ganglia demonstrated an increased cellularity, because of neuroblast hyperplasia at weeks 1 and 2 (Fig. 4A). We next cultured ganglion cells for 2 days in the absence of NGF, followed by a further 7 days in the presence of NGF, and then compared neuronal cell viability between TH-MYCN and normal mice. Neuronal cell death occurred in primary ganglion cultures from normal mice after 2 days of NGF withdrawal, regardless of developmental age or anatomical location of the ganglia (Fig. 4B). In contrast, we observed a significantly greater survival of SCG and CG neurons from homozygous TH-MYCN mice at 1 and 2 weeks after birth (Fig. 4B). We used RT-PCR with human MYCN and mouse β-actin primers to confirm that the ganglion cells from TH-MYCN mice retained a high level of MycN expression (Fig. 4C).
Fig. 4.
Primary ganglia cell cultures. (A) Viable cell counts after dissociation of ganglia from normal and TH-MYCN mice. Data represent the mean values from five independent experiments; error bars represent 95% confidence intervals. Statistical significance was determined for values from the TH-MYCN mice compared with normal mice at the same age; P < 0.05 (*) and 0.01 (**) were considered significant. (B) Histogram quantifying survival of neurons from SCG and CG after NGF withdrawal. Neuronal cells were scored by counting βIII-tubulin-positive cells in treated wells as a percentage of the NGF-treated control wells. Statistical significance was determined by comparing normal mice with TH-MYCN mice of the same age; P < 0.05 (*) and 0.01 (**) were considered significant. (C) mRNA expression levels of the human MycN transgene. Data are presented as a ratio of the densitometric volume of the PCR product for MycN and the control gene, mouse β-actin. All experiments were performed on at least three independent occasions. Statistical signifi-cance was determined by comparing values for homozygous TH-MYCN mice with those for hemizygous TH-MYCN mice of 2 weeks of age; P < 0.05 (*) and 0.01 (**) were considered significant.
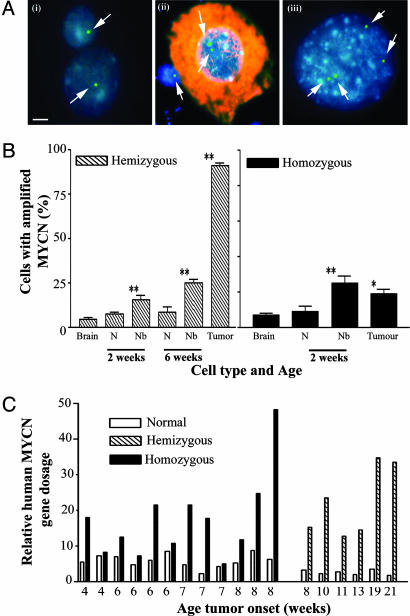
The Incidence of MYCN Transgene Amplification Increases During Tumor Progression. MYCN gene amplification is a common feature of human neuroblastoma and correlates with aggressive clinical behavior. We used a TH-MYCN probe in fluorescence in situ hybridization analysis of cells from paravertebral ganglia and tumor tissue from TH-MYCN mice to examine whether the TH-MYCN transgene was amplified (Fig. 5 A and B). We found that the TH-MYCN transgene was amplified to a maximum level of 5-fold (range 2-5) in perinatal neuroblast hyperplasia and tumor tissue. Using a chromosome-specific probe (data not shown) and metaphase preparations (Fig. 8, which is published as supporting information on the PNAS web site), we confirmed that the increase in transgene copy number was not due to cell mitosis. Cell and tissue preparations were counterstained for βIII-tubulin to determine whether transgene amplification was found in neuroblasts or neurons (Fig. 5B). Neuroblast cells from homozygote mice demonstrated a 3-fold higher incidence of transgene amplification at 2 weeks of age in paravertebral ganglia tissue when compared with brain cells from homozygote mice. The incidence of transgene amplification in homozygote tissues did not change from neuroblast hyperplasia at 2 weeks of age to tumor formation at 6 weeks of age. In contrast, the incidence of transgene amplification steadily increased in hemizygote mouse tissues. Interestingly, in both homozygote and hemizygote tissues transgene amplification was occasionally observed in mature ganglion cells. TH-MYCN amplification was further evaluated by using real-time PCR analysis of MYCN gene dosage in tumor tissue (Fig. 5C). This PCR-based assessment of transgene copy number confirmed that transgene amplification was more frequent in hemizygous tumors. We found no evidence of gene amplification involving the endogenous murine MYCN gene.
Fig. 5.
MYCN transgene amplification. (A) MYCN transgene copy number, detected by using a human MYCN cDNA probe (green; indicated by arrow) in a fluorescence in situ hybridization technique and counterstained with DAPI (blue) (scale bar, 5 μm), in control hemizygous TH-MYCN mouse-derived brain cells (i) (2 weeks); hemizygous TH-MYCN mouse-derived CG cells (ii) (2 weeks), with immunocytochemical detection of the neuronal marker βIII-tubulin (red); and hemizygous TH-MYCN mouse-derived tumor cells (iii) (16 weeks). (B) Histogram showing the percentage of cells with MYCN transgene amplification in neurons, neuroblasts, and tumor cells from hemizygous and homozygous TH-MYCN mice. Cell types were distinguished by double labeling with βIII-tubulin. N, neurons; Nb, neuroblasts. Statistical significance was determined by comparing TH-MYCN ganglia cells with TH-MYCN mouse-derived brain cells for mice at the same age and genotype; P < 0.05 (*) and 0.01 (**) were considered significant. (C) Histogram showing the relative MYCN gene amplification by real-time PCR for tissues from normal and TH-MYCN mice.
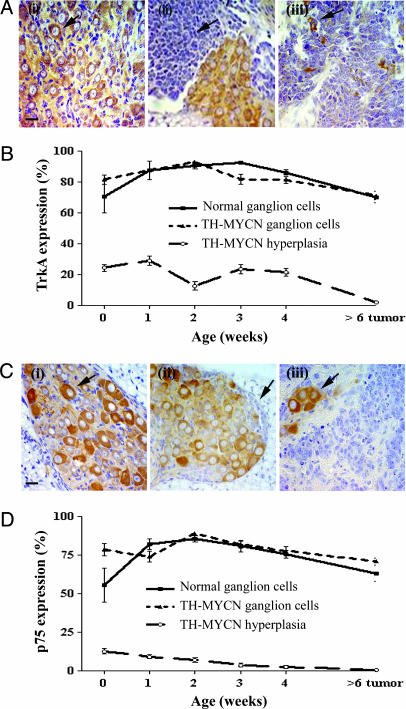
The Pattern of NGF Receptor Expression in Neuroblast Hyperplasias and Neuroblastoma Tumors. Several lines of evidence have suggested that diminished expression levels of high- and low-affinity NGF receptors, TrkA and p75, may impair neurotrophin signaling and thus contribute to tumorigenesis in neuroblastoma cells (7, 8). Immunohistochemical analysis of TrkA (Fig. 6 A and B) and p75 (Fig. 6 C and D) expression in perinatal ganglia, from birth to 4 weeks of age, revealed no significant differences in tissue comparisons between normal and TH-MYCN mice. Perinatal neuronal cells from normal or TH-MYCN mice expressed both TrkA and p75, whereas the proportion of neuroblasts expressing TrkA or p75 was much lower than that observed in neurons. However, expression of either TrkA or p75 was undetectable in neuroblastoma tumor tissues from TH-MYCN mice (Fig. 6 A and C).
Fig. 6.
NGF receptor expression in paravertebral ganglia. (A) Immunohistochemical staining for expression of the high-affinity NGF receptor, TrkA, using an anti-TrkA antibody. (Scale bar, 20 μm.) (i) A ganglion from a normal mouse (2 weeks); the arrow indicates TrkA expression. (ii) A ganglion with neuroblast hyperplasia from a TH-MYCN mouse (2 weeks); the arrow indicates the area of hyperplasia. (iii) A neuroblastoma tumor from a homozygous TH-MYCN mouse (7 weeks); the arrow indicates a TrkA-positive cell. Isotype IgG controls were negative (data not shown). (B) Graph comparing expression levels of TrkA in ganglia, hyperplasia, and tumor from TH-MYCN mice. Mean values are represented by the percentage of positive cells. Error bars represent 95% confidence intervals. (C) Immunohistochemical staining for expression of the low-affinity NGF receptor, p75, using an anti-p75 antibody. (Scale bar, 20 μm.) (i) A ganglion from a normal mouse (2 weeks); the arrow indicates p75 expression. (ii) A ganglion with neuroblast hyperplasia from a TH-MYCN mouse (2 weeks); the arrow indicates the area of hyperplasia. (iii) A neuroblastoma tumor from a homozygous TH-MYCN mouse (7 weeks); the arrow indicates a p75-positive cell. Isotype IgG controls were negative (data not shown). (D) Graph comparing expression levels of p75 in ganglia, hyperplasia, and tumor from TH-MYCN mice. Mean values are represented by the percentage of positive cells. Error bars represent 95% confidence intervals.
Discussion
We have shown that neuroblastoma tumor formation in TH-MYCN mice was preceded by neuroblast hyperplasia in the first weeks after birth, in tumor-prone paravertebral ganglia. These findings closely mirror descriptions of human neuroblast hyperplasia in the adrenal medulla of infants dying of other diseases, at a frequency which was many fold higher than the clinical incidence of neuroblastoma in early childhood (19-21). Inappropriate MycN expression from the transgene in these cells caused resistance to cell death in vivo and in vitro. The role of TH-MYCN amplification in tumor progression appeared to be different for hemizygote and homozygote mice. Repressed neurotrophin receptor expression was a feature of tumor tissue but not of neuroblast hyperplasia. Taken together, our results suggest a potential mechanism for embryonal tumor initiation and point to distinct roles for MycN expression and amplification in TH-MYCN mice.
Our results indicate that neuroblast cell deletion was delayed and incomplete in TH-MYCN mice, as part of a complex tumorigenic process. The neuroblast regression factor appeared to be equally active and effective in both transgenic and normal mice, because the slope of the line describing the decrease in hyperplasia incidence was similar for both transgenic and normal mice. Our immunohistochemical assessment of TUNEL-positive cells showed that apoptosis was present equally in transgenic and normal perinatal ganglia. Our preliminary results suggest that the neuroblast regression factor was not a secreted product, because we were unable to show a difference in the response of transgenic and normal primary ganglia cells to NGF withdrawal, when cultured alternatively in the presence of conditioned media from normal or transgenic cells (data not shown). The nature of the factor inducing spontaneous neuroblast regression remains elusive but, when identified, offers great promise as a therapeutic in the disease. Previous studies aimed at identifying the regression factor have focused on changes in the expression of regulator and effector proteins of apoptosis, such as Bcl-2, Survivin, and Caspase-8 (22-24).
Our data indicates that in our model, loss of NGF receptor expression occurs during tumor progression, rather than at tumor initiation. Resistance to NGF withdrawal in vitro is considered a reliable reflection of the apoptotic process, which shapes the perinatal neural crest in vivo (22). During neurodevelopment, TrkA is dominant over p75 as a survival signal, whereas p75 can act as a survival or death signal, depending on the cellular context (25, 26). Thus, perinatal MycN overexpression may have changed the balance between competing neurotrophin receptor signals in favor of survival in some neuroblasts. Careful dissection of each of the neurotrophin signaling pathways by using biochemical and genetic approaches will be required before the in vivo targets of MycN expression can be identified.
We have shown here that tumor progression in hemizygote TH-MYCN mice is associated with amplification of MYCN. This finding indicates selection of cells that have developed amplification of MYCN, ensuring a level of MycN expression above a threshold required for tumor progression. We know from our recent work using MYCN antisense oligonucleotides in the TH-MYCN model, and from the work of others, that inhibiting MycN expression directly in neuroblastoma cells alters the malignant phenotype but does not completely ablate tumor formation (18, 27, 28). Our data suggest that, in this model, a high level of MycN expression in paravertebral ganglion cells may have played two distinct but complementary roles: (i) prevention of complete neuroblast deletion in the perinatal period, and (ii) a necessary but not sufficient role in tumor progression.
Unlike the human disease, neuroblastoma tumorigenesis in our model is initiated solely by the TH-MYCN transgene. Furthermore, we cannot rule out the possibility that other protooncogenes, such as c-myc or activated H-ras, when placed under the control of the tyrosine hydroxylase promoter, could give rise to a similar tumor phenotype (29). Our failure to identify neuroblast hyperplasia in the adrenal medulla, despite a low level of MycN expression, highlights another difference between the model and the human disease. These differences may also reflect the promoter-specific influences on the timing and amplitude of MycN expression in some tumor-prone tissues in the model. Nonetheless, our results suggest the need for further studies of MycN expression or MycN-activated signaling pathways in human, perinatal, paravertebral ganglia. TH-MYCN mice also provide an important model system for further study of potential tumor promoter factors in the perinatal environment.
Supplementary Material
Acknowledgments
We thank Dr. Anthony Dilley, Dr. Susan Maastricht, and Janelle McPhee for their help with animal anatomy and experiments, and Mr. Jian Yang for his help with pathology samples. Children's Cancer Institute Australia for Medical Research is affiliated with the University of New South Wales and Sydney Children's Hospital.
This paper was submitted directly (Track II) to the PNAS office. Abbreviations: CG, celiac ganglia; NGF, nerve growth factor; SGC, superior cervical ganglia; TUNEL, terminal deoxynucleotidyltransferase-mediated dUTP nick end labeling.
References
- 1.Huang, E. J. & Reichardt, L. F. (2001) Annu. Rev. Neurosci. 24, 677-736. [DOI] [PMC free article] [PubMed] [Google Scholar]
- 2.Freeman, R. S., Estus, S. & Johnson, E. M., Jr. (1994) Neuron 12, 343-355. [DOI] [PubMed] [Google Scholar]
- 3.Wartiovaara, K., Barnabe-Heider, F., Miller, F. D. & Kaplan, D. R. (2002) J. Neurosci. 22, 815-824. [DOI] [PMC free article] [PubMed] [Google Scholar]
- 4.Woods, W. G., Gao, R. N., Shuster, J. J., Robison, L. L., Bernstein, M., Weitzman, S., Bunin, G., Levy, I., Brossard, J., Dougherty, G., et al. (2002) N. Engl. J. Med. 346, 1041-1046. [DOI] [PubMed] [Google Scholar]
- 5.Brodeur, G. M. (2003) Nat. Rev. Cancer 3, 203-216. [DOI] [PubMed] [Google Scholar]
- 6.Nakagawara, A. (2001) Cancer Lett. 169, 107-114. [DOI] [PubMed] [Google Scholar]
- 7.Nakagawara, A., Arima, M., Azar, C. G., Scavarda, N. J. & Brodeur, G. M. (1992) Cancer Res. 52, 1364-1368. [PubMed] [Google Scholar]
- 8.Nakagawara, A., Arima-Nakagawara, M., Scavarda, N. J., Azar, C. G., Cantor, A. B. & Brodeur, G. M. (1993) N. Engl. J. Med. 328, 847-854. [DOI] [PubMed] [Google Scholar]
- 9.Maris, J. M. & Matthay, K. K. (1999) J. Clin. Oncol. 17, 2264-2279. [DOI] [PubMed] [Google Scholar]
- 10.Sawai, S., Shimono, A., Wakamatsu, Y., Palmes, C., Hanaoka, K. & Kondoh, H. (1993) Development (Cambridge, U.K.) 117, 1445-1455. [DOI] [PubMed] [Google Scholar]
- 11.Thomas, W., Raif, A., Hansford, L. & Marshall, G. M. (2004) Int. J. Biochem. Cell Biol. 36, 771-775. [DOI] [PubMed] [Google Scholar]
- 12.Weiss, W. A., Aldape, K., Mohapatra, G., Feuerstein, B. G. & Bishop, J. M. (1997) EMBO J. 16, 2985-2995. [DOI] [PMC free article] [PubMed] [Google Scholar]
- 13.Chan, H. S., Gallie, B. L., DeBoer, G., Haddad, G., Ikegaki, N., Dimitroulakos, J., Yeger, H. & Ling, V. (1997) Clin. Cancer Res. 3, 1699-1706. [PubMed] [Google Scholar]
- 14.Cohn, S. L., London, W. B., Huang, D., Katzenstein, H. M., Salwen, H. R., Reinhart, T., Madafiglio, J., Marshall, G. M., Norris, M. D. & Haber, M. (2000) J. Clin. Oncol. 18, 3604-3613. [DOI] [PubMed] [Google Scholar]
- 15.Burkhart, C. A., Norris, M. D. & Haber, M. (2002) J. Biochem. Biophys. Methods 52, 145-149. [DOI] [PubMed] [Google Scholar]
- 16.Norris, M. D., Burkhart, C. A., Marshall, G. M., Weiss, W. A. & Haber, M. (2000) Med. Pediatr. Oncol. 35, 585-589. [DOI] [PubMed] [Google Scholar]
- 17.Norris, M. D., Bordow, S. B., Marshall, G. M., Haber, P. S., Cohn, S. L. & Haber, M. (1996) N. Engl. J. Med. 334, 231-238. [DOI] [PubMed] [Google Scholar]
- 18.Burkhart, C. A., Cheng, A. J., Madafiglio, J., Kavallaris, M., Mili, M., Marshall, G. M., Weiss, W. A., Khachigian, L. M., Norris, M. D. & Haber, M. (2003) J. Natl. Cancer Inst. 95, 1394-1403. [DOI] [PubMed] [Google Scholar]
- 19.Beckwith, J. B. & Perrin, E. V. (1963) Am. J. Pathol. 43, 1089-1104. [PMC free article] [PubMed] [Google Scholar]
- 20.Turkel, S. B. & Itabashi, H. H. (1974) Am. J. Pathol. 76, 225-244. [PMC free article] [PubMed] [Google Scholar]
- 21.Ikeda, Y., Lister, J., Bouton, J. M. & Buyukpamukcu, M. (1981) J. Pediatr. Surg. 16, 636-644. [DOI] [PubMed] [Google Scholar]
- 22.Ikegaki, N., Katsumata, M., Tsujimoto, Y., Nakagawara, A. & Brodeur, G. M. (1995) Cancer Lett. 91, 161-168. [DOI] [PubMed] [Google Scholar]
- 23.Adida, C., Berrebi, D., Peuchmaur, M., Reyes-Mugica, M. & Altieri, D. C. (1998) Lancet 351, 882-883. [DOI] [PubMed] [Google Scholar]
- 24.Teitz, T., Wei, T., Valentine, M. B., Vanin, E. F., Grenet, J., Valentine, V. A., Behm, F. G., Look, A. T., Lahti, J. M. & Kidd, V. J. (2000) Nat. Med. 6, 529-535. [DOI] [PubMed] [Google Scholar]
- 25.Miller, F. D. & Kaplan, D. R. (2001) Cell Mol. Life Sci. 58, 1045-1053. [DOI] [PMC free article] [PubMed] [Google Scholar]
- 26.Frade, J. M., Rodriguez-Tebar, A. & Barde, Y. A. (1996) Nature 383, 166-168. [DOI] [PubMed] [Google Scholar]
- 27.Negroni, A., Scarpa, S., Romeo, A., Ferrari, S., Modesti, A. & Raschella, G. (1991) Cell Growth Differ. 2, 511-518. [PubMed] [Google Scholar]
- 28.Schmidt, M. L., Salwen, H. R., Manohar, C. F., Ikegaki, N. & Cohn, S. L. (1994) Cell Growth Differ. 5, 171-178. [PubMed] [Google Scholar]
- 29.Sweetser, D. A., Kapur, R. P., Froelick, G. J., Kafer, K. E. & Palmiter, R. D. (1997) Oncogene 15, 2783-2794. [DOI] [PubMed] [Google Scholar]
Associated Data
This section collects any data citations, data availability statements, or supplementary materials included in this article.


