

Abstract
Mucins are difficult to handle for their identification and characterization via proteomic applications due to their heavily glycosylated nature (up to 90%), high molecular weight (200 kDa–200 MDa), and size (Rg 10–300 nm). Their core proteins are extremely large and highly substituted with oligosaccharides, which only allow access to a highly restricted portion of their protein. For this reason, conventional 1D or 2D polyacrylamide gel-based proteomic approaches are not effective for identification and characterization of mucin molecules. In this chapter, we present our current protocol employing a modified shotgun proteomic approach to identify these complex glycoproteins.
Keywords: Mucins, Mucus, Glycoproteins, Proteomics, Mass spectrometry, UPLC, Shotgun proteomics
1. Introduction
Mucins are heavily glycosylated, large glycoproteins found mainly on mucosal surfaces, such as respiratory, gastrointestinal, and urogenital systems. They are produced by both mucosal surface goblet cells and submucosal gland mucous cells (1). Mucins are densely coated with O-linked oligosaccharides that make them large both in size and mass. As protein products of MUC genes, mucins show complex multidomain structures (2, 3). The large gel-forming mucins, such as MUC5AC and MUC5B, have very large, defined, heavily glycosylated regions that are encoded in a single large exon which contains a number of short cysteine-rich, unglycosylated regions. Their NH3 -and COOH-terminal regions are composed of sparsely glycosylated protein regions, which contain cysteine-rich von Willebrand factor (vWF)-like domains. Other mucins, like MUC1 and MUC4, are characterized by small transmembrane regions at one end and their glycosylated regions containing numbers of repeats termed VNTRs which are characterized by a variable number of tandem repeat regions found in different individuals. Some membrane-associated mucins contain only one glycosylated region and display complexity on their COOH-terminal ends by having N-glycosylated regions, cysteine-rich regions, SEA regions, transmembrane, and cytoplasmic domains. The so-called membrane-associated mucins can also be found as secreted soluble forms released from the membrane-tethered molecule probably after protein cleavage (4).
The presence of mucins and other large glycoconjugates, such as proteoglycans, glycoproteins, and glycolipids, and also the presence of large protein complexes prevent the use of conventional 1D or 2D gel approaches for complete proteome analysis of the mucous samples, such as saliva and cervical and tracheobronchial mucus gels (5, 6). In particular, mucins are difficult to handle for their identification and characterization via proteomic applications due to their heavily glycosylated nature (up to 90% carbohydrate by weight), high molecular weight (0.2–200 × 106 Da), and size (Rg 10–300 nm). The high number of attached oligosaccharides only allows limited access to their protein regions (see Note 1).
Over the last decade, the shotgun proteomics approach has become the preferred method to analyze complex protein mixtures (7–9). With this method, the complex protein mixture after treatment with specific proteases is subsequently fractionated and analyzed by liquid chromatography coupled to tandem mass spectrometry (LC-MS/MS). It provides a powerful alternative to gel-based proteomics applications and has been developed to a high degree of sophistication such that now it is routine to employ a multidimensional, sequential cation exchange and reverse-phase chromatography approach to feed samples directly into the mass spectrometer (10, 11). The method has also been improved by introducing a nanoscale variable flow interface (called peak trapping or peak parking (PP)-LC/MS-MS) which enhances the analysis and peptide coverage of the proteome (12).
In this chapter, we describe the protocol for identification and characterization of the mucins and their interacting proteins (see Note 2) by shotgun mass spectrometric methods.
2. Materials
2.1. Mucin Extraction and Purification
See Chapter 2 for a more detailed protocol for extraction of mucins.
2.2. Preparation of Mucin Samples for Digestion (Reduction/Carboxymethylation and Desalting) and Trypsin Digestion
Guanidine hydrochloride (GuHCl, high purity grade, Sigma, USA).
Mucin reduction buffer: 6M GuHCl, 0.1M Tris–HCl, 5 mM EDTA, pH 8.0.
Reducing agent: 5 mM dithiothreitol (prepare fresh).
Cysteine blocking: 15 mM iodoacetamide (prepare fresh).
Digestion buffer: 50 mM ammonium hydrogen carbonate (NH4HCO3) (prepare fresh).
G25 HiTrap™ (GE Bio-sciences Uppsala, Sweden) or equivalent desalting column.
Proteomics grade modified trypsin (Promega, CA, USA, or Sigma, USA) (see Notes 3 and 4).
Trypsin resuspension buffer, 0.1M HCl.
Trypsin dilution/dissolving buffer, 100 mM ammonium hydrogen carbonate (NH4HCO3).
2.3. Separation and Concentration of Mucin Peptides from Glycopeptides
Conditioning and running buffer: 50 mM NH4 HCO3.
Superdex 200 HR 10/30 (GE Bio-sciences, Uppsala, Sweden) (24 mL) or equivalent gel permeation chromatography column.
Ettan LC with Frac-950 fraction collector (GE Bio-sciences, Uppsala, Sweden) or equivalent HPLC or FPLC system with fraction collector.
Silicon-coated, low-binding, 1.5-mL microcentrifuge tubes (see Note 5).
Formic acid.
A Speedvac vacuum concentrator with a cooling trap (e.g., Heto vacuum centrifuge).
2.4. Mass Spectrometry
A hybrid Quadrupole/Time Of Flight (Q-TOF) mass spectrometry system (e.g., Q-TOF micro, Waters, Milford, MA).
A capillary HPLC or UPLC system, e.g., CapLC® system or nanoAcquity® (Waters, MA, USA) ultrahigh-pressure LC system, both comprise a nano flow capillary LC pump and an autosampler.
Mass spectrometry grade water (18 mΩ), e.g., Milli-Q Synthesis® 18 φ water purification system (Millipore, MA, USA).
Acetonitrile, LC/MS grade (Optima®, Fisher, USA).
Formic acid (Fluka Chemical, USA).
Mobile phase A for CapLC®: 5% acetonitrile in 0.1% (v/v) formic acid (200 mL). Mix 10 mL acetonitrile and 190 mL of 18 mΩ water and degas for 20 min (see Note 6). Add 200 μL formic acid and mix gently. Prepare once a week.
Mobile phase B for CapLC®: 95% (v/v) acetonitrile in 0.1% formic acid (v/v) (100 mL): Mix 95 mL acetonitrile and 5 mL of 18 mΩ water and degas for 20 min. Add 100 μL formic acid and mix gently. Prepare once a week.
Mobile phase A for nanoAcquity®: 0.1% (v/v) formic acid in water (200 mL). Degas 200 mL of 18 mΩ water for 20 min. Add 200 μL formic acid and mix gently. Prepare once a week.
Mobile phase B for nanoAcquity®: 100% acetonitrile, 0.1% formic acid (100 mL): Degas 100 mL of acetonitrile for 20 min. Add 100 μL formic acid and mix gently. Prepare once a week.
Trap column: PepMap™ C18, 300 μm ID × 5 mm (LC Packing, CA, USA), Symmetry® C18 180 μm × 20 mm, 5 μm (Waters, MA, USA) or equivalent preconcentration column.
Analytical column: Atlantis® (Waters) dC18 NanoEase™ (75 μm × 150 mm) nanoscale analytical column or 100 μm × 100 mm 1.7 μm, BEH130 nanoscale column (Waters. Milford, MA).
Spray tip: PicoTip™ (New Objectives, MA, USA) capillary with 10 μm diameter.
Calibration standard: Glu-Fibrinopeptide B (Sigma, MO, USA).
Quality control digest standard (see Note 7): Enolase (Sigma, MO, USA), alcohol dehydrogenase (ADH) (ICN Biomedicals, OH, USA) or MassPREP™ (Waters, Milford, MA, USA) enolase and/or ADH standards.
Masslynx 4.0 or equivalent data acquisition software with Proteinlynx or equivalent data processing module.
Mascot Search Engine v 2.0 or later (Matrix Science, London, UK) or an equivalent database search engine.
3. Methods
A schematic diagram of the strategy from mucin isolation to identification is given in Fig. 1 and an example mass spectra for MUC5B is shown in Fig. 2.
Fig. 1.
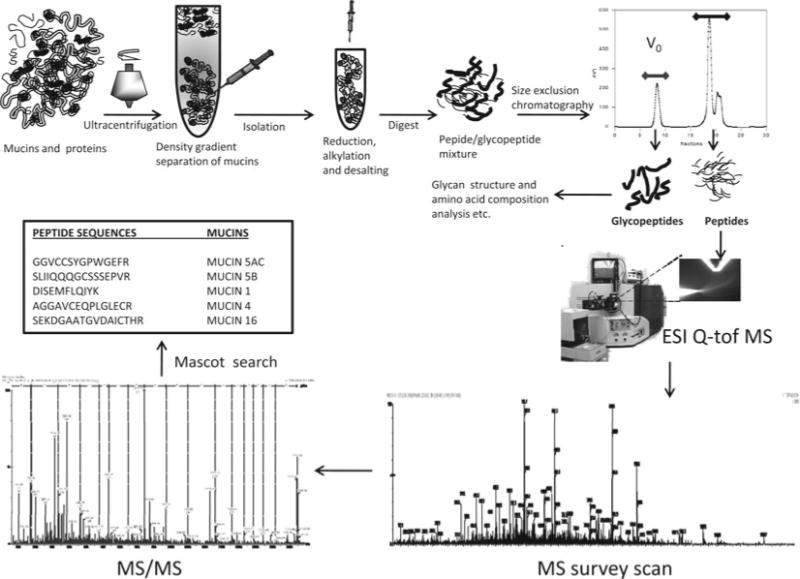
Schematic summary of the approach used for mucin isolation and identification. V0 Void volume of the column; ESI Q-TOF MS electron spray ionization hybrid quadrupole-time-of-flight mass spectrometry.
Fig. 2.
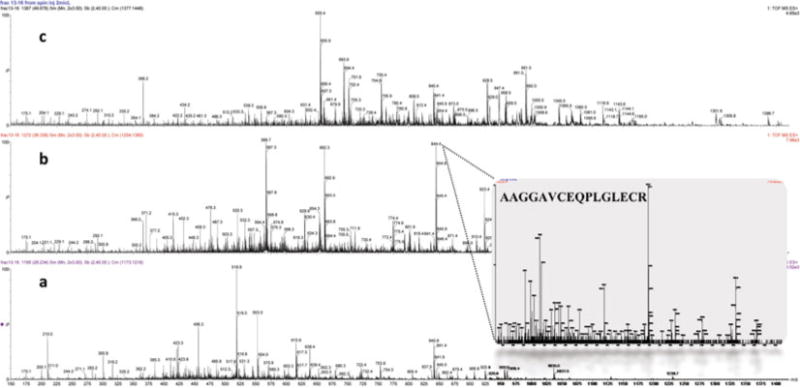
Mass spectra of the MUC5B digest over different retention time scans during the capillary reverse-phase separation. Typical survey scan mass spectra of: (a) early (22–28 min), (b) middle (30–40 min), and (c) late (42–50 min) eluted peptides. Inset spectra: MS/MS spectra of the doubly charged precursor ion 844.41 Da, AAGGAVCEQPLGLECR.
3.1. Isolation and Purification of Mucins
Although mucins are highly abundant in the mucus samples, there are over a hundred other proteins some of which are also very abundant (5). We have found that in order to maximize both numbers of proteins identified and mucin protein coverage the initial complexity of the mixture has to be reduced by prefractionation using CsCl/4MGuHCl density-gradient centrifugation. The advantage of separating the major mucins, especially gel-forming mucins MUC5B and MUCAC, from the other proteins using CsCl was apparent (5). Density-gradient centrifugation is a powerful approach for obtaining a group separation of mucins from proteins and lipids (13) on the basis of solute density. It has the key advantage of concentrating rather than diluting the molecules of interest that are being separated. Separations of the proteins with CsCl/4MGuHCl density-gradient centrifugation gave us another dimension of separation, lowered the complexity of the sample, and improved the detection of both mucin-rich and protein-rich fractions (5) (see Note 8).
3.2. Preparation of the Mucin Samples for Digestion (Reduction/Carboxymethylation and Desalting and Trypsin Digestion)
Breaking large mucin oligomeric structures and making mucin subunits (monomers) employing reduction and alkylation:
Add DTT to mucin preparation to make 10 mM to a final concentration and reduce mucins at 37°C for 2 h or 45 min at 65°C.
Block free thiol groups with the addition of iodoacetamide to a final concentration of 20 mM at room temperature in the dark for 0.5 h.
Prewash/equilibrate a Sephadex G25 (5 × 5 cm) desalting column with 10 mL of digestion buffer (50 mM NH4 HCO3).
Take 1.5 mL of the reduced and carboxymethylated mucin preparation and load to the preconditioned Sephadex G25 column.
Elute the samples from the column with 50 mM NH4 HCO3 and collect first 2 mL of eluant.
Add 10 μL of trypsin solution (100 ng/μL) and incubate overnight at 37°C.
3.3. Gel Permeation Chromatography for Peptide/Glycopeptide Separation
Digestion of mucins with proteases yields, in addition to small peptides, very high molecular weight glycopeptides (104–106 Da). These major fragments, on occasion, poisoned our capillary nanoscale analytical columns in the LC-MS/MS. Therefore, we introduced a gel permeation chromatography step, after digestion, to separate the heavily glycosylated mucin glycopeptides from the smaller peptides. The glycopeptides can be used for some other applications, such as sugar and amino acid analysis, for their further characterization. Peptides are pooled and subjected to mass spectrometry analysis.
Precondition the Superdex 200 HR 10/30 column with 50 mM NH4 HCO3.
Inject 2 mL of the digested mucin preparation and elute with a flow rate of 0.3 mL/min. Collect 32 × 1-mL fractions.
In this particular size column at this flow rate, glycopeptides eluted in the V0 volume (8–10 mL) while peptides with different sizes elute in broader region, between 17 and 22 mL (fractions 16–21). The Vt volume of this column is about 24 mL.
Wash column for additional 15 mL or until getting a steady baseline to be ready for next injection.
Add 10 μL of 1% formic acid to each 1-mL fraction (fractions 16–21) and place them to the vacuum concentrator. Concentrate the volume down to ~10–20 μL. This step takes about 3–4 h depending on the concentrator.
Pool all the fractions (50–100 μL) and concentrate again down to 10–20 μL.
Add 1–2 μL of 1% formic acid to the final concentrated peptides.
Centrifuge for 10 min at 5,000 × g.
Transfer peptides to “maximum recovery” (Waters, MA, USA) sample vial.
3.4. LC-ESI Mass Spectrometry
The shotgun proteomic method usually entails the delivery of a very complex peptide mixture into the mass spectrometer using an in-line or off-line 1D or 2D chromatographic separation (9, 10, 14). The success of this technique depends on the optimization of peptide preseparation and the delivery rate of the peptides to the sprayer tip, on the one hand, and the data-directed analysis (DDA) duty cycle of the MS on the other. Identification can be enhanced significantly in some cases by nanoscale chromatography in 1 or 2 more dimensions combined with variable flow (peak parking, see Note 13) (12).
3.4.1. CapLC/Nano Acquity Conditions
Nanoscale capillary liquid chromatography is one of the crucial pieces of the LC-MS/MS identification of complex protein/peptide mixtures. New cutting-edge LC technologies, e.g., ultrahigh (10,000 psi)-pressure LC systems which permit the use of smaller particle (1.7 μm)-size media, provide improvement in chromatographic performance, such as increased analytical speed, resolution, and sensitivity. Please see ref. 15 for more information, including troubleshooting tips, on nano-liquid chromatography.
We have experience in two different LC sample/solvent delivery system, CapLC® and nanoAcquity UPLC® (Waters, MA, USA). The nanoAcquity UPLC system was introduced relatively recently and has many advantages for end users, such as reliable, reproducible high-resolution chromatography with splitless nano flow. Importantly, the system is extremely robust and requires very little user time for the maintenance. The technical details and experimental running conditions of these sample delivery systems are given below.
Digested samples (1–2 μL) are introduced either via a Waters CapLC® system or Waters nanoAcquity® LC system; both comprise a nano flow capillary LC pump and an autosampler.
The CapLC analytical system is connected to a ten-port valve called a stream select valve.
The stream select module is attached directly to the Z spray source and is configured with a PepMap™ C18 (LC Packing, 300 μm ID × 5 mm) preconcentration column in series with an Atlantis® (Waters) dC18 NanoEase™ (75 m × 150 mm) nanoscale analytical column.
Program the pump to deliver 9 μL/min, and a splitter gave a resultant flow through the analytical column 200 nL/min with a split ratio of 45 at about 1,200 psi backpressure.
Elute the peptides from analytical column with a gradient of 5% acetonitrile in 0.1% formic acid to 60% acetonitrile in 0.1% formic acid over 65 min.
Nano acquity UPLC system consists of only one six-port valve and is capable of delivering mobile-phase splitless as low as 200 nL/min.
The tryptic digest is introduced via a nano acquity system configured with a Symmetry C18 180 μm × 20 mm, 5 μm (Waters) preconcentration/desalting column in series with a nanoAcquity UPLC® column, 100 μm × 100 mm 1.7 μm, BEH130 nanoscale analytical column. Typical flow rate is 400 nL/min at about 1,900 psi backpressure.
Peptides are trapped in the trapping column for 3 min and eluted with the following gradient: 1–50% solvent B in 45 min followed by 50–85% solvent B for 5 min.
Wash column with 85% solvent B for 10 min.
3.4.2. Mass Spectrometry Settings
Mass spectrometry analysis of purified and concentrated peptide mixtures is performed with a hybrid Q-TOF instrument (micro, Waters, MA, USA).
For such a machine, set capillary, sample cone, and extraction cone voltage to 3 kV, 45 V, and 2 V, respectively. Set source temperature to 80°C.
To calibrate the instrument: Inject 1 μL of 1 pmol/L Glufib standard and acquire MS/MS data.
Trap GluFib in the trapping column for 3 min with 5 μL/min flow rate. Elute GluFib 40% solvent B for 20 min.
-
Create an MSMS data acquisition file with the following parameters: Set mass 785.8, low mass 100, high mass 1,500, scan time 2.4 s, interscan time 0.1 s, and collision energy 30 V. You should get an intensity of at least 50 for the 684.35 Da fragment ion.
Perform a quality control test before injecting the mucin sample by injecting 2 μL of 500 fmol/mL enolase digest. Perform a sample run and you should get at least 12 peptides identified 60% coverage from the enolase suggesting a good sensitivity for your Q-TOF micro (see Note 14).
- For sample analysis: Create a DDA to define MS and MS/MS method using the following variables:
- Mass survey range 150–2,000
- Survey scan time 0.9 s, interscan time 0.1 s
- MS/MS start mass 100, end mass 1,700
- Number of MS/MS component 3
- Exclude singly charged ions, and include doubly and triply charged ions
- MS/MS to MS switch criteria: Total ion count (TIC) rising above 3,000
- MS/MS switch after 4.5 s
- MS/MS scan time 1.4 s, interscan time 0.1 s
- MS/MS cone voltage 35 V
- Use charge state recognition for collision energy as recommended by the manufacturer
Inject 2 μL of mucin peptide mixture. Repeat experiment two times; exclude peptides identified in previous runs with other samples.
3.5. Raw Data Analysis/Data Processing
-
Create *.pkl (peak list) files using Proteinlynx module of Masslynx 4.0 or 4.1.*.pkl files are suitable for the MS/MS ions database search via search engines, such as Mascot, Sequest, etc.
Use the following parameters for Proteinlynx:- Set the peptide QA filter 30 to eliminate poor-quality spectra,
- Subtract background with polynomial order 10 and below curve % 10.
- Set smoothing parameters to: Smooth ×2 with Savitzky Golay with smooth window 3.0.
- Set the minimum peak width at half height to 4 to eliminate background noise peaks.
- Take centroid spectra at 80% of the peak height.
3.6. Database Search
Submit your peak list file to online or in-house search engines for database search.
Search data against National Center for Biotechnology Information (NCBI) nonredundant (nr) and/or Swiss-Prot protein databases (use the newest version possible).
- Use following search parameters:
- Taxonomy: human (or the species you are working on)
- Use 0.2 Da mass accuracy for parent ions and 0.3 Da accuracy for fragment ions
- Allow one missed cleavage
- Use carbamidomethyl-Cys and methionine oxidation as fixed and variable modifications, respectively
Accept the matching peptide/protein if MASCOT probability-based Mowse individual ion score is above 40 indicating identity or extensive homology (p < 0.05).
Examine MS/MS spectra which have scores between 20 and 40 individually with the acceptance criteria being the parent and fragment ion masses were within the calibrated tolerance limits and that the spectrum contained an extended series of consecutive y- or b-ions.
Acknowledgments
This work was supported by National Heart, Lung, and Blood Institute/National Institutes of Health (NHLBI/NIH) grants HL103940 (MK) and HL084934 (JKS).
Footnotes
Mucins are very large, heavily glycosylated molecules. Electrophoretic separation and following gel-based proteomic applications of mucins or their subunits are not achievable by conventional 1D or 2D polyacrylamide gel electrophoresis since in their fully glycosylated and undegraded form they barely penetrate a 3% acrylamide gel. An agarose gel is the convenient electrophoretic methods to resolve and separate oligomeric mucins or their subunits. However, for technical reasons, recovering mucin from an agarose gel and following proteomic applications are also not feasible. This necessitated the shotgun approach to be adopted.
GuHCl is one of the most effective chaotropic agents for denaturing proteins and breaking noncovalent protein–protein interactions. In this work, employing 4M GuHCl, we deliberately disrupted noncovalent association between the mucins and other proteins. However, 200 mM NaCl or any other low-salt/nonchaotropic agent instead of GuHCl can be used to allow mucin–protein interactions to remain intact and subsequently allow us to identify mucin-interacting proteins.
Trypsin is the commonly used endoprotease for both gel- and shotgun-based peptide mapping and peptide-sequencing proteomic applications. It cleaves lysine and arginine residues at the C-terminal region that results in a charged amino acid in acidic environment.
Use modified trypsin (modification of lysine and arginine residues by reductive alkylation on the protein) to prevent autolysis of the enzyme.
Use silicon-coated microcentrifuge tubes to collect peptides to avoid peptide loss.
Proper degassing is crucial to get rid of dissolved air in the HPLC/UPLC solvents. Streaming helium bubbles into the buffers removes the dissolved air. Hook up a frit to a helium source and flow helium through the solvent with a fine stream of bubbles. Sonication is also an effective degassing method. However, sonication may heat up your mobile phase. In this case, evaporation might be an issue, especially for the mobile phase, which has a high percentage of ACN. If you are using sonication, take extra care against evaporation and cool down the mobile phases after the sonication before use.
Homemade MS/MS quality control standards: Prepare 1 nmol/L of either ADH or enolase in 50 mM NH4 HCO3. Add 10 μL of trypsin (100 ng/μL) and incubate for 16–18 h. Prepare 100-μL aliquots and store at −20°C for months.
Lowering the complexity of the proteins in the samples is essential for shotgun proteomics approaches. Therefore, to maximize the detection and coverage of mucin core proteins, separation of mucins from the globular proteins is necessary. See Chapter 2 for mucin isolation and separation.
Reduction is essential for breaking oligomeric mucins to their monomeric form and opening the cysteine-rich regions. This is crucial for a proper digestion and maximum protein coverage. We typically use 6M GuHCl reduction buffer and DTT for denaturing the mucin and its subsequent reduction. Using other denaturants or acid-labile surfactants (such as Rapigest and PPS Silent Surfactant) is not as effective as 6M GuHCl for mucin denaturation.
Urea is another potent chaotropic agent for lysing cells and solubilizing and denaturing proteins. However, most urea solutions may degrade to isocyanic acid which reacts with protein amino groups. This causes N-terminal carbamylation of the resultant peptides. To avoid this, always use fresh urea solutions and pretreat urea with an ion exchange resin to remove isocynic acid. If urea is used during sample preparation, include N-terminal carbamylation as a variable modification in the database search.
Using protease inhibitors: When mucins are stored in at least 4M GuHCl, there is no need for protease inhibitors. However, when mucins are stored below 2M GuHCl or any other nondenaturing buffers, protease inhibitors (e.g., Roche Complete mini) should be added according to manufacturer’s suggestion.
Keratin is one of the major contaminations in the lab environment. Use Clean Hood Benches, and wear gloves and head cap to avoid contamination.
In variable flow (peak parking) mode, when the DDA acquisition system detects an eligible precursor ion to do MS/MS, a signal is sent to the PP valve such that the mass spectrometry extends the analysis time on coeluting species by reducing the flow up to 20 nL/min, and thus prevented the elution of other peptides.
After injecting the 1 pmol of enolase or ADH digest, typically 35–45 total peptides should be identified with a total mascot score of 1,200–1,500. You should get at least 16–20 unique peptides identified and the coverage of the proteins around 60–65%. If the identified peptides are lower than 12 and coverage lower than 50%, troubleshoot HPLC/UPLC and/or MS system for potential source of sensitivity decrease.
References
- 1.Hovenberg HW, Davies JR, Carlstedt I. Different mucins are produced by the surface epithelium and the submucosa in human trachea: identification of MUC5AC as a major mucin from the goblet cells. Biochem J. 1996;318(Pt 1):319–324. doi: 10.1042/bj3180319. [DOI] [PMC free article] [PubMed] [Google Scholar]
- 2.Buisine MP, Desseyn JL, Porchet N, Degand P, Laine A, Aubert JP. Genomic organization of the 3 -region of the human MUC5AC mucin gene: additional evidence for a common ancestral gene for the 11p15.5 mucin gene family. Biochem J. 1998;332(Pt 3):729–738. doi: 10.1042/bj3320729. [DOI] [PMC free article] [PubMed] [Google Scholar]
- 3.Desseyn JL, Buisine MP, Porchet N, Aubert JP, Laine A. Genomic organization of the human mucin gene MUC5B. cDNA and genomic sequences upstream of the large central exon. J Biol Chem. 1998;273:30157–30164. doi: 10.1074/jbc.273.46.30157. [DOI] [PubMed] [Google Scholar]
- 4.Hattrup CL, Gendler SJ. Structure and function of the cell surface (tethered) mucins. Annu Rev Physiol. 2008;70:431–457. doi: 10.1146/annurev.physiol.70.113006.100659. [DOI] [PubMed] [Google Scholar]
- 5.Kesimer M, Kirkham S, Pickles RJ, Henderson AG, Alexis NE, Demaria G, Knight D, Thornton DJ, Sheehan JK. Tracheobronchial air-liquid interface cell culture: a model for innate mucosal defense of the upper airways? Am J Physiol Lung Cell Mol Physiol. 2009;296:L92–L100. doi: 10.1152/ajplung.90388.2008. [DOI] [PMC free article] [PubMed] [Google Scholar]
- 6.Nicholas B, Skipp P, Mould R, Rennard S, Davies DE, O’Connor CD, Djukanovic R. Shotgun proteomic analysis of human-induced sputum. Proteomics. 2006;6:4390–4401. doi: 10.1002/pmic.200600011. [DOI] [PubMed] [Google Scholar]
- 7.Utleg AG, Yi EC, Xie T, Shannon P, White JT, Goodlett DR, Hood L, Lin B. Proteomic analysis of human prostasomes. Prostate. 2003;56:150–161. doi: 10.1002/pros.10255. [DOI] [PubMed] [Google Scholar]
- 8.Wu CC, MacCoss MJ. Shotgun proteomics: tools for the analysis of complex biological systems. Curr Opin Mol Ther. 2002;4:242–250. [PubMed] [Google Scholar]
- 9.Lu B, Xu T, Park SK, McClatchy DB, Liao L, Yates JR., 3rd Shotgun protein identification and quantification by mass spectrometry in neuroproteomics. Methods Mol Biol. 2009;566:229–259. doi: 10.1007/978-1-59745-562-6_16. [DOI] [PubMed] [Google Scholar]
- 10.Link AJ. Multidimensional peptide separations in proteomics. Trends Biotechnol. 2002;20:S8–13. doi: 10.1016/s1471-1931(02)00202-1. [DOI] [PubMed] [Google Scholar]
- 11.Washburn MP, Ulaszek RR, Yates JR., 3rd Reproducibility of quantitative proteomic analyses of complex biological mixtures by multidimensional protein identification technology. Anal Chem. 2003;75:5054–5061. doi: 10.1021/ac034120b. [DOI] [PubMed] [Google Scholar]
- 12.Vissers JP, Blackburn RK, Moseley MA. A novel interface for variable flow nanoscale LC/MS/MS for improved proteome coverage. J Am Soc Mass Spectrom. 2002;13:760–771. doi: 10.1016/S1044-0305(02)00418-X. [DOI] [PubMed] [Google Scholar]
- 13.Thornton DJ, Carlstedt I, Howard M, Devine PL, Price MR, Sheehan JK. Respiratory mucins: identification of core proteins and glycoforms. Biochem J. 1996;316(Pt 3):967–975. doi: 10.1042/bj3160967. [DOI] [PMC free article] [PubMed] [Google Scholar]
- 14.Lohrig K, Wolters D. Multidimensional protein identification technology. Methods Mol Biol. 2009;564:143–153. doi: 10.1007/978-1-60761-157-8_8. [DOI] [PubMed] [Google Scholar]
- 15.Frohlich T, Arnold GJ. A newcomer’s guide to nano-liquid-chromatography of peptides. Methods Mol Biol. 2009;564:123–141. doi: 10.1007/978-1-60761-157-8_7. [DOI] [PubMed] [Google Scholar]