

Abstract
γ-Aminobutyric acid type A receptors (GABAARs) are the major sites of fast synaptic inhibition in the brain. An essential determinant for the efficacy of synaptic inhibition is the regulation of GABAAR cell surface stability. Here, we have examined the regulation of GABAAR endocytic sorting, a critical regulator of cell surface receptor number. In neurons, rapid constitutive endocytosis of GABAARs was evident. Internalized receptors were then either rapidly recycled back to the cell surface, or on a slower time scale, targeted for lysosomal degradation. This sorting decision was regulated by a direct interaction of GABAARs with Huntingtin-associated protein 1 (HAP1). HAP1 modulated synaptic GABAAR number by inhibiting receptor degradation and facilitating receptor recycling. Together these observations have identified a role for HAP1 in regulating GABAAR sorting, suggesting an important role for this protein in the construction and maintenance of inhibitory synapses.
Gamma-aminobutyric acid type A receptors (GABAARs) are critical regulators of neuronal excitability as they represent the major sites of fast synaptic inhibition in the brain (1, 2). GABAARs are hetero-pentameric, chloride-selective, ligandgated ion channels, which can be constructed from seven subunit classes: α 1-6, β 1-3, γ 1-3, δ, ε, π, and θ (1, 2). It is widely believed that most benzodiazepine-sensitive GABAAR subtypes in the brain are constructed from α, β, and γ2 subunits (1, 2). Central to the control of neuronal inhibition is the number of GABAARs that are expressed on the cell surface. It is evident that GABAARs are not static entities in neuronal plasma membranes but undergo rapid movement into and out of these structures (3). Modifications of GABAAR cell surface number underlie changes in inhibitory postsynaptic current amplitude, providing an effective mechanism for regulating the efficacy of synaptic inhibition (3-10). Under basal conditions, synaptic GABAARs are undergoing clathrin-dependent endocytosis (8, 10, 11). Given this constitutive endocytosis, the cellular fate of internalized GABAA receptors is critical as their recycling or degradation will affect the number of receptors on the cell surface, and hence the efficacy of synaptic inhibition.
Here, we have analyzed the endocytic sorting of GABAARs in neurons, revealing that over short time periods internalized GABAARs are rapidly recycled to the cell surface membrane, whereas over longer periods receptors are also targeted for lysosomal degradation. This sorting decision is regulated by a direct interaction with huntingtin-associated protein 1 (HAP1), a binding partner of huntingtin, the protein encoded by the Huntington's disease gene (12-14). HAP1 inhibits degradation of internalized GABAARs, facilitating receptor recycling and an increase in functional cell surface and synaptic receptor number. Therefore HAP1 may play a critical role in controlling fast synaptic inhibition by regulating the membrane trafficking of internalized GABAARs.
Materials and Methods
Yeast Two-Hybrid (Y2H) Screen. Using the intracellular domain of the GABAAR β1 subunit (amino acids 303-425) we screened a rat hippocampal library in pPC86 as described (15, 16).
Cell Culture, Transfection, and Immunofluorescence. Cultures of cortical and hippocampal neurons were prepared as described (8, 17-20). Nucleofection of cortical and hippocampal neurons (19) was carried out following the manufacturer's protocol (Amaxa, Gaithersburg, MD). Immunolocalization studies were carried out as described (8, 17), using guinea pig α-GABAAR γ2 subunit at 1:100 and α-HAP1 (1:100).
Affinity Purification Assays and Immunoprecipitation. GST fusion proteins constructs have been described (8, 17). 35S-labeled HAP1a or HAP1b were prepared by using a TNT Quick-Coupled Transcription/Translation System (Promega). Brain lysates were prepared as described and incubated with the antibodies of interest coupled to protein G-Sepharose. Precipitated material was then analyzed by immunoblotting (8, 17, 18).
Biotinylation Assays. Biotinylation assays to study GABAAR endocytosis, recycling, and degradation were carried out on cultured cortical neurons [5-8 days in vitro (DIV)] as described (20, 21) by using 1 mg/ml sulfo-NHS-biotin (Pierce) at 4°C. Protein levels were then measured by immunoblotting using [125I]-anti-rabbit polyclonal antibody quantitated with PhosphorImager spectrometry.
Electrophysiology and Peak-Scaled Nonstationary Noise Analysis. Miniature inhibitory postsynaptic currents (mIPSCs) were recorded from 14-DIV hippocampal neurons under whole-cell voltage-clamp conditions by using an Axopatch 200B (Axon Instruments, Union City, CA) as described (9). Statistical significance was established by using either Student's paired t test or Kolmogorov-Smirnov two-sample test, where P < 0.05 was significant. For peak-scaled nonstationary noise analysis at least 50 scaled average events were selected from suitable control (GFP-transfected) or HAP-transfected neurons. Cells were considered suitable for analysis if mIPSCs of different amplitude varied only in their absolute scaling; and if the mean amplitude, rise time, and decay times were consistently stable; and that amplitudes or rise times were not correlated with the hdecay times. The relationship between the resulting mean mIPSC and current variance was used to determine values for the number of active synaptic channels/receptors (N) and the mean single-channel current (i), according to the following equation (minianalysis version 8.0, Synaptosoft, Decatur, GA) based on binomial statistical principles: 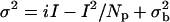 , where σ2 represents the current variance (pA2), i is the single-channel current, I is the mean mIPSC, Np is the mean number of channels open at the peak of the mIPSC, and
  is the holding current variance (baseline variance). The peak open probability (Po) was calculated from [Ipeak/(i Np)], where Ipeak is the average (nonscaled) peak mIPSC and I and Np are as defined. Statistical analysis was performed by using a one-tailed t test.
Results
GABAAR Endocytosis and Recycling in Neurons. To analyze the endocytic sorting of GABAARs we first examined basal levels of receptor internalization in cultured cortical neurons by using cell surface biotinylation with a reagent that is cleavable under reducing conditions (21), in the presence of leupeptin to prevent the possible degradation of internalized GABAARs in lysosomes. After biotinylation, neurons were incubated for differing time periods at 37°C to allow receptor endocytosis, after which remaining cell surface biotinylated receptors were cleaved at 4°C with reduced glutathione. Cells were then solubilized, and biotinylated proteins were purified on streptavidin and immunoblotted with antibodies against the GABAAR β3 subunit. Although cortical neurons express a range of GABAAR α, β, and γ subunits (2, 22), the β3 subunit is expressed at significantly higher levels than the other β subunits (18), and as all functional GABAAR subtypes contain β subunits, our method should reliably detect most subtypes expressed in these cells. Using this approach it was evident that GABAARs undergo significant endocytosis, reaching a steady state of 25.5 ± 3.5% (n = 8) after 30 min (Fig. 1 A and B). We also investigated the extent of GABAAR endocytosis in more mature (10-14 DIV) cultured neurons. We find that significant, although slightly reduced, levels of endocytosis occur after 30 min in these more mature neurons, 17 ± 5% (n = 5) (Fig 6A, which is published as supporting information on the PNAS web site).
Fig. 1.

Endocytosis and recycling of GABAARs in cortical neurons. (A) Analysis of receptor endocytosis in cortical neurons. Cortical neurons were surface biotnylated and incubated for 30 min at 4°C to inhibit membrane traffic (lanes 1 and 2) or 37°C to allow endocytosis (lane 3). Cells were treated with glutathione to cleave remaining cell surface biotin (lanes 2 and 3). Cells were then lysed, and biotinylated proteins were purified on beads immobilized to streptavidin, separated by SDS/PAGE followed by quantitative immunoblotting with anti-β3 antibody. Lane 1 represents total cell surface receptor levels, lane 2 represents background internalization at 4°C (control), and lane 3 represents protected biotinylated receptors internalized at 37°C for 30 min followed by cleavage with glutathione. Molecular markers in kDa are shown. (B) Time course of GABAAR endocytosis. Receptors internalized after various times at 37°C were compared to total surface receptor levels to quantify percent internalization (n = 4-7). (Inset) A representative Western blot. (C) Recycling of internalized GABAARs. (Inset) Representative Western blot of recycling time course. Cortical neurons were labeled with biotin and receptors were allowed to internalize for 30 min, before cleavage with glutathione (as in A and B). Neurons were then incubated at 37°C for further time periods (lanes 2-6, representing 0, 5, 15, 30, and 60 min, respectively) with glutathione in the external culture medium to cleave any internalized biotinylated receptors recycling to the cell surface. Internal β3-subunit levels remaining, as measured with anti-β3 antibody by Western blotting, were then compared to those at the start of the second incubation period with glutathione (lane 2, time = 0 min), designated as 100%. No loss of biotinylated β3 subunit (i.e., recycling) was observed if intracellular transport was blocked at 4°C (lane 7), or when neurons were incubated at 37°C in the absence of glutathione in the external media (lane 1). (D) Analysis of GABAAR degradation. Quantitation of GABAAR degradation (loss of biotinylated receptor represents degradation) expressed as the percent of total surface biotinylated GABAAR remaining at different incubation times (n = 3-5) in the presence (gray bar) or absence (black bar) of leupeptin (200 μg/ml) used to inhibit the proteolytic activity of lysosomes. * indicates significantly different (P < 0.05).
To test whether internalized receptors are returned to the plasma membrane for reinsertion, we performed recycling assays (21). Cortical neurons were labeled with biotin and receptors were allowed to internalize for 30 min (the period for maximal receptor internalization, Fig. 1B), before cleavage with glutathione (as in Fig. 1 A and B). Neurons were then incubated at 37°C for further time periods with glutathione in the external culture medium to cleave any internalized biotinylated receptors recycling to the cell surface. The loss of biotinylated internalized GABAARs after the second biotin cleavage provides a measure of receptor recycling (21). Internal β3-subunit levels remaining were then compared to those at the start of the second incubation period with glutathione, designated as 100%. Of this internalized pool, 30% were recycled back to the cell surface within 5 min and in excess of 70% were reinserted into the plasma membrane within 1 h (Fig. 1C). No loss of biotinylated β3 subunit (i.e., recycling) was observed if intracellular transport was blocked at 4°C or when neurons were incubated at 37°C in the absence of glutathione in the external media (Fig. 1C). Importantly, we could also detect significant recycling of endocytosed GABAARs in more mature (12-14 DIV), neuronal cultures (Fig. 6B). Together these observations provide evidence that, in neurons, a significant proportion of internalized GABAARs are rapidly recycled back to the plasma membrane for reinsertion.
We also analyzed the degradation of GABAARs by following the loss of the biotinylated GABAAR pool (20, 21). Virtually no GABAAR degradation could be detected within the first hour after surface biotinylation, but over longer periods (6 h) a significant proportion of receptors was degraded (28.8 ± 4.5%, n = 5; Fig. 1D). This effect was blocked by leupeptin (P < 0.05), demonstrating that degradation of internalized GABAARs largely occurs in lysosomes (Fig. 1D). Together our results suggest that endocytosed GABAARs can be sorted for two differing intracellular fates. During short intervals the majority of internalized GABAARs are able to rapidly recycle back to the cell surface, whereas over longer periods receptors are also subject to degradation.
GABAAR β Subunits Interact Specifically with HAP1. To identify proteins that regulate the endocytic sorting of GABAARs, we carried out a Y2H screen of a rat hippocampal library (15, 16), with a bait encoding the intracellular domain of the GABAAR β1 subunit, and identified several interacting clones that encoded the central domain of rat HAP1 (residues 220-520). This protein exists as two C-terminal splice variants, HAP1a and HAP1b, with molecular masses of 75 and 85 kDa, respectively. HAP1 bound to the β1-subunit intracellular domain, but not to the corresponding regions of the GABAAR α1, γ2, or δ subunits or to the intracellular carboxyl-terminal tail of the GABAB receptor R1 subunit (GABABR1; Fig. 2A). Interaction of full-length rat HAP1 with the intracellular domains of GABAAR subunits expressed as GST fusion proteins was also tested. HAP1a and HAP1b (data not shown) bound to the GABAAR β1-subunit intracellular domain but not to the cytoplasmic tail of the GABABR1 subunit or GST alone (Fig. 2B). We further probed the specificity of HAP1 binding by using COS cells expressing HAP1b or HAP1 a/b in brain extracts. This process revealed that only GABAAR β1-β3 subunits show a strong interaction with HAP1 (Fig. 2 C and D). Given that receptor β subunits are essential components for the functional expression of GABAARs (1, 2), our results suggest that HAP1 binding is expected to be a common property for most GABAAR subtypes.
Fig. 2.

Specific interaction of GABAAR β subunits with HAP1. (A) HAP1 interacts specifically with GABAAR β1 subunit in the Y2H system. Interaction between the HAP1 Y2H clone and various GABAAR subunit intracellular domains was assayed by Y2H and β-galactosidase assay. R1, GABABR1 subunit; +, positive interaction; -, no interaction detected; v, empty vector. (B) The direct binding of HAP1a with the intracellular domains of GABAAR β1 subunit was examined. The GABABR1 subunit C-terminal tail expressed as GST fusion protein (lane 2), the intracellular domain of the GABAAR β1 subunit (lane 3), or GST alone (lane 4) immobilized on glutathione agarose were exposed to 35S-methionine-radiolabeled HAP1a. Bound material was separated by SDS/PAGE and visualized by autoradiography. Lane 1 represents 25% of 35S-methionine-radiolabeled HAP1a used in pull-down assay. (C) Further analysis of HAP1 specificity was carried out with GST fusion protein pull-down assays from COS cell lysates expressing HAP1b (lane 1) with the intracellular domains of the GABAAR: α1 (lane 2), α3 (lane 3), α6 (lane 4), β1 (lane 5), β2 (lane 6), β3 (lane 7), γ2S (lane 8), δ (lane 9), and GABAC receptor ρ1 (lane 10) expressed as GST fusion proteins or GST alone (lane 11). HAP1b binding was then measured by immunoblotting. Lane 1 represents 25% of the input used for each experiment. (D) GST constructs encoding the intracellular domains of the GABAAR α1 (lane 2), β1 (lane 3), β2 (lane 4), β3 lane (lane 5), γ2S (lane 6), or GST alone (lane 7) were immobilized on glutathione agarose and incubated with solubilized brain extracts. Bound material was resolved by SDS/PAGE and analyzed by Western blotting with antibodies to HAP1a and HAP1b. Lane 1 represents 25% of the material used in each experiment. (E) Solubilized brain homogenates were subjected to immunoprecipitation with anti-GABAAR antibodies to the β1 and β3 subunits (lane 2) or control IgG (lane 3). Immunoprecipitates were immunoblotted with mouse HAP1a/b antibody. Lane 1 represents 10% of the input used in each experiment. (F) Solubilized brain extracts were immunoprecipitated with antibodies against HAP1 (lane 2) or control IgG (lane 3). Precipitated material was then immunoblotted with antibodies against HAP1 or the GABAAR β2 and β3 subunits as indicated. Lane 1 represents 10% of the input. (G) Colocalization of HAP1 with GABAARs. Hippocampal neurons (21 DIV) were immunostained for the receptor γ2 subunit (1) and HAP1 (2). A merged image is shown in 3. Arrows identify colocalized clusters of HAP1 and GABAARs in the soma and dendritic shafts of hippocampal pyramidal neurons. The data are single 0.5-μm optical sections. (Scale bar: 20 μm.)
We also tested the interaction of HAP1 with GABAARs via immunoprecipitation. Using antibodies against the β1/3 subunits (18), it was evident that HAP1 coimmunoprecipitated with GABAARs from brain lysates (Fig. 2E). In addition, solubilized brain extracts were immunoprecipitated with antibodies against HAP1, and precipitated material was then immunoblotted with antibodies against HAP1 or the GABAAR β subunits (Fig. 2F). GABAARs were detected by coimmunoprecipitating with HAP1 antibodies, but not with control IgG (Fig. 2F).
The subcellular distribution of HAP1 and GABAARs in cultured hippocampal neurons was investigated by using immunoflorescence and confocal microscopy. We used antibodies against the γ2 subunit in these experiments as the majority of synaptic receptors contain this subunit isoform in cultured hippocampal neurons (17). HAP1 exhibited clusters in the dendrites and axons, in addition to substantial intracellular somatic staining, including large perinuclear structures consistent with the localization of this protein to intracellular compartments such as endosomes and tubulovesicular structures (Fig. 2G), as demonstrated (23-26). The GABAAR γ2 subunit appeared as membrane clusters in addition to abundant intracellular aggregates (Fig. 2G). Significantly, a proportion of HAP1 staining was found to colocalize with GABAAR staining (Fig. 2G).
HAP1 Regulates the Intracellular Fate of GABAARs. GABAARs undergo clathrin-mediated endocytosis and can be detected in endocytic structures (1, 8, 10, 11, 27). HAP1 has been localized to clathrin-coated vesicles and the endocytic pathway (23-26) and has been implicated in endocytic protein trafficking (26), suggesting that HAP1 may be involved in the endocytic sorting of GABAARs. To further examine the effects of HAP1 on the endocytic sorting of GABAARs, cultured cortical neurons were nucleofected with a HAP1 cDNA to modify HAP1 expression levels. Nucleofection produces an average transfection efficiency of 48.8 ± 7.5% (n = 750 cells in three differing cultures; Fig. 6C), and we were able to routinely detect hemagglutinin (HA)-tagged HAP1a (HA-HAP1a) or GFP by Western blotting lysates of nucleofected neurons (Fig. 3A). We then examined the fate of internalized GABAARs by using the biotinylation-degradation assay (refer to Fig. 1D) on nucleofected or control neurons. Surface receptors were labeled with biotin and their fate was examined after 6 h at 37°C in the absence of leupeptin. In mock-nucleofected neurons, we detected the degradation of up to 25.2 ± 4.5% (n = 7) of internalized receptors within 6 h at 37°C, similar to results seen in untreated neurons (Fig. 3B and see also Fig. 1D) and GFP-nucleofected neurons (29 ± 8.0%, Fig. 6D). In contrast, in neurons nucleofected with HA-HAP1a, the degradation of internalized GABAARs was significantly decreased to 5 ± 8.0% (P < 0.05, n = 6) over the same period (Fig. 3B). We also assessed whether HAP1 regulates receptor recycling (as in Fig. 1C). Cortical neurons expressing HA-HAP1a showed a significant increase in GABAAR recycling levels at 30 and 60 min compared to GFP controls (Fig. 3D).
Fig. 3.

Recycling and degradation of GABAARs in cortical neurons is modulated by HAP1. (A) Representative Western blot of lysates from cortical neurons nucleofected with GFP or HA-HAP1a showing efficient expression of exogenous cDNAs (arrow) in neurons by nucleofection. Using antibody against the HA epitope a nonspecific band was also detected. Molecular markers in kDa are shown. (B) Biotinylation assays of receptor degradation were performed (as in Fig. 1D) in cortical neurons either mock-nucleofected or nucleofected with HA-HAP1a. Quantitation of GABAAR degradation is expressed as the percent of the total surface biotinylated GABAAR pool at time 0 remaining after 6 h. Expression of HA-HAP1a in neurons produced a significant decrease in GABAAR degradation compared to mock-nucleofected neurons as indicated by * (P < 0.05, n = 7). Control data represent receptor degradation in nonnucleofected neurons (from Fig. 1D). (C) Recycling of internalized GABAARs is modulated by overexpressing HAP1 in cortical neurons. Biotinylation assays of GABAAR recycling (for 30 or 60 min after a 30-min endocytosis period) were performed (as in Fig. 1C) on cortical neurons nucleofected with either GFP or HA-HAP1a. The loss of biotinylated GABAARs after a second biotin cleavage provides a measure of receptor recycling. Data for GABAAR recycling of nonnucleofected neurons at 30- and 60-min time points (from Fig. 1C) are presented as the control column. Expression of HA-HAP1a in neurons produced a significant increase in GABAAR recycling compared to GFP-nucleofected neurons as indicated by * (P < 0.05, n = 7).
Functional Consequences of HAP1 Expression in Transfected Neurons. It is evident from our studies that HAP1 can modify GABAAR membrane trafficking, enhancing the stability of internalized receptors and facilitating their recycling to the plasma membrane. To examine whether these effects of HAP1 on GABAAR membrane trafficking were reflected in the efficacy of synaptic inhibition, mIPSCs were recorded from hippocampal neurons nucleofected with either GFP alone or GFP and HA-HAP1a. The expression of HA-HAP1a caused a significant 63% increase in the mIPSC mean amplitude compared to the GFP control-expressing neurons [GFP control: 63.6 ± 4.9 pA (n = 7) and HAP1a: 103.7 ± 17.4 pA (n = 7), P < 0.05; Fig. 4A]. Binned amplitude (Fig. 4B) and cumulative probability plots (Fig. 4C) revealed a shift to higher amplitudes in the general mIPSC distribution from recordings of HA-HAP1a-nucleofected neurons. No differences were observed in the frequency of mIPSC events for neurons nucleofected with HA-HAP1a (Fig. 4D). Furthermore, the kinetic parameters of the mIPSCs were also unaffected by HA-HAP1a expression as assessed by measuring the 10-90% rise time and the 90-37% decay time of individual mIPSCs (Fig. 4E). Overall, these results are consistent with HAP1 exerting a postsynaptic effect on GABAARs.
Fig. 4.

mIPSC amplitudes are increased upon expression of HAP-1a protein. (A) Bar graph of the mean mIPSC amplitudes representing GFP (hatched bar) or GFP+HA-HAP1a (open bar) cDNA-transfected hippocampal neurons. Data (mean ± SE) are pooled from seven cells for each condition on 14-DIV hippocampal neuronal cultures. * indicates significance (P < 0.05). (B) Peak amplitude binned data plots for mIPSCs recorded from neurons expressing GFP (solid line) or GFP+HAP-1a (open bars). Note that the distribution for the mIPSCs recorded from HA-HAP1a neurons are shifted to higher amplitudes relative to neurons expressing GFP alone. (C) Cumulative probability data for mIPSC amplitudes demonstrating the significant amplitude shift between GFP-transfected (filled symbols) and GFP+HAP-1a-transfected (open symbols) neurons (P < 0.001). (D) Bar graph of the mean mIPSC frequencies recorded from neurons expressing GFP (n = 8) or GFP+HA-HAP-1a (n = 12) from five independent cultures. The frequency measurements were made over 14 min of consecutive recording from each transfected cell. (E) The presence of HA-HAP-1a protein (open bar) did not affect the kinetic profile of the mIPSCs as both rise (10-90%) and decay (90-37%) times (msec) were not significantly different from GFP (hatched bar) controls [P = 0.12 (rise, n = 9) and 0.18 (decay, n = 13)]. (Inset) Scaled average mIPSC profiles (from 50 mIPSCs) for GFP-transfected (left trace) and HA-HAP-1a-transfected (right trace) cells.
HAP1 Increases GABAAR Cell Surface Number. The potentiated mIPSC amplitudes could arise from a variety of mechanisms, including an increase in receptor number, a higher single-channel current/conductance, or an increase in the open-channel probability. To address these issues we first examined whether expression of HAP1 also increases GABAAR cell surface expression levels, which would be predicted given the effects of this protein on receptor recycling and degradation (Fig. 3). Using biotinylation, the cell surface levels of GABAARs in cortical neurons expressing HA-HAP1a were compared to controls expressing GFP, which were given a value of 100%. HA-HAP1a produced a statistically significant increase of 145 ± 11% of control (P < 0.05, n = 9) in the cell surface number of GABAARs containing β3 subunits (Fig. 5A). As a control we also examined the effects of HA-HAP1a expression on the cell surface levels of GABABRs, which we have established do not interact with HAP1 (Fig. 2 A and B) and the transferin receptor (TfR), which undergoes significant endocytosis. Cell surface levels of GABAB receptors containing the GABABR1 subunits were unaffected by HA-HAP1a expression (100.3 ± 17% of control, n = 5) as were levels of the TfR (88 ± 4%, P = 0.1, n = 3). Finally, we also establish that α-amino-3-hydroxy-5-methyl-4-isoxazolepropionic acid receptor (AMPAR) levels are also unaffected by HA-HAP1a expression (105 ± 17% control, n = 3) (by GST pull-down assays we were also unable to detect binding of HAP1 to an AMPAR subunit intracellular domain, Fig. 6E).
Fig. 5.

HAP1 controls GABAAR cell surface and synaptic number. (A) Control cortical neurons expressing GFP (-) or neurons expressing HA-HAP1a (+) were biotinylated. Cells were then lysed, and cell surface biotinylated receptor populations were purified on beads immobilized to streptavidin, separated by SDS/PAGE, followed by quantitative immunoblotting with antibodies against the GABAAR β3 subunit (β3), the GABABR1 subunit (R1), the TfR, and the α-amino-3-hydroxy-5-methyl-4-isoxazolepropionic acid receptor GluR1 subunit (GluR1) (Upper). Cell surface receptor levels for control (open bar) and HA-HAP1a-expressing neurons (filled bar) were then compared for each of these proteins. * indicates significantly different from control (P < 0.05, n = 5-9). The number of GABAARs in neurons expressing HA-HAP1a was enhanced to 145 ± 11% of control (P < 0.05, n = 9). (B) Nonstationary noise analysis of mIPSCs. Current-variance relationships for two example neurons (14 DIV) transfected either with GFP (•) or HAP1 cDNAs (○). Solid lines depict the theoretical fits generated by the equation in Materials and Methods. (C) Bar graph showing the relative numbers of synaptic GABAARs that are activated at the peak of an average mIPSC event in either control GFP-transfected (hatched bar) or HAP1-transfected (open bar) hippocampal neurons (14 DIV, n = 4 individual experiments, P < 0.05). Also shown are the relative sizes of single channel currents (pA) and the probability of channel opening (Popen).
To further understand the mechanism underlying the enhancement of mIPSC amplitudes by HA-HAP1a, peak-scaled nonstationary noise analysis (28, 29) was applied to the inhibitory synaptic currents. Of the cells that fulfilled the selection criteria for noise analysis (see Materials and Methods), HA-HAP1a-transfected hippocampal neurons consistently demonstrated increases in mean current and current variance relative to GFP-transfected controls (Fig. 5B). The average number of channels for control cells was 54.3 ± 5.1, whereas in HA-HAP1a-transfected neurons this figure increased to 77.4 ± 8.2 (Fig. 5C, P < 0.05 in a one-tailed t test, n = 4, individual experiments for each). The single-channel currents for the synaptic receptors were 2.26 ± 0.17 pA (control) and 1.99 ± 0.15 pA (+HAP1a), which were not significantly different (P > 0.05). In addition, the probability of channel opening, calculated from nonscaled mIPSCs, was unaffected by HA-HAP1a expression (control 0.94 ± 0.02; HAP1a 0.96 ± 0.01; n = 4, individual experiments for each). Together these experiments demonstrate an increase in the number of active cell surface and synaptic GABAARs in neurons expressing HA-HAP1a is responsible for the increased synaptic efficacy. This finding suggests a critical role for this protein in controlling GABAAR endocytic sorting, and therefore cell surface stability.
Discussion
GABAARs are critical mediators of synaptic inhibition, and thus it is of fundamental importance to understand the cellular mechanisms used by neurons to control receptor cell surface stability. Here we establish that constitutive endocytosis results in the removal of ≈25% of the total cell surface GABAAR population within 30 min in cultured neurons, with the majority of internalized GABAARs being rapidly recycled back to the plasma membrane. In addition, we reveal that GABAARs undergo lysosomal degradation. This process occurs over slower time scales, with in excess of 25% of surface GABAARs being degraded within 6 h. Clearly the balance between these differing potential fates of internalized GABAARs may have profound effects on total receptor cell surface number and neuronal inhibition.
To identify proteins that modulate the postendocytic sorting of GABAARs we used a Y2H screen to search for novel receptor binding partners and identified an interaction between the intracellular domain of GABAAR β subunits and HAP1. A role for HAP1 in endocytic protein sorting and/or membrane transport has been suggested (23-26, 30, 31). In agreement with this notion, we found that increasing HAP1 expression levels increased the steady-state receptor cell surface number by inhibiting receptor degradation and enhancing receptor recycling. This effect increased only the amplitude of mIPSCs in accord with a postsynaptic site of action. Importantly, nonstationary noise analysis revealed that HAP1 mediated an increase in synaptic receptor number without any effects on single-channel conductance or open probability. Together our results suggest a mechanism for modulating the efficacy of inhibitory synaptic transmission, dependent on HAP1.
The precise mechanism underlying HAP1's effect on GABAAR membrane trafficking remains to be elucidated, as it is unknown whether HAP1 overexpression results in enhancement of an endogenous mechanism to facilitate recycling, or by inhibiting an existing pathway for degradation. Future studies using loss-of-function approaches should help clarify this issue. Previous studies have shown that HAP1 associates with proteins that participate in vesicular membrane trafficking, including p150glued, a component of the dynactin complex, essential for the activity of the microtubule motor protein dynein and Hrs early endosomal phosphoprotein involved in the sorting of ubiquitinated membrane proteins (26, 30-32). Therefore it is tempting to speculate that HAP1 regulates GABAAR endocytic sorting by facilitating interactions with microtubule motors such as dynein or kinesin (30, 31, 33, 34).
Given that HAP1 activity is modified by mutant huntingtin (14, 35), it will also be of interest to determine whether HAP1 modulation of GABAAR trafficking is implicated in the etiology of Huntington's disease (HD). Interestingly, in a mouse model of HD, symptomatic mice have a greater propensity to develop seizures, and in infants with HD, the symptomology almost invariably includes epileptic seizures (36, 37). Increased neuronal excitability caused by disrupted GABAAR trafficking could potentially exacerbate the enhanced N-methyl-d-aspartate receptor-mediated neuronal excitotoxicity caused by mutant huntingtin (38).
In summary, we have demonstrated two distinct fates for endocytosed GABAARs, recycling back to the plasma membrane for reinsertion or lysosomal degradation. HAP1 plays a key role in these processes as it directly binds to GABAARs, preventing their degradation, and thereby enhancing receptor recycling to the plasma membrane. Therefore, HAP1 may have profound effects on neuronal excitability via its ability to modulate the membrane trafficking of GABAARs.
Supplementary Material
Acknowledgments
We thank X.-J. Li (Emory University, Atlanta) for the HAP1 expression constructs, P. Worley (The Johns Hopkins University, Baltimore) for the pPC86 Y2H library, and J. M. Fritschy (University of Zurich, Zurich) for the γ2 antibody.
This paper was submitted directly (Track II) to the PNAS office.
Abbreviations: GABAAR, γ-aminobutyric acid type A receptor; GABABR1, GABA type B receptor subunit 1; mIPSC, miniature inhibitory postsynaptic current; HAP1, huntingtin-associated protein 1; HA, hemagglutinin; TfR, transferin receptor; DIV, days in vitro; Y2H, yeast two-hybrid.
References
- 1.Moss, S. J. & Smart, T. G. (2001) Nat. Rev. Neurosci. 2, 240-250. [DOI] [PubMed] [Google Scholar]
- 2.Sieghart, W. & Sperk, G. (2002) Curr. Top. Med. Chem. 2, 795-816. [DOI] [PubMed] [Google Scholar]
- 3.Kittler, J. T. & Moss, S. J. (2001) Traffic 2, 437-448. [DOI] [PubMed] [Google Scholar]
- 4.Nusser, Z., Hajos, N., Somogyi, P. & Mody, I. (1998) Nature 395, 172-177. [DOI] [PubMed] [Google Scholar]
- 5.Nusser, Z., Cull-Candy, S. & Farrant, M. (1997) Neuron 19, 697-709. [DOI] [PubMed] [Google Scholar]
- 6.Wan, Q., Xiong, Z. G., Man, H. Y., Ackerley, C. A., Braunton, J., Lu, W. Y., Becker, L. E., MacDonald, J. F. & Wang, Y. T. (1997) Nature 388, 686-690. [DOI] [PubMed] [Google Scholar]
- 7.Brunig, I., Penschuck, S., Berninger, B., Benson, J. & Fritschy, J. M. (2001) Eur. J. Neurosci. 13, 1320-1328. [DOI] [PubMed] [Google Scholar]
- 8.Kittler, J. T., Delmas, P., Jovanovic, J. N., Brown, D. A., Smart, T. G. & Moss, S. J. (2000) J. Neurosci. 20, 7972-7977. [DOI] [PMC free article] [PubMed] [Google Scholar]
- 9.Jovanovic, J. N., Thomas, P., Kittler, J. T., Smart, T. G. & Moss, S. J. (2004) J. Neurosci. 24, 522-530. [DOI] [PMC free article] [PubMed] [Google Scholar]
- 10.Kittler, J. T. & Moss, S. J. (2003) Curr. Opin. Neurobiol. 13, 1-7. [DOI] [PubMed] [Google Scholar]
- 11.Herring, D., Huang, R., Singh, M., Robinson, L. C., Dillon, G. H. & Leidenheimer, N. J. (2003) J. Biol. Chem. 278, 24046-24052. [DOI] [PubMed] [Google Scholar]
- 12.The Huntington's Disease Collaborative Research Group (1993) Cell 72, 971-983. [DOI] [PubMed] [Google Scholar]
- 13.Duyao, M., Ambrose, C., Myers, R., Novelletto, A., Persichetti, F., Frontali, M., Folstein, S., Ross, C., Franz, M., Abbott, M., et al. (1993) Nat. Genet. 4, 387-392. [DOI] [PubMed] [Google Scholar]
- 14.Li, X. J., Li, S. H., Sharp, A. H., Nucifora, F. C., Jr., Schilling, G., Lanahan, A., Worley, P., Snyder, S. H. & Ross, C. A. (1995) Nature 378, 398-402. [DOI] [PubMed] [Google Scholar]
- 15.Bedford, F. K., Kittler, J. T., Muller, E., Thomas, P., Uren, J. M., Merlo, D., Wisden, W., Triller, A., Smart, T. G. & Moss, S. J. (2001) Nat. Neurosci. 4, 908-916. [DOI] [PubMed] [Google Scholar]
- 16.Couve, A., Kittler, J. T., Uren, J. M., Calver, A. R., Pangalos, M. N., Walsh, F. S. & Moss, S. J. (2001) Mol. Cell. Neurosci. 17, 317-328. [DOI] [PubMed] [Google Scholar]
- 17.Kittler, J. T., Rostaing, P., Schiavo, G., Fritschy, J. M., Olsen, R., Triller, A. & Moss, S. J. (2001) Mol. Cell. Neurosci. 18, 13-25. [DOI] [PubMed] [Google Scholar]
- 18.Brandon, N. J., Delmas, P., Kittler, J. T., McDonald, B. J., Sieghart, W., Brown, D. A., Smart, T. G. & Moss, S. J. (2000) J. Biol. Chem. 275, 38856-38862. [DOI] [PubMed] [Google Scholar]
- 19.Couve, A., Restituito, S., Brandon, J. M., Charles, K. J., Bawagan, H., Freeman, K. B., Pangalos, M. N., Calver, A. R. & Moss, S. J. (2004) J. Biol. Chem. 279, 13934-13943. [DOI] [PubMed] [Google Scholar]
- 20.Fairfax, B. P., Pitcher, J. A., Scott, M. G., Calver, A. R., Pangalos, M. N., Moss, S. J. & Couve, A. (2004) J. Biol. Chem. 279, 12565-12573. [DOI] [PubMed] [Google Scholar]
- 21.Ehlers, M. D. (2000) Neuron 28, 511-525. [DOI] [PubMed] [Google Scholar]
- 22.Pirker, S., Schwarzer, C., Wieselthaler, A., Sieghart, W. & Sperk, G. (2000) Neuroscience 101, 815-850. [DOI] [PubMed] [Google Scholar]
- 23.Gutekunst, C. A., Li, S. H., Yi, H., Ferrante, R. J., Li, X. J. & Hersch, S. M. (1998) J. Neurosci. 18, 7674-7686. [DOI] [PMC free article] [PubMed] [Google Scholar]
- 24.Martin, E. J., Kim, M., Velier, J., Snapp, E., Lee, H. S., Laforet, G., Won, L., Chase, K., Bhide, P. G., Heller, A., et al. (1999) J. Comp. Neurol. 403, 421-430. [PubMed] [Google Scholar]
- 25.Waelter, S., Scherzinger, E., Hasenbank, R., Nordhoff, E., Lurz, R., Goehler, H., Gauss, C., Sathasivan, K., Bates, G. P., Lehrach, H. & Wanker, E. E. (2001) Hum. Mol. Genet. 10, 1807-1817. [DOI] [PubMed] [Google Scholar]
- 26.Li, Y., Chin, L. S., Levey, A. I. & Li, L. (2002) J. Biol. Chem. 277, 28212-28221. [DOI] [PubMed] [Google Scholar]
- 27.Connolly, C. N., Kittler, J. T., Thomas, P., Uren, J. M., Brandon, N. J., Smart, T. G. & Moss, S. J. (1999) J. Biol. Chem. 274, 36565-36572. [DOI] [PubMed] [Google Scholar]
- 28.De Koninck, Y. & Mody, I. (1994) J. Neurophysiol. 71, 1318-1335. [DOI] [PubMed] [Google Scholar]
- 29.Traynelis, S. F., Silver, R. A. & Cull-Candy, S. G. (1993) Neuron 11, 279-289. [DOI] [PubMed] [Google Scholar]
- 30.Engelender, S., Sharp, A. H., Colomer, V., Tokito, M. K., Lanahan, A., Worley, P. & Ross, C. A. (1997) Hum. Mol. Genet. 6, 2205-2212. [DOI] [PubMed] [Google Scholar]
- 31.Li, S. H., Gutekunst, C. A., Hersch, S. M. & Li, X. J. (1998) J. Neurosci. 18, 1261-1269. [DOI] [PMC free article] [PubMed] [Google Scholar]
- 32.Raiborg, C., Bache, K. G., Gillooly, D. J., Madshus, I. H., Stang, E. & Stenmark, H. (2002) Nat. Cell. Biol. 4, 394-398. [DOI] [PubMed] [Google Scholar]
- 33.Setou, M., Nakagawa, T., Seog, D. & Hirokawa, N. (2000) Science 288, 1796-1802. [DOI] [PubMed] [Google Scholar]
- 34.Deacon, S. W., Serpinskaya, A. W., Vaughan, P. S., Lopez-Fanarraga, M., Vernos, I., Vaughan, K. T. & Gelfand, V. I. (2003) J. Cell Biol. 160, 297-301. [DOI] [PMC free article] [PubMed] [Google Scholar]
- 35.Li, H., Wyman, T., Yu, Z. X., Li, S. H. & Li, X. J. (2003) Hum. Mol. Genet. 12, 2021-2030. [DOI] [PubMed] [Google Scholar]
- 36.Harper, P. S. (2000) Huntington's Disease (Saunders, London), 22nd Ed.
- 37.Mangiarini, L., Sathasivam, K., Seller, M., Cozens, B., Harper, A., Hetherington, C., Lawton, M., Trottier, Y., Lehrach, H., Davies, S. W. & Bates, G. P. (1996) Cell 87, 493-506. [DOI] [PubMed] [Google Scholar]
- 38.Zeron, M. M., Hansson, O., Chen, N., Wellington, C. L., Leavitt, B. R., Brundin, P., Hayden, M. R. & Raymond, L. A. (2002) Neuron 33, 849-860. [DOI] [PubMed] [Google Scholar]
Associated Data
This section collects any data citations, data availability statements, or supplementary materials included in this article.