Abstract
Purpose
To determine whether cone density, spacing, or regularity in eyes with and without diabetes (DM) as assessed by high-resolution adaptive optics scanning laser ophthalmoscopy (AOSLO) correlates with presence of diabetes, diabetic retinopathy (DR) severity, or presence of diabetic macular edema (DME).
Methods
Participants with type 1 or 2 DM and healthy controls underwent AOSLO imaging of four macular regions. Cone assessment was performed by independent graders for cone density, packing factor (PF), nearest neighbor distance (NND), and Voronoi tile area (VTA). Regularity indices (mean/SD) of NND (RI-NND) and VTA (RI-VTA) were calculated.
Results
Fifty-three eyes (53 subjects) were assessed. Mean ± SD age was 44 ± 12 years; 81% had DM (duration: 22 ± 13 years; glycated hemoglobin [HbA1c]: 8.0 ± 1.7%; DM type 1: 72%). No significant relationship was found between DM, HbA1c, or DR severity and cone density or spacing parameters. However, decreased regularity of cone arrangement in the macular quadrants was correlated with presence of DM (RI-NND: P = 0.04; RI-VTA: P = 0.04), increasing DR severity (RI-NND: P = 0.04), and presence of DME (RI-VTA: P = 0.04). Eyes with DME were associated with decreased density (P = 0.04), PF (P = 0.03), and RI-VTA (0.04).
Conclusions
Although absolute cone density and spacing don't appear to change substantially in DM, decreased regularity of the cone arrangement is consistently associated with the presence of DM, increasing DR severity, and DME. Future AOSLO evaluation of cone regularity is warranted to determine whether these changes are correlated with, or predict, anatomic or functional deficits in patients with DM.
Keywords: diabetic retinopathy, adaptive optics scanning laser ophthalmoscopy, cones, photoreceptor morphology
Although diabetic retinopathy (DR) is clinically characterized by the severity and extent of visible microvascular changes,1 there is evidence of abnormal neuroretinal function even before development of these hallmark vascular lesions. Thus, an improved understanding of how neural retinal structure changes in association with diabetic vascular pathology could provide insight into early visual impairment in the diabetic eye and possibly elucidate mechanisms to target for visual preservation. In addition, if neural pathology is found to be reliably associated with diabetic retinal vascular disease, retinal imaging might provide surrogate or predictive biomarkers of DR.
Multiple structural and functional studies have revealed early perturbations in the diabetic retina. Early histopathology papers were the first to suggest evidence for loss of neuronal cell bodies in eyes of patients with diabetes.2,3 More recent studies utilizing spectral-domain optical coherence tomographic (SDOCT) cross-sectional imaging of individual retinal layers4–7 confirm thinning of the inner retinal layers, both early in the course of diabetes and with increasing duration of type 1 diabetes.8 Impaired neuroretinal function has also been described in eyes of diabetic patients. Defects in color vision9–11 and contrast sensitivity12 as well as electrophysiological abnormalities13–15 present in the diabetic eye suggest dysfunction of retinal neural cells. Recent multifocal ERG studies reveal functional loss in diabetic eyes even before the development of clinically apparent DR.16–19
A complete understanding of whether there are structural changes in macular cone photoreceptors in diabetes has been previously limited by an inability to directly visualize cones in the living human eye. However, using the high-resolution imaging modality of adaptive optics scanning laser ophthalmoscopy (AOSLO), structural characterization of the human retinal cones in vivo has now become feasible. Adaptive optics SLO corrects >90% of an individual eye's optical aberrations based on wavefront sensing and compensation and enables visualization of retinal structures with a lateral resolution limit down to 2 μm.20–22 Adaptive optics imaging studies have demonstrated substantial loss of cones in eyes with different nondiabetic pathologies.23–29 Recently, a small study of 11 individuals with type 1 diabetes and no DR or mild nonproliferative DR reported a decrease in cone density in diabetic eyes as compared to nondiabetic controls utilizing a flood illumination adaptive optics camera rather than SLO.30 However, variations in cone density were not explored across individuals with a wide variation in diabetes duration, nor across eyes with more severe levels of DR or any diabetic macular edema (DME). In addition, aspects of cone arrangement such as regularity, packing factor (PF), and nearest neighbor distances were not explored in that study.
In this study, we utilized AOSLO to determine multiple cone density and distribution parameters in eyes with a wide range of DR and DME severity, from participants with type 1 and 2 diabetes across a wide range of age and diabetes duration. In addition to standard measurements of density, we explored multiple cone distribution parameters including regularity indices of the cone mosaic.
Materials and Methods
All investigations adhered to the tenets of the Declaration of Helsinki, and the study was approved by the institutional review board of the Joslin Diabetes Center. Written informed consent was obtained from each study participant before any study procedures were performed.
Participants
For this cross-sectional study, 53 eyes from 53 participants were imaged at the Beetham Eye Institute of the Joslin Diabetes Center between November 2011 and February 2013. Patients were recruited during regularly scheduled retinal clinic appointments and were enrolled into the study if they met the following inclusion criteria: age ≥ 18 years, no diabetes or diagnosis of type 1 or type 2 diabetes mellitus, no substantial media opacities to preclude good image quality, and stable central fixation. Individuals with macular pathology attributable to other than diabetic disease were excluded from participation.
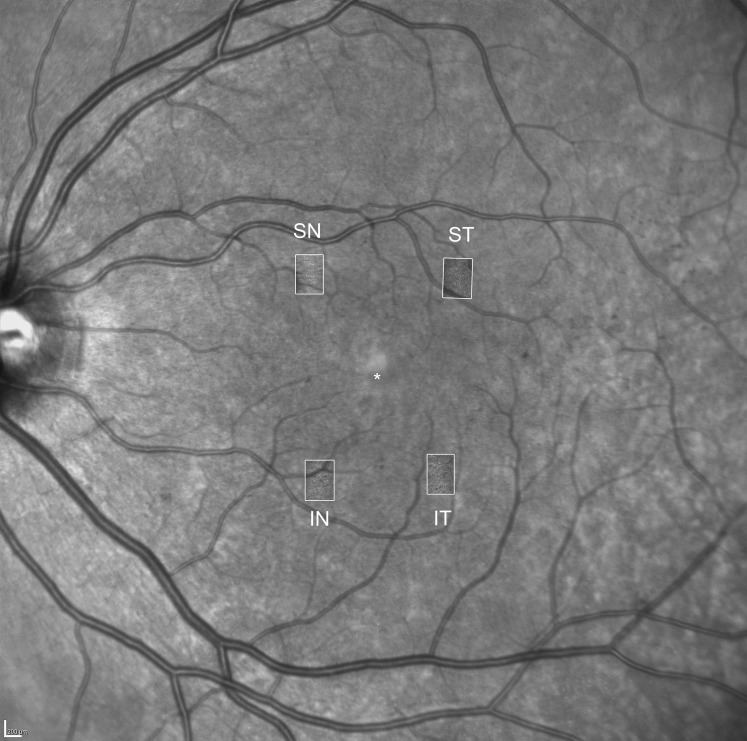
All participants received a comprehensive ophthalmic examination, including refraction, measurement of Early Treatment Diabetic Retinopathy Study (ETDRS) best-corrected visual acuity (VA), dilated fundus examination, modified seven-field color fundus photography (Carl Zeiss Meditec, Inc., Dublin, CA, USA), infrared (IR) imaging and OCT raster scanning of the macula (Spectralis OCT; Heidelberg Engineering, Heidelberg, Germany; OCT scanning pattern: 20° × 20° field centered at the fovea, 49 B-scans, 16 frames averaged, high resolution). Adaptive optics SLO (Boston Micromachines, Cambridge, MA, USA) was utilized for ultrahigh-resolution imaging centered on the following macular regions of interest (ROIs): the superior–nasal (SN), superior–temporal (ST), inferior–nasal (IN), and inferior–temporal (IT) quadrants (Fig. 1). To convert angular to metric coordinates (Supplementary Table S1), each study eye's axial length was measured using an IOL master (Carl Zeiss Meditec, Inc.). All imaging was performed after pupillary dilation. Early Treatment Diabetic Retinopathy Study DR and DME severity level for each eye was graded on color fundus photographs and OCT images by a grader masked to the AOSLO results.31
Figure 1.
Overlay of a wide-field infrared image with macular AOSLO images. The white rectangles indicate the location of the four regions of interest for AOSLO imaging: superior-nasal (SN), superior-temporal (ST), inferior-temporal (IT), and inferior-nasal (IN). The asterisk indicates the center of the fovea. Scale bar: 200 μm.
Adaptive Optics Imaging and Image Postprocessing
The AOSLO system utilized in this study is a double-pass,32 single deformable mirror version based off the Indiana AOSLO system.33 The other major differences include the use of a smaller exit pupil (6 mm) to improve uniformity in imaging patients with smaller pupils. This AOSLO utilizes a confocal SLO system with a 13-nm bandwidth imaging beam centered at 830 nm. Major defocus errors from refractive error are corrected by a Badal system with higher aberration correction from the AO subsystem. Adaptive optics is provided based on a deformable mirror (Boston Micromachines) coupled to a Shack-Hartman wavefront sensor (180 samples within a nominal pupil of 6 mm) to reduce wavefront errors. The beacon for wavefront sensing is a 780-nm superluminescent laser diode with 50-μW input into the subject's eye. Each ROI image field size is approximately 1° × 1.2° with a lateral resolution of 2.5 μm in standard imaging conditions. Energy output and light safety were calculated according to ANSI (American National Standards Institute) guidelines for ophthalmic instruments.34
For each ROI, blocks of images were acquired in audio–video interleave (AVI) format consisting of 50 frames at 30 frames per second. Subsequent image processing was performed offline using a customized software platform (written in MatLab; The MathWorks, Natick, MA, USA): AVI files were dewarped to correct for sinusoidal distortion. Based on sharpness and contrast of cones, the best frames for each ROI were then manually selected and automatically aligned and averaged, with contrast for each image standardized based on the pixel intensity distribution histogram.
For each eye studied, AOSLO images were registered to a wider-field IR image using known acquisition coordinates and vascular landmarks in order to verify location and calculate eccentricity from the foveal center. The foveal center was determined based on the center of fixation and the foveal depression as seen on the corresponding SDOCT.
Image Analysis
We assessed the entire cone mosaic within our macular ROI images, and vessels were manually excluded before semiautomatic cone detection (Supplementary Fig. S2). Semiautomated cone identification was performed (Image-based Tool for Counting Nuclei, ITCN; available at http://rsb.info.nih.gov/ij/plugins/itcn.html; in the public domain). Manual correction of cones in each image was checked independently by two experienced graders (JL, AA) who were masked to clinical characteristics of each eye. Count differences between the two graders of >25% were adjudicated by a senior, experienced grader (JKS).
Voronoi tile areas35 (VTA) were constructed for each identified cone by defining regions that were closer to that cone than to any other cone in the mosaic. Effective radius and PF were calculated using customized Matlab routines36 as well as nearest neighbor distances (NND) using the Matlab routine knnsearch (The MathWorks). Cones and Voronoi tiles at the edges of the identified ROIs (along vessels and borders of images) were excluded from analysis (Supplementary Fig. S2).
Statistical Analysis
For agreement between graders, a 2-way mixed, absolute agreement, single-measures intraclass correlation (ICC) model was used. Individual results from each of the four macular ROI images for an individual eye were utilized in these analyses. Repeated-measures mixed models were calculated to evaluate relationships between cone variables and age, presence and duration of diabetes, and presence and severity of DR or DME while adjusting for eccentricity and correlations between sampling frames from the same eye. The regularity index (RI) was calculated as the mean divided by the standard deviation (SD) for NND and VTA variables.
All statistical evaluations were performed using SAS version 9.2 (SAS Institute, Inc., Cary, NC, USA). A P value less than 0.05 was considered statistically significant for these exploratory analyses.
Results
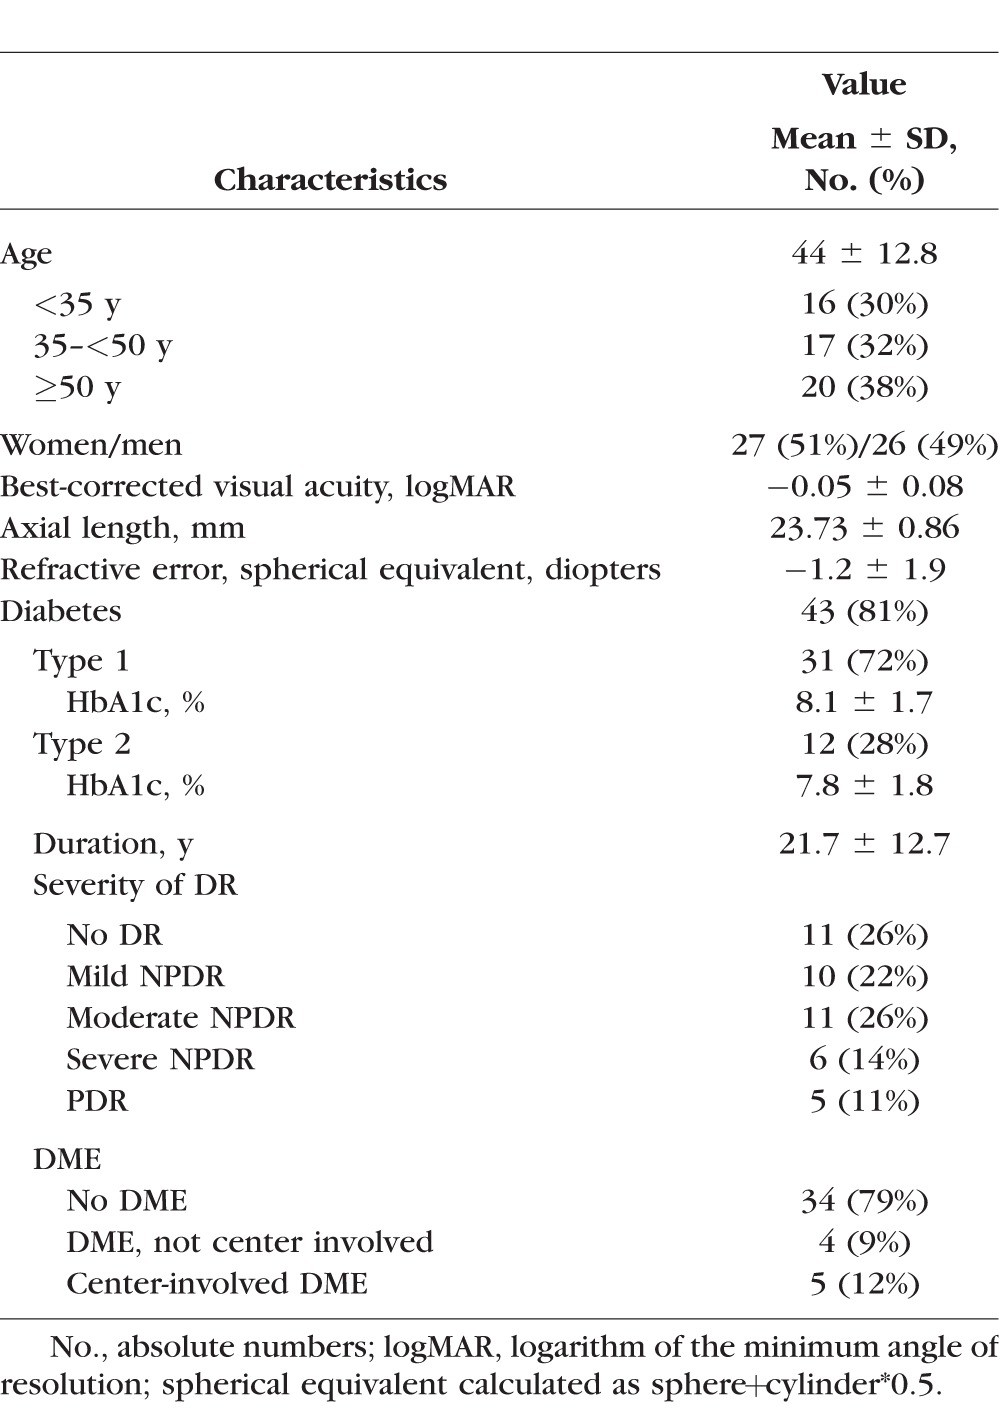
Fifty-three eyes of 53 individuals were included in this study. Mean ± SD age was 44.4 ± 12.8 years (range, 24–74 years), and 51% were female (27 subjects). For the 43 diabetic study participants, average diabetes duration was 21.7 ± 12.7 years (range, 1–55 years) and glycated hemoglobin (HbA1c) was 8.0 ± 1.7%. Average logMAR best-corrected VA in all study eyes was −0.05 ± 0.08 (Snellen equivalent of 20/16) with no significant difference between healthy controls and individuals with diabetes. A detailed description of the study population's characteristics is reported in Table 1.
Table 1.
Characteristics of the Study Population, n = 53
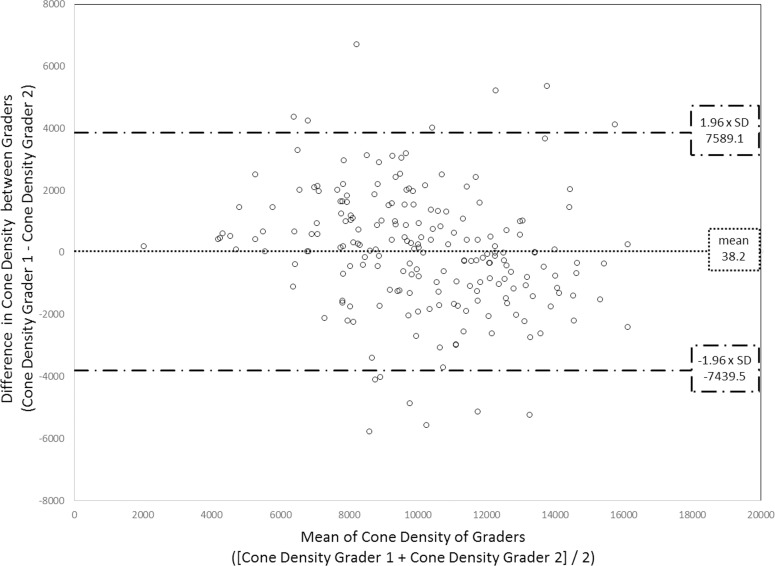
A total of 206 AOSLO images were included in the analysis; six images from six subjects were excluded due to poor image quality. On average, macular quadrant images were located 4.3° ± 0.6° eccentric from the central fixation point (Fig. 1). Macular quadrant ROIs were imaged at a fixed size of 1° × 1.2° (mean ± SD of 0.1186 ± 0.0003 mm2 after correcting for axial length). Neither HbA1c, diabetes type, nor duration of diabetes was significantly associated with any of the cone variables. Agreement between the two graders was excellent37 with a 2-way mixed, absolute agreement, single-measures ICC of 0.86. Adjudication of counts was performed for nine images (4.4%) (Fig. 2).
Figure 2.
Bland-Altman plot of cone density (cones/mm2) results of the graders. The horizontal line represents the mean difference between the graders' results. The upper/lower horizontal dashed lines represent 1.96× the standard deviation of the difference.
Cone Density
In the macular quadrants, average cone density was 10,101 ± 2782 cones/mm2. There was no significant association between cone density and presence of diabetes or severity of DR. Eyes with DME showed a significant decrease in cone density when compared to eyes without DME (P = 0.04). There was a trend for decreasing cone density with increasing age, but this was not statistically significant (Table 2; Figs. 3–5).
Table 2.
Changes in Cone Mosaic Parameters of the Four Macular Quadrants with Age, Presence of Diabetes, Severity of Diabetic Retinopathy, or Presence of Diabetic Macular Edema, N = 53 Eyes
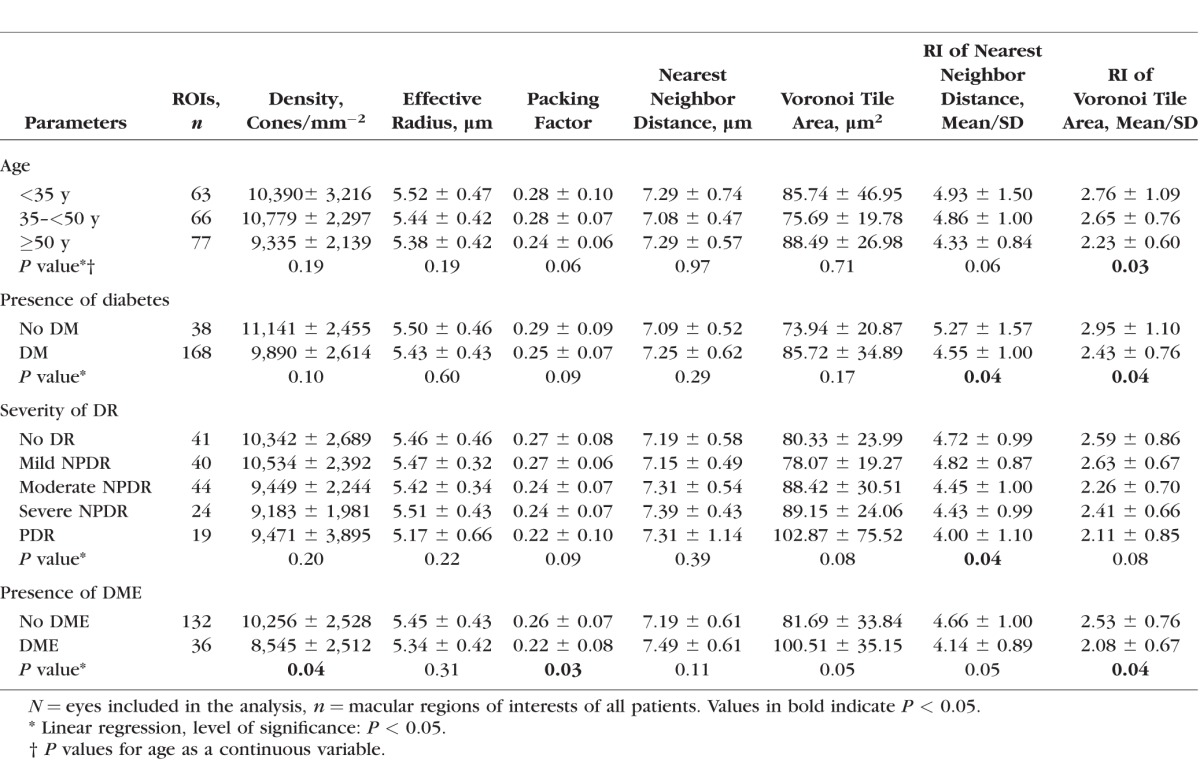
Figure 3.
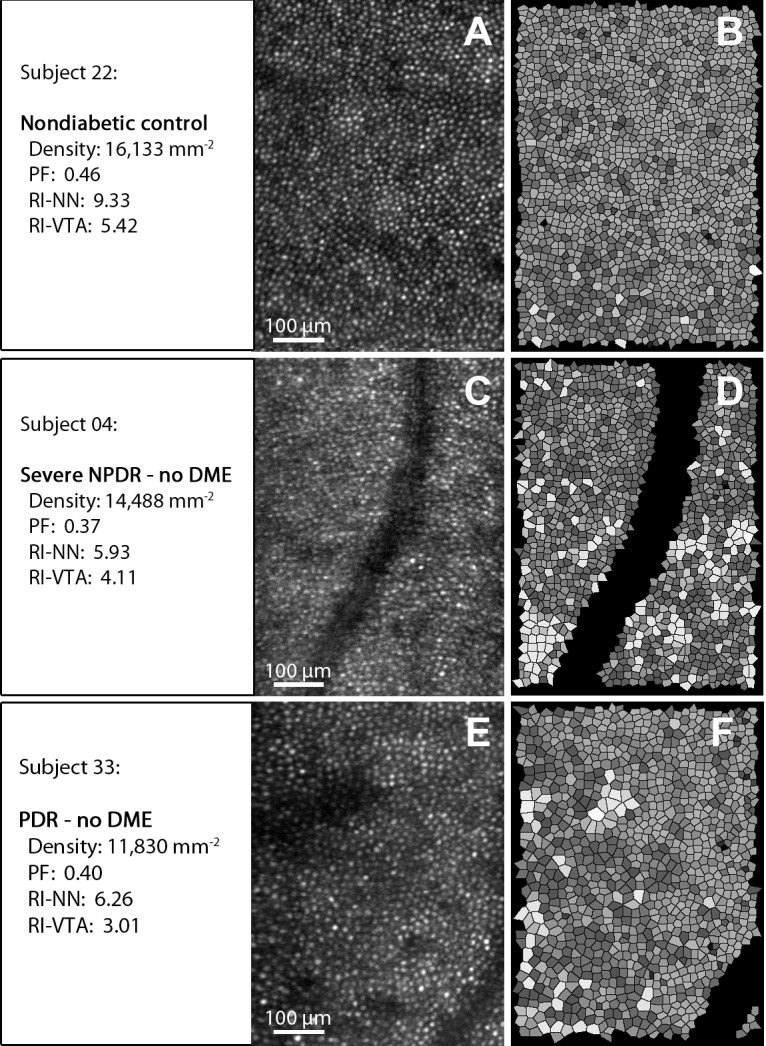
Examples of AOSLO cone reflection images (A, C, E) and corresponding Voronoi tile simulations (B, D, F). Upper row (nondiabetic control): Notice the densely packed cones (A) and the regular arrangement (B) represented by uniform shading of the Voronoi tiles. Middle (severe nonproliferative diabetic retinopathy [NPDR]) and bottom row (proliferative DR): Notice the reduced cone density (C, E) and reduced arrangement regularity represented by less uniformity of the shading of the corresponding Voronoi tiles (D, F). Vessels and Voronoi tiles at the edges of the image and vessel areas were excluded from the analysis (see also Methods section and Supplementary Fig. S2).
Figure 5.
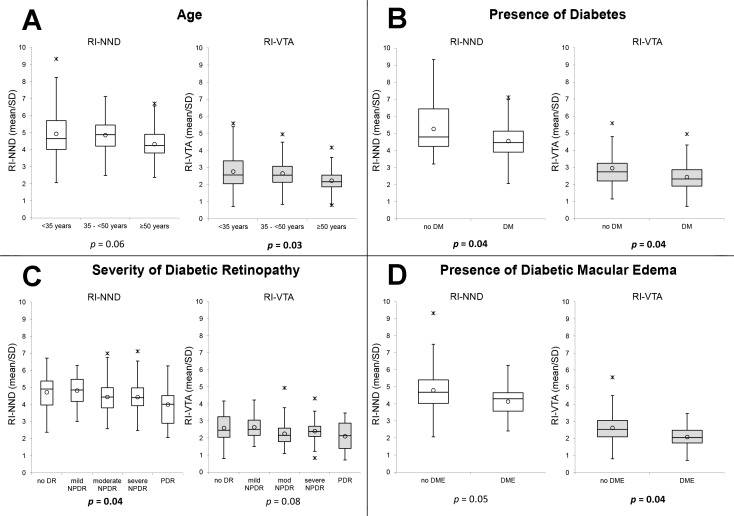
Box plots of the association of age (A), presence of diabetes (B), severity of diabetic retinopathy (C), and presence of diabetic macular edema (D) with the regularity indices of nearest neighbor distance and Voronoi tile area in macular quadrants. Regularity index (RI) calculated as mean/SD. RI-NND, regularity index of nearest neighbor distance; RI-VTA, regularity index of Voronoi tile area; DM, diabetes; DR, diabetic retinopathy; NPDR, nonproliferative diabetic retinopathy; PDR, proliferative diabetic retinopathy. Circle: mean; horizontal lines: median; asterisk: upper/lower outlier.
Figure 4.
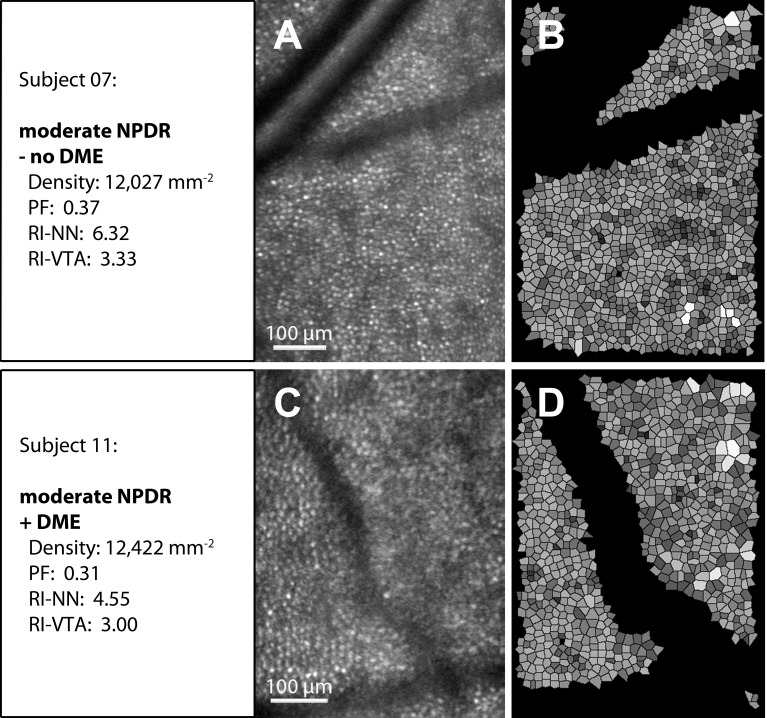
Examples of AOSLO cone reflection images (A, C) and corresponding Voronoi tile simulations (B, D). Upper row (moderate nonproliferative diabetic retinopathy [NPDR], no diabetic macular edema [DME] present): Notice the clearly visible cones (A). Lower row (moderate NPDR, DME present): The cone mosaic is less distinct and blurred by the presence of local edema (C). Regularity is markedly reduced indicated by irregularly shaped Voronoi tiles with nonuniform shading (D). Vessels and Voronoi tiles at the edges of the image and vessel areas were excluded from the analysis (see also Methods section and Supplementary Fig. S2).
Cone Spacing
Measures related to overall cone spacing included effective radius (ER), PF, NND, and VTA. None of the cone spacing variables were associated with presence of diabetes or severity of DR. The presence of DME was significantly associated with a decreased PF (P = 0.03) and a trend toward an increase in VTA (P = 0.05). Age and VA were not significantly associated with any cone spacing parameters (Table 2; Figs. 3–5).
Cone Arrangement
Changes in the RI related to NND and VTA were closely associated with diabetes and differing DR severity levels. Average RI-NND was 4.71 ± 1.11 and average RI-VTA was 2.55 ± 0.82. When compared to nondiabetic control eyes, diabetic eyes had a significantly lower RI-NND (control: 5.27 ± 1.57 versus diabetic: 4.55 ± 1.00; P = 0.04) and RI-VTA (control: 2.95 ± 1.10 versus diabetic: 2.43 ± 0.76; P = 0.04). Increasing severity of DR was also significantly associated with a decrease in RI-NND (no DR: 4.72 ± 0.99, mild nonproliferative DR [NPDR]: 4.82 ± 0.87, moderate NPDR: 4.45 ± 1.00, severe NPDR: 4.43 ± 0.99, proliferative DR [PDR]: 4.00 ± 1.10; P = 0.04), and with a trend toward decreasing RI-VTA (no DR: 2.59 ± 0.86, mild NPDR: 2.63 ± 0.67, moderate NPDR: 2.26 ± 0.70, severe NPDR: 2.41 ± 0.66, PDR: 2.11 ± 0.85; P = 0.08). Eyes with any DME had a significantly reduced RI-VTA (no DME: 2.53 ± 0.76 versus DME: 2.08 ± 0.67, P = 0.04) as compared with eyes without DME. A trend was present for decreasing RI-NND (no DME: 4.66 ± 1.00 versus DME: 4.14 ± 0.89, P = 0.05) in eyes with any DME (Table 2; Figs. 3–5).
The presence of intraretinal cysts on SDOCT within the area corresponding to the AOSLO field was closely related to both local increases in cone VTA and decreases in cone arrangement regularity. The presence of intraretinal cysts was significantly associated with an increase in VTA (eyes without DME: 72.38 ± 32.45 μm2; eyes with DME but no local intraretinal cysts: 82.40 ± 27.98 μm2; eyes with DME and local intraretinal cysts: 99.87 ± 53.97 μm2; P = 0.001) and a decrease in RI-NND (eyes without DME: 4.62 ± 1.13; eyes with DME, but no local intraretinal cysts: 4.16 ± 0.74; eyes with DME and local intraretinal cysts: 3.46 ± 1.29; P = 0.003). Increasing age was associated with a decrease in both RI-NND and RI-VTA; however, only the relationship with RI-VTA was statistically significant (RI-NND: P = 0.06; RI-VTA: P = 0.03). Visual acuity was not associated with either RI-NND or RI-VTA.
Discussion
In this cross-sectional study, we utilized high-resolution AOSLO imaging to identify changes in the human retinal cone mosaic in vivo in individuals with diabetes and across a wide range of DR severity. Although absolute cone density did not change significantly in diabetic eyes in this cohort, there was increasing irregularity of cone spacing based on both Voronoi tile and nearest neighbor analyses in diabetes as well as with increasing severity of DR and DME.
To the best of our knowledge, this study represents the first examination of cone parameters other than density, such as RI, in eyes with and without diabetes and with increasingly severe diabetic microvascular pathology. The decreases in regularity of cone arrangement that we report in diabetic eyes might help to explain functional deficits that are present in diabetes even when the retina appears clinically normal. It is also possible that these apparent changes in regularity are the result of shadowing artifacts from intraretinal pathology rather than actual abnormalities in the cone mosaic. However, these changes may still be important to document if they can be utilized as surrogate markers of diabetic eye pathology.
Our results in those without diabetes are in accordance with the existing literature, with a mean cone count 11,141 cones/mm2 at a mean eccentricity of 4.3°.38–41 Whereas the presence of diabetes and severity of DR were associated solely with a decrease in cone regularity, the presence of DME appeared to have a more severe impact on several cone mosaic parameters. In addition to reductions in RI, the presence of DME was also significantly related to absolute cone density and PF in the macular quadrants. Future studies may elucidate whether these DME-related alterations in cone metrics are transient and resolve with resolution of the retinal edema or represent permanent sequelae of DME. There are several possible ways in which DME might affect cone assessments on AOSLO imaging. First, the swelling of retina cells anterior to the photoreceptors might distort the retinal architecture physically and could result in changes in the regularity and the spacing of the cone mosaic. In addition, presence of intraretinal cysts and extracellular fluid accumulation in the inner retinal layers might affect the reliability of assessments of cone arrangement due to blurring or distortion of the images.30,42,43 Finally, impairment of the photoreceptor layer might be related to abnormalities in the retinal pigment epithelium (RPE) in eyes with DME, since it is known that in DME the RPE's capacity for transepithelial transport is impaired and in part responsible for accumulation of fluid in the retinal parenchyma.44
Qualitative evaluation of the AOSLO retinal images suggests that decreases in cone spacing regularity are often associated with the presence of dark patches that disturb the cone mosaic. The histopathologic correlates of these dark patches are as yet unknown. It is possible that these patches represent loss or apoptosis of the cone photoreceptors, although in this study, cone density was not significantly decreased in images with decreased cone regularity. Several mechanism for apoptosis of neuroretinal cells in diabetes have been described, including changes in glutamate excitation, trophic factor signaling deficits, oxidative stress, or neuroinflammation.45 While apoptotic processes have mostly been observed among cells of the inner retinal layers in diabetes, there is evidence of photoreceptor damage based on multifocal (mf)ERG studies.17,19,46
Another possible cause for dark patches present on the AOSLO images might be pathology of individual cones leading to a loss of their usual wave-guiding characteristics and a consequent decrease in cone reflectance. Thus, because the non–wave-guiding cones would no longer preferentially return light to the pupil, they would appear much darker than normal cones.47,48 However, the origin of cones' wave-guiding capability or reflectance is still elusive. Pircher et al.49 suggested that the reflectance corresponds to the junction between inner and outer segments of the cone photoreceptors. Kitaguchi et al.50 correlated AO fundus images of the cone mosaic with SDOCT images and found evidence that the largest contribution to cone reflectance on AO images is from the cone outer segment tips. It is possible that variations in reflectance are correlated with metabolic activity or functional aspects of cone performance that have not yet been elucidated.
Subclinical or clinically visible DR lesions such as microaneurysms, intraretinal hemorrhages, intraretinal microvascular abnormalities, or hard exudates located in more anterior retinal layers might also result in shadowing and obscuration of the cone mosaic on AOSLO images (Prager SG, et al. IOVS 2012;53:ARVO E-Abstract 5654).30,51,52 Indeed, a detailed review of our AOSLO data from 11 diabetic subjects with no clinical signs of DR on fundus photographs revealed pathology including small microaneurysms, hemorrhages, and hard exudates on the AOSLO images in 45% (n = 5) that were associated with posterior shadowing of the cone mosaic images directly underneath the respective lesions. Eyes with clinically visible lesions on the fundus photographs also often demonstrated similar, nonspecific dark patches right underneath the corresponding lesions. However, dark patches on confocal cone images often could not be attributed to specific DR lesions, suggesting that artifact from shadowing is not the only etiology of the spacing abnormalities seen in this study.
Limitations of this study include a relatively small sample size and the cross-sectional nature of the evaluation, which does not allow us to determine when cone abnormalities develop during the course of diabetes. In addition, we did not perform assessments such as microperimetry, contrast sensitivity testing, or mfERG that would establish whether or not the cone abnormalities are related to defects in retinal function other than VA. Although best-corrected VA in this cohort was not significantly related to any of the cone parameters evaluated, most eyes in this group had excellent vision, with 92% seeing 20/20 or better. Because of the limitations of this AOSLO instrument, cones less than 2.5 μm in diameter could not be resolved, and therefore evaluation of the cones located at the foveal area was not possible. It is possible that alternative AOSLO methods such as split detector imaging, which enhances the visibility of non–wave-guiding cones, will allow better identification of cones in eyes with neural retinal pathology.48
In summary, decreases in regularity of retinal cone arrangement are consistently associated with the presence of diabetes, increasing DR severity, and the presence of DME. These data support the hypothesis that irregularity of the macular cone mosaic may be a promising parameter to reflect changes in the neural retina that precede and accompany diabetic microvascular retinal pathology. In contrast, absolute cone density and spacing parameters such as ER and NND, which are insensitive to missed cones, do not appear to change substantially in diabetes. These results suggest that future AOSLO evaluation of cone mosaic regularity is warranted to determine whether decreased regularity predicts anatomic or additional functional retinal outcomes in patients with diabetes.
Supplementary Material
Acknowledgments
The authors thank the study coordinators Hanna Kwak, Peggy Stockman, and Ann Kopple for helping with patient recruitment and administrative support. The authors also thank Lloyd Paul Aiello, MD, PhD, FARVO, for scientific discussion, input, and manuscript review.
Supported by grants from National Eye Institute, R01 EY024702, R44 EY016295, and P30EY019008; JDRF 3-SRA-2014-264-M-R and 17-2011-359; Eleanor Chesterman Beatson Childcare Ambassador Program Foundation Grant, NIDDK 5 P30 DK036836-24 P&F Grant, Massachusetts Lion Eye Research Fund, Inc.
Disclosure: J. Lammer, None; S.G. Prager, None; M.C. Cheney, None; A. Ahmed, None; S.H. Radwan, None; S.A. Burns, None; P.S. Silva, None; J.K. Sun, Boston Micromachines (F), Genentech (F), Optos (F), Optovue (F)
References
- 1. Early Treatment Diabetic Retinopathy Study Research Group. Grading diabetic retinopathy from stereoscopic color fundus photographs—an extension of the modified Airlie House Classification. ETDRS report number 10. Early Treatment Diabetic Retinopathy Study Research Group. Ophthalmology. 1991; 98: 786–806. [PubMed] [Google Scholar]
- 2. Wolter JR. Diabetic capillary microaneurysms of the retina. Arch Ophthalmol. 1961; 65: 847–854. [DOI] [PubMed] [Google Scholar]
- 3. Bloodworth JMB. Diabetic retinopathy. Diabetes. 1962; 11: 1–22. [PubMed] [Google Scholar]
- 4. Huang D,, Swanson EA,, Lin CP,, et al. Optical coherence tomography. Science. 1991; 254: 1178–1181. [DOI] [PMC free article] [PubMed] [Google Scholar]
- 5. Swanson EA,, Izatt JA,, Hee MR,, et al. In vivo retinal imaging by optical coherence tomography. Opt Lett. 1993; 18: 1864–1866. [DOI] [PubMed] [Google Scholar]
- 6. Wojtkowski M,, Leitgeb R,, Kowalczyk A,, Bajraszewski T,, Fercher AF. In vivo human retinal imaging by Fourier domain optical coherence tomography. J Biomed Opt. 2002; 7: 457–463. [DOI] [PubMed] [Google Scholar]
- 7. Wojtkowski M,, Srinivasan V,, Fujimoto JG,, et al. Three-dimensional retinal imaging with high-speed ultrahigh-resolution optical coherence tomography. Ophthalmology. 2005; 112: 1734–1746. [DOI] [PMC free article] [PubMed] [Google Scholar]
- 8. van Dijk HW,, Kok PHB,, Garvin M,, et al. Selective loss of inner retinal layer thickness in type 1 diabetic patients with minimal diabetic retinopathy. Invest Ophthalmol Vis Sci. 2009; 50: 3404–3409. [DOI] [PMC free article] [PubMed] [Google Scholar]
- 9. Bresnick GH,, Condit RS,, Palta M,, Korth K,, Groo A,, Syrjala S. Association of hue discrimination loss and diabetic retinopathy. Arch Ophthalmol. 1985; 103: 1317–1324. [DOI] [PubMed] [Google Scholar]
- 10. Roy MS,, Gunkel RD,, Podgor MJ. Association between colour vision losses and diabetes mellitus. Arch Ophthalmol. 1986; 104: 225–228. [DOI] [PubMed] [Google Scholar]
- 11. Feitosa-Santana C,, Paramei GV,, Nishi M,, Gualtieri M,, Costa MF,, Ventura DF. Color vision impairment in type 2 diabetes assessed by the D-15d test and the Cambridge Colour Test. Ophthalmic Physiol Opt. 2010; 30: 717–723. [DOI] [PubMed] [Google Scholar]
- 12. Di Leo MA,, Caputo S,, Falsini B,, et al. Nonselective loss of contrast sensitivity in visual system testing in early type I diabetes. Diabetes Care. 1992; 15: 620–625. [DOI] [PubMed] [Google Scholar]
- 13. Bresnick GH,, Palta M. Oscillatory potential amplitudes. Relation to severity of diabetic retinopathy. Arch Ophthalmol. 1987; 105: 929–933. [DOI] [PubMed] [Google Scholar]
- 14. Tzekov R,, Arden GB. The electroretinogram in diabetic retinopathy. Surv Ophthalmol. 1999; 44: 53–60. [DOI] [PubMed] [Google Scholar]
- 15. Weiner A,, Christopoulos VA,, Gussler CH,, et al. Foveal cone function in nonproliferative diabetic retinopathy and macular edema. Invest Ophthalmol Vis Sci. 1997; 38: 1443–1449. [PubMed] [Google Scholar]
- 16. Fortune B,, Schneck ME,, Adams AJ. Multifocal electroretinogram delays reveal local retinal dysfunction in early diabetic retinopathy. Invest Ophthalmol Vis Sci. 1999; 40: 2638–2651. [PubMed] [Google Scholar]
- 17. Bearse MA,, Adams AJ,, Han Y,, et al. A multifocal electroretinogram model predicting the development of diabetic retinopathy. Prog Retin Eye Res. 2006; 25: 425–448. [DOI] [PMC free article] [PubMed] [Google Scholar]
- 18. Ng JS,, Bearse MA,, Schneck ME,, Barez S,, Adams AJ. Local diabetic retinopathy prediction by multifocal ERG delays over 3 years. Invest Ophthalmol Vis Sci. 2008; 49: 1622–1628. [DOI] [PubMed] [Google Scholar]
- 19. Harrison WW,, Bearse MA,, Ng JS,, et al. Multifocal electroretinograms predict onset of diabetic retinopathy in adult patients with diabetes. Invest Ophthalmol Vis Sci. 2011; 52: 772–777. [DOI] [PMC free article] [PubMed] [Google Scholar]
- 20. Liang J,, Williams DR,, Miller DT. Supernormal vision and high-resolution retinal imaging through adaptive optics. J Opt Soc Am A Opt Image Sci Vis. 1997; 14: 2884–2892. [DOI] [PubMed] [Google Scholar]
- 21. Roorda A,, Romero-Borja F,, Donnelly WJ, III,, Queener H,, Hebert T,, Campbell M. Adaptive optics scanning laser ophthalmoscopy. Opt Express. 2002; 10: 405–412. [DOI] [PubMed] [Google Scholar]
- 22. Zhang Y,, Poonja S,, Roorda A. MEMS-based adaptive optics scanning laser ophthalmoscopy. Opt Lett. 2006; 31: 1268–1270. [DOI] [PubMed] [Google Scholar]
- 23. Wolfing JI,, Chung M,, Carroll J,, Roorda A,, Williams DR. High-resolution retinal imaging of cone-rod dystrophy. Ophthalmology. 2006; 113: 1019 e1. [DOI] [PubMed] [Google Scholar]
- 24. Baraas RC,, Carroll J,, Gunther KL,, et al. Adaptive optics retinal imaging reveals S-cone dystrophy in tritan color-vision deficiency. J Opt Soc Am A Opt Image Sci Vis. 2007; 24: 1438–1447. [DOI] [PMC free article] [PubMed] [Google Scholar]
- 25. Duncan JL,, Zhang Y,, Gandhi J,, et al. High-resolution imaging with adaptive optics in patients with inherited retinal degeneration. Invest Ophthalmol Vis Sci. 2007; 48: 3283–3291. [DOI] [PubMed] [Google Scholar]
- 26. Bessho K,, Fujikado T,, Mihashi T,, Yamaguchi T,, Nakazawa N,, Tano Y. Photoreceptor images of normal eyes and of eyes with macular dystrophy obtained in vivo with an adaptive optics fundus camera. Jpn J Ophthalmol. 2008; 52: 380–385. [DOI] [PubMed] [Google Scholar]
- 27. Boretsky A,, Khan F,, Burnett G,, et al. In vivo imaging of photoreceptor disruption associated with age-related macular degeneration: a pilot study. Lasers Surg Med. 2012; 44: 603–610. [DOI] [PMC free article] [PubMed] [Google Scholar]
- 28. Ooto S,, Hangai M,, Sakamoto A,, et al. High-resolution imaging of resolved central serous chorioretinopathy using adaptive optics scanning laser ophthalmoscopy. Ophthalmology. 2010; 117: 1800–1809. [DOI] [PubMed] [Google Scholar]
- 29. Ooto S,, Hangai M,, Takayama K,, Ueda-Arakawa N,, Hanebuchi M,, Yoshimura N. Photoreceptor damage and foveal sensitivity in surgically closed macular holes: an adaptive optics scanning laser ophthalmoscopy study. Am J Ophthalmol. 2012; 154: 174–186, e2. [DOI] [PubMed] [Google Scholar]
- 30. Lombardo M,, Parravano M,, Lombardo G,, et al. Adaptive optics imaging of parafoveal cones in type 1 diabetes. Retina. 2014; 34: 546–557. [DOI] [PubMed] [Google Scholar]
- 31. Early Treatment Diabetic Retinopathy Study Research Group. Fundus photographic risk factors for progression of diabetic retinopathy. ETDRS report number 12. Ophthalmology. 1991; 98 (5 suppl): 823–833. [PubMed] [Google Scholar]
- 32. Webb RH,, Albanese MJ,, Burns SA. Stroke amplifier for deformable mirrors. Appl Opt. 2010; 43: 5330–5333. [DOI] [PMC free article] [PubMed] [Google Scholar]
- 33. Burns SA,, Elsner AE,, Ferguson D,, Hammer DX. Large-field-of-view, modular, stabilized adaptive-optics-based scanning laser ophthalmoscope. J Opt Soc Am A Opt Image Sci Vis. 2007; 24: 1313–1326. [DOI] [PMC free article] [PubMed] [Google Scholar]
- 34. Delori FC,, Webb RH,, Sliney DH. Maximum permissible exposures for ocular safety (ANSI 2000), with emphasis on ophthalmic devices. J Opt Soc Am A Opt Image Sci Vis. 2007; 24: 1250–1265. [DOI] [PubMed] [Google Scholar]
- 35. Li KY,, Roorda A. Automated identification of cone photoreceptors in adaptive optics retinal images. J Opt Soc Am A Opt Image Sci Vis. 2007; 24: 1358–1363. [DOI] [PubMed] [Google Scholar]
- 36. Rodieck RW. The density recovery profile: a method for the analysis of points in the plane applicable to retinal studies. Vis Neurosci. 1991; 6: 95–111. [DOI] [PubMed] [Google Scholar]
- 37. Cicchetti DV. Guidelines, criteria, and rules of thumb for evaluating normed and standardized assessment instruments in psychology. Psychol Assess. 1994; 6: 284–290. [Google Scholar]
- 38. Curcio CA,, Sloan KR,, Kalina RE,, Hendrickson AE. Human photoreceptor topography. J Comp Neurol. 1990; 292: 497–523. [DOI] [PubMed] [Google Scholar]
- 39. Song H,, Chui TYP,, Zhong Z,, Elsner AE,, Burns SA. Variation of cone photoreceptor packing density with retinal eccentricity and age. Invest Ophthalmol Vis Sci. 2011; 52: 7376–7384. [DOI] [PMC free article] [PubMed] [Google Scholar]
- 40. Chui TYP,, Song H,, Burns SA. Individual variations in human cone photoreceptor packing density: variations with refractive error. Invest Ophthalmol Vis Sci. 2008; 49: 4679–4687. [DOI] [PMC free article] [PubMed] [Google Scholar]
- 41. Wilk MA,, McAllister JT,, Cooper RF,, et al. Relationship between foveal cone specialization and pit morphology in Albinism. Invest Ophthalmol Vis Sci. 2014; 55: 4186–4198. [DOI] [PMC free article] [PubMed] [Google Scholar]
- 42. Scoles DH,, Higgins BP,, Cooper RF,, et al. Microscopic inner retinal hyper-reflective phenotypes in retinal and neurologic disease. Invest Ophthalmol Vis Sci. 2014; 55: 4015–4029. [DOI] [PMC free article] [PubMed] [Google Scholar]
- 43. Langlo CS,, Flatter JA,, Dubra A,, Wirostko WJ,, Carroll J. A lensing effect of inner retinal cysts on images of the photoreceptor mosaic. Retina. 2014; 34: 421–422. [DOI] [PMC free article] [PubMed] [Google Scholar]
- 44. Simó R,, Villarroel M,, Corraliza L,, Hernández C,, Garcia-Ramírez M. The retinal pigment epithelium: something more than a constituent of the blood-retinal barrier--implications for the pathogenesis of diabetic retinopathy. J Biomed Biotechnol. 2010; 2010: 190724. [DOI] [PMC free article] [PubMed] [Google Scholar]
- 45. Barber AJ,, Gardner TW,, Abcouwer SF. The significance of vascular and neural apoptosis to the pathology of diabetic retinopathy. Invest Ophthalmol Vis Sci. 2011; 52: 1156–1163. [DOI] [PMC free article] [PubMed] [Google Scholar]
- 46. Greenstein VC,, Holopigian K,, Seiple W,, Carr RE,, Hood DC. Atypical multifocal ERG responses in patients with diseases affecting the photoreceptors. Vision Res. 2004; 44: 2867–2874. [DOI] [PubMed] [Google Scholar]
- 47. Enoch JM. Optical properties of the retinal receptors. J Opt Soc Am. 1963; 53: 71–85. [Google Scholar]
- 48. Scoles D,, Sulai YN,, Langlo CS,, et al. In vivo imaging of human cone photoreceptor inner segments. Invest Ophthalmol Vis Sci. 2014; 55: 4244–4251. [DOI] [PMC free article] [PubMed] [Google Scholar]
- 49. Pircher M,, Baumann B,, Götzinger E,, Hitzenberger CK. Retinal cone mosaic imaged with transverse scanning optical coherence tomography. Opt Lett. 2006; 31: 1821–1823. [DOI] [PMC free article] [PubMed] [Google Scholar]
- 50. Kitaguchi Y,, Fujikado T,, Bessho K,, et al. Adaptive optics fundus camera to examine localized changes in the photoreceptor layer of the fovea. Ophthalmology. 2008; 115: 1771–1777. [DOI] [PubMed] [Google Scholar]
- 51. Lombardo M,, Parravano M,, Serrao S,, Ducoli P,, Stirpe M,, Lombardo G. Analysis of retinal capillaries in patients with type 1 diabetes and nonproliferative diabetic retinopathy using adaptive optics imaging. Retina. 2013; 8: 1630–1639. [DOI] [PubMed] [Google Scholar]
- 52. Burns SA,, Elsner AE,, Chui TY,, et al. In vivo adaptive optics microvascular imaging in diabetic patients without clinically severe diabetic retinopathy. Biomed Opt Express. 2014; 5: 961–974. [DOI] [PMC free article] [PubMed] [Google Scholar]
Associated Data
This section collects any data citations, data availability statements, or supplementary materials included in this article.


