Abstract
Spectroscopic photoacoustic imaging is an emerging biomedical imaging modality which can be used to simultaneously identify multiple optical absorbers in tissue. With current technology, the image acquisition time is limited primarily by the laser repetition rate, and spectroscopic photoacoustic image acquisition can take seconds to minutes, depending on the system and imaging volume. We have developed an algorithm that can be used to eliminate extraneous wavelengths and decrease image acquisition time while maintaining image quality. Here, we show the effect the wavelength selection has on in vivo spectroscopic photoacoustic imaging. As an example, dye draining to the lymph node of a mouse was imaged. We demonstrate that spectroscopic photoacoustic image quality is more accurately preserved when wavelengths are chosen based on the spectral features of the absorbers compared to often used selection of evenly spaced wavelengths. In fact, only three wavelengths are needed to accurately spectrally unmix the dye from oxygenated and deoxygenated hemoglobin.
Photoacoustic (PA) imaging is an emerging biomedical imaging modality capable of imaging optical absorption properties of tissue at depth.[1, 2] The contrast in PA imaging is primarily derived from differences in optical absorption, and spectroscopic techniques are applied to isolate the contributions of multiple absorbers to the overall PA image, a process known as spectroscopic photoacoustic (sPA) imaging. Spectroscopic photoacoustic imaging has been used to identify lipids in atherosclerotic plaques, image metal implants in tissue, measure the oxygenation of hemoglobin in a tumor, and map out the deposition of nanoparticles or dye-based contrast agents.[3–9]
For imaging beyond a few millimeters of tissue, a high energy pulsed laser is needed, which is typically limited to pulse repetition frequency (PRF) of tens of Hz. In turn, the low PRF limits the temporal rate of PA imaging. Although recent advances have enabled real-time sPA imaging,[10] image acquisition can take seconds to minutes, especially several wavelengths are used to visualize a large 3-D volume. Thus, it is desired to minimize the number of imaging wavelengths while preserving image quality.
Although sPA imaging has been widely used for a variety of applications, the optical wavelengths used for imaging are typically chosen heuristically; few attempts have been made to select wavelengths based on the spectral characteristics of the absorbers. One such example is using the condition number of the absorption spectra matrix as an indication of stability for linear least squares spectral unmixing.[11] Other work has focused on using the Cramer-Rao lower bound for wavelength selection.[12] This method takes the tissue composition and imaging depth into account; however, the tissue properties/geometry, absorber concentration, and fluence distribution must be known to apply this approach.
We have recently proposed a new method to select wavelengths based on the smallest singular value of molar absorption spectra matrix.[13] We showed – through simulations and phantom imaging studies – that the method performed better than evenly spaced wavelengths. Here we investigate the effect of the wavelength selection algorithm on the ability to spectrally unmix the absorbers in an in vivo sPA image. We compare the condition number and smallest singular value based selection methods with evenly spaced wavelengths.
The concentrations of absorbers in each pixel can be represented as a set of linear equations:
| (1) |
where λ is the optical wavelength, C is the concentration of optical absorbers, ε is a matrix consisting of the molar absorption spectra of all absorbers, and μest is the estimated absorption spectrum, which (if a good estimate is obtained for the Grüneisen parameter, Γ, the local fluence, F, and the initial local pressure rise immediately following the laser pulse, P) can be estimated from the PA signal. Given ε and μest, a linear least squared error solution can be obtained for Eq. 1 using the pseudoinverse.[6]
For practical purposes, decreasing the number of imaging wavelengths without significantly degrading the sPA image quality is desired. In order to decrease the number of wavelengths used in imaging, we recursively removed wavelengths from ε while maximizing either σmin (the smallest singular value of ε) in the case of σmin selection or σmin/σmax (the condition number of ε) in the case of condition number selection.[11, 13] Each of these optimizations maintains stability under the pseudoinverse operation and preserves the spectral features of the absorption spectra.
In this study, mouse lymph node mapping and characterization was performed using well-studied and clinically relevant mouse model.[14, 15] The contrast agent (MMPSense 750 FAST, Perkin Elmer) was injected into the tongue of a non-tumor-bearing Nu/Nu mouse (Charles River Laboratories) under anesthesia (Isoflurane, 1.5% in O2) and was allowed to drain through the lymphatic system to the cervical lymph nodes located on the neck of the mouse (Fig. 1a). Approximately 30 minutes following the injection of the dye, combined ultrasound and PA imaging was performed using a Vevo LAZR imaging system (VisualSonics, Inc.) in a plane containing the lymph node (Fig. 1a, red box). An LZ-550 40 MHz linear array transducer (VisualSonics, Inc.) was used to collect all images in this study. The PA images were corrected for incident laser fluence and spectral processing was performed offline.
Fig. 1.

(Color online) a) A three-dimensional ultrasound image of a mouse depicting the dye injection site and imaging plane (red box). b) Overlaid ultrasound and sPA image showing Hb and HbO2 (blue and red, respectively) and MMPSense dye (yellow). Scale bar = 1 mm.
Figure 1b shows the ultrasound image (gray) with the overlaid sPA image. The cervical lymph node is easily identified as a dark, hypoechoic oval in the ultrasound image. The sPA image has been spectrally unmixed from a set of 30 optical wavelengths spanning 680 nm to 970 nm in steps of 10 nm. A linear least squared error approach was used to identify three dominant optical absorbers: deoxygenated hemoglobin (Hb; blue), oxygenated hemoglobin (HbO2; red), and MMPSense dye (yellow).[6] The sPA image shows vasculature in the region of the lymph node and two afferent lymphatic vessels. The dye has clearly accumulated in the cervical lymph node, indicating that this is the primary node of drainage from the injection site.
Three methods were used to select the reduced set of imaging wavelengths. First, evenly spaced wavelengths that spanned the entire imaging spectrum were selected. Second, condition number selection was used.[11] Finally, σmin selection was applied.[13] The criterion for wavelength pruning, σmin, can also serve as a predictor of spectral unmixing accuracy. We have shown that σmin is inversely proportional to the error in concentration estimations in the presence of additive noise.[13] Therefore, σmin can be used to determine how well a given set of wavelengths will perform in resolving particular set of absorbers in sPA imaging.
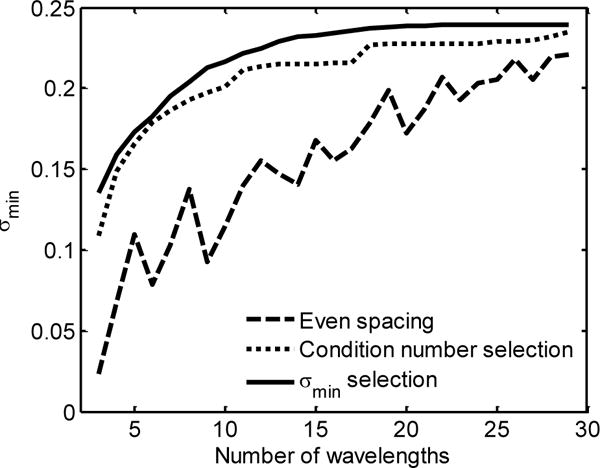
Figure 2 shows σmin for each of the three wavelength selection methods where the numbers of wavelength span from three wavelengths (the smallest number that can still be used to estimate the concentrations of all three absorbers) to 29 wavelengths. The smallest singular value is greatest across the entire span for the case of σmin-selected wavelengths. This indicates that images obtained with wavelengths chosen with our algorithm will have better accuracy in the estimation of absorber concentrations.
Fig. 2.

Plot demonstrating that σmin decreases as wavelengths are removed. This decrease is much less drastic and much more predictable when σmin selection is used (solid line) than when either condition number selection (dotted line) or evenly spaced wavelengths are used (dashed line).
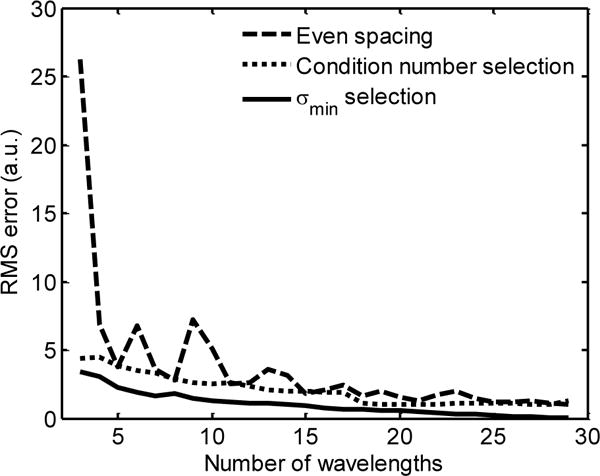
The root mean squared (RMS) error of each pixel as a function of the number of wavelengths can be used to quantify the effect of wavelength selection on absorber concentration estimation. The concentrations estimated using all 30 wavelengths were taken to be the “true” concentrations. While the case of 30 wavelengths does not represent quantified absorber concentrations, it does allow us to observe the relative changes related to wavelength pruning. The average of the RMS error across all pixels is shown in Fig. 3, indicating that the sPA images formed from wavelengths selected with σmin selection (solid line) provide more accurate absorber concentrations than when either the condition number selection (dotted line) or evenly spaced wavelengths are used (dashed line). Another useful benefit of using either the condition number or σmin for selection is that the error does not dramatically increase as each individual wavelength is removed. Thus, the removal of a single wavelength will lead to a predictably small change in the sPA image. It is also important to note that the local maxima in Fig. 3 occur at the same locations as the local minima in Fig. 2. This reinforces the observation that σmin is a good predictor of sPA imaging accuracy.
Fig. 3.

The RMS error of the absorber concentrations estimated from between three and 29 wavelengths. The wavelengths were selected using either even spacing (dashed line), condition number selection (dotted line), or σmin selection (solid line).
The decreased accuracy in estimating absorber concentrations as wavelengths are removed also manifests itself as degradation in sPA image quality. Indeed, by observing the sPA images formed with only a few wavelengths, it becomes more difficult to accurately capture the spectral features of the absorbers. We analyzed the role that wavelength selection has on the final sPA image by comparing the images created from three wavelengths selected by each of the three methods.
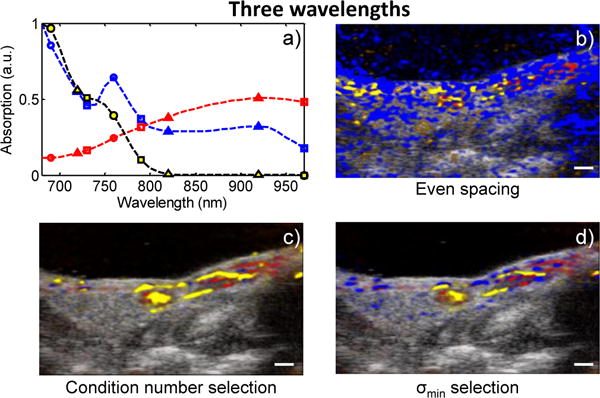
Figure 4 shows a qualitative comparison of the sPA images produced after applying each of the two wavelength selection methods. When three wavelengths are used – a particularly poor choice for the case of even spacing – σmin selection identifies wavelengths near sharp spectral features (Fig. 4a, circles) while the evenly spaced wavelengths happen to miss these same features (Fig. 4a, triangles). In this example, the sPA images show that the evenly spaced wavelengths tend to over-predict the presence of Hb (Fig. 4b). In contrast, condition number selection under-predicts the presence of Hb (Fig. 4c). When the σmin selection is used, however, the main features of the sPA image are preserved (Fig. 4d). Thus, when only a few wavelengths are used, the choice of wavelengths becomes critical. If chosen correctly, the resulting sPA image can be reconstructed very accurately.
Fig. 4.

(Color online) a) The spectra of Hb (blue), HbO2 (red), and MMPSense dye (yellow) with the three selected wavelengths using even spacing (triangles), condition number selection (squares), and σmin selection (circles), and the sPA images generated from b) the evenly spaced wavelengths, c) the condition number selected wavelengths, and d) the σmin-selected wavelengths. Scale bars = 1 mm.
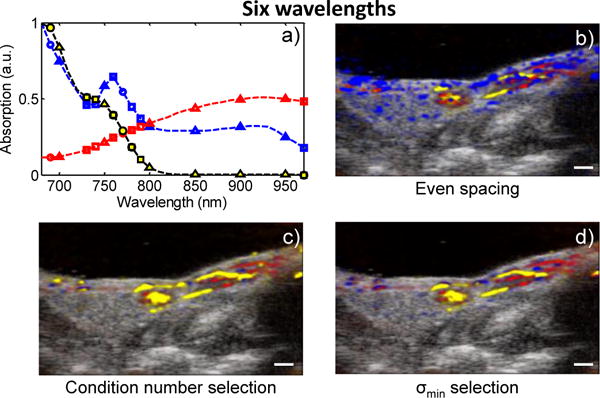
When we consider the case where six imaging wavelengths are used (Fig. 5), the evenly spaced wavelengths come much closer to capturing the spectral features (Fig. 5a, triangles). The wavelengths chosen by σmin and condition number selection tend to accumulate near the local maxima of deoxyhemoglobin at 760 nm (Fig. 5a, circles). Despite the fact that all methods appear to represent the spectral features, the evenly spaced wavelengths lead to a significantly different result (Fig. 5b–d). In fact, the RMS error in the sPA image generated from six evenly spaced wavelengths is more than twice the error in the sPA image generated from three wavelengths chosen by σmin selection (Fig. 3). This can be seen qualitatively in Fig. 5b and Fig. 4d.
Fig. 5.

(Color online) a) The spectra of the three absorbers with the six selected wavelengths using even spacing (triangles), condition number selection (squares), and σmin selection (circles), and the sPA images generated from b) the evenly spaced wavelengths, c) the condition number selected wavelengths, and d) the σmin-selected wavelengths. Scale bars = 1 mm.
Clearly, the two wavelength selection methods lead to better results than evenly spaced wavelengths. Interestingly, σmin selection outperformed the condition number selection. This stems from the way in which each of the two methods maintains the stability of ε. It can be shown that σmin provides a bound on the error in concentration estimate in the presence of noise:
| (2) |
where is the estimated concentrations from a noisy measurement, . Similarly, the condition number gives the following bound:
| (3) |
Therefore, large errors can result if the absorber exists in small concentrations (i.e., ‖μest‖ is small) if the condition number is used. These data presented here suggest that σmin is the more appropriate choice for in vivo sPA imaging.
An important factor to consider is that the fluence distribution in tissue varies as a function of optical wavelength and tissue composition. Therefore, there is no single “best” set of wavelengths; the optimal choice may change based on absorber concentrations, imaging depth, and even blood oxygen saturation. We previously showed that the wavelengths chosen by σmin selection are robust to large spectral distortion.[13] In addition, the set of wavelengths could be optimized for given imaging conditions if the light distribution is modeled and spectra which are scaled by the fluence at the site of interest are used for wavelength selection. Similar analysis was previously used for the case of Cramer-Rao lower bound wavelength selection.[12]
In summary, the choice of optical wavelengths plays a critical role in sPA imaging. By selecting wavelengths based on the spectral characteristics of the absorbers present in the tissue, the number of imaging wavelengths can be significantly reduced without degrading the sPA image. Indeed, this study shows that a contrast agent can be effectively localized in the presence of blood when as few as three wavelengths are used. The end result is that high quality sPA images can be acquired in a fraction of the time. This will aid in the effort for sPA imaging to become a real-time, clinically translatable imaging modality, replacing large, expensive tunable pulsed lasers with a set of fixed-wavelength lasers.
Acknowledgments
We would like to thank Dr. Carolyn Bayer of The University of Texas at Austin for her thorough analysis, in-depth discussion and valuable feedback on the manuscript. Funding for this work was provided in part by the National Institutes of Health grants R01CA149740, R01EB008101, and F31CA168168.
References
- 1.Mallidi S, Luke GP, Emelianov S. Photoacoustic imaging in cancer detection, diagnosis, and treatment guidance. Trends in Biotechnology. 2011;29:213–221. doi: 10.1016/j.tibtech.2011.01.006. [DOI] [PMC free article] [PubMed] [Google Scholar]
- 2.Luke GP, Yeager D, Emelianov SY. Biomedical applications of photoacoustic imaging with exogenous contrast agents. Ann Biomed Eng. 2012;40:422–437. doi: 10.1007/s10439-011-0449-4. [DOI] [PubMed] [Google Scholar]
- 3.Sethuraman S, Amirian JH, Litovsky SH, Smalling RW, Emelianov SY. Spectroscopic intravascular photoacoustic imaging to differentiate atherosclerotic plaques. Opt Express. 2008;16:3362–3367. doi: 10.1364/oe.16.003362. [DOI] [PubMed] [Google Scholar]
- 4.Wang B, Karpiouk A, Yeager D, Amirian J, Litovsky S, Smalling R, Emelianov S. In vivo Intravascular Ultrasound-guided Photoacoustic Imaging of Lipid in Plaques Using an Animal Model of Atherosclerosis. Ultrasound in medicine & biology. 2012 doi: 10.1016/j.ultrasmedbio.2012.08.006. [DOI] [PMC free article] [PubMed] [Google Scholar]
- 5.Jansen K, van der Steen AF, van Beusekom HM, Oosterhuis JW, van Soest G. Intravascular photoacoustic imaging of human coronary atherosclerosis. Opt Lett. 2011;36:597–599. doi: 10.1364/OL.36.000597. [DOI] [PubMed] [Google Scholar]
- 6.Kim S, Chen Y-S, Luke GP, Emelianov SY. In vivo three-dimensional spectroscopic photoacoustic imaging for monitoring nanoparticle delivery. Biomed Opt Express. 2011;2:2540–2550. doi: 10.1364/BOE.2.002540. [DOI] [PMC free article] [PubMed] [Google Scholar]
- 7.Homan KA, Souza M, Truby R, Luke GP, Green C, Vreeland E, Emelianov S. Silver Nanoplate Contrast Agents for in Vivo Molecular Photoacoustic Imaging. ACS Nano. 2012;6:641–650. doi: 10.1021/nn204100n. [DOI] [PMC free article] [PubMed] [Google Scholar]
- 8.Razansky D, Harlaar N, Hillebrands J, Taruttis A, Herzog E, Zeebregts C, van Dam G, Ntziachristos V. Multispectral Optoacoustic Tomography of Matrix Metalloproteinase Activity in Vulnerable Human Carotid Plaques. Molecular Imaging and Biology. 2011:1–9. doi: 10.1007/s11307-011-0502-6. [DOI] [PMC free article] [PubMed] [Google Scholar]
- 9.Levi J, Kothapalli S-R, Bohndiek S, Yoon J-K, Dragulescu-Andrasi A, Nielsen C, Tisma A, Bodapati S, Gowrishankar G, Yan X, Chan C, Starcevic D, Gambhir SS. Molecular Photoacoustic Imaging of Follicular Thyroid Carcinoma. Clinical Cancer Research. 2013;19:1494–1502. doi: 10.1158/1078-0432.CCR-12-3061. [DOI] [PMC free article] [PubMed] [Google Scholar]
- 10.Deán-Ben XL, Razansky D. Adding fifth dimension to optoacoustic imaging: volumetric time-resolved spectrally enriched tomography. Light: Science & Applications. 2014;3:137. [Google Scholar]
- 11.Xiao J, Yuan Z, He J, Jiang H. Quantitative multispectral photoacoustic tomography and wavelength optimization. Journal of X-ray science and technology. 2010;18:415–427. doi: 10.3233/XST-2010-0272. [DOI] [PubMed] [Google Scholar]
- 12.Modgil D, La Riviére PJ. Optimizing wavelength choice for quantitative optoacoustic imaging using the Cramer–Rao lower bound. Physics in medicine and biology. 2010;55:7231. doi: 10.1088/0031-9155/55/23/004. [DOI] [PubMed] [Google Scholar]
- 13.Luke GP, Nam SY, Emelianov SY. Optical wavelength selection for improved spectroscopic photoacoustic imaging. Photoacoustics. 2013;1:36–42. doi: 10.1016/j.pacs.2013.08.001. [DOI] [PMC free article] [PubMed] [Google Scholar]
- 14.Myers JN, Holsinger FC, Jasser SA, Bekele BN, Fidler IJ. An Orthotopic Nude Mouse Model of Oral Tongue Squamous Cell Carcinoma. Clinical Cancer Research. 2002;8:293–298. [PubMed] [Google Scholar]
- 15.Luke GP, Bashyam A, Homan KA, Makhija S, Chen Y-S, Emelianov SY. Silica-coated gold nanoplates as stable photoacoustic contrast agents for sentinel lymph node imaging. Nanotechnology. 2013;24:455101. doi: 10.1088/0957-4484/24/45/455101. [DOI] [PMC free article] [PubMed] [Google Scholar]


