

Abstract
Studies investigating the connection between environmental factors and migration are difficult to execute because they require the integration of microdata and spatial information. In this article, we introduce the novel, publically available data extraction system Terra Populus (TerraPop), which was designed to facilitate population-environment studies. We showcase the use of TerraPop by exploring variations in the climate-migration association in Burkina Faso and Senegal based on differences in the local food security context. Food security was approximated using anthropometric indicators of child stunting and wasting derived from Demographic and Health Surveys (DHS) and linked to the TerraPop extract of climate and migration information. We find that an increase in heat waves was associated with a decrease in international migration from Burkina Faso, while excessive precipitation increased international moves from Senegal. Significant interactions reveal that the adverse effects of heat waves and droughts are strongly amplified in highly food insecure Senegalese departments.
Keywords: Climate, environment, international migration, Burkina Faso, Senegal, food security, Terra Populus, Demographic and Health Survey (DHS)
Introduction
The study of the relationship between population dynamics and environmental factors requires detailed knowledge of demographic processes and geo-spatial phenomena. Discipline specific training often results in specialized knowledge to work with either household / population data, typically the realm of Sociologists and Economists, or geographically explicit data, typically the realm of Geographers and Earth-Systems scientists. A shortage of interdisciplinary training and collaboration has considerably hampered the progress in population and environment research (Hunter and O'Neill 2014).
The novel Terra Populus (TerraPop) data access system (Kugler et al. 2015) was designed specifically to facilitate this type of research through the integration of census-based microdata, area-level data describing geographic units, and raster-based spatial information such as climate and land use/land cover information. Moreover, the availability of geographic unit boundary shapefiles provides researchers with the flexibility to integrate contextual information from sources outside TerraPop, such as data on region-specific food security available through Demographic and Health Surveys (DHS).
The connection between climate change and migration has spurred widespread political and public interest and exemplifies the type of human-environment interaction requiring integrated population and spatial data. In response to fears of massive climate-related migration, especially from poor developing countries to rich industrialized nations (Myers 2002; Stern 2007), an increasing amount of quantitative research on the topic has recently emerged (Hunter et al. 2015; Ward and Shively 2015; Wodon et al. 2014). Despite the burgeoning research efforts, many questions remain unanswered. For example, it is unclear whether the climate- migration association is influenced by the local food security context.
In this research brief, we provide an introduction to the novel TerraPop data extract system and illustrate how TerraPop can be used to answer research questions such as: Do regions with low levels of food security show a stronger relationship between climate and international migration?
Climate, migration, and the food security context
Developing countries will suffer most from the adverse effects of climate change due to a lack of capacity and technology to guard against climate impacts (Gutmann and Field 2010). Adverse climate changes such as heat waves, droughts, and floods will have the strongest impacts on rural livelihoods that depend heavily on natural resources and the agricultural sector (Boyd and Ibarraran 2009; Wodon et al. 2014). In the face of livelihood insecurity, households may modify their mobility patterns in contrasting ways.
When climate variability and change leads to agricultural failure, households may choose to send a member elsewhere to access alternative income streams through remittances (Massey et al. 1993; McLeman 2006). An increase in international migration in response to adverse climate impacts has been observed for a number of countries predominantly in Latin America (Feng and Oppenheimer 2012; Gray and Bilsborrow 2013; Nawrotzki et al. 2015b).
In contrast, among extremely poor and marginalized populations adverse climate shocks may inhibit international migration and may “trap” people in place (Black et al. 2011b). An international move is often costly to initiate, and when adverse climate conditions undermine livelihoods, income generation, and employment options, households may lack the financial resources to send a member elsewhere. Confirming this dynamic, a decline in international migration in response to adverse climatic conditions has been observed in a number of African countries (Gray and Wise 2016; Henry et al. 2004).
The relationship between climate factors and migration emerges in a unique socioeconomic and geographic context. For example, the strongest relationships have been observed in rural areas (Feng and Oppenheimer 2012; Nawrotzki et al. 2015a), with historically dry climate conditions (Nawrotzki et al. 2013), in the absence of social networks (Nawrotzki et al. 2015b), and for land-poor households (Gray and Bilsborrow 2013). In combination these findings suggest that the strongest relationships between climate and migration exist among marginalized populations. A measure of marginalization not investigated so far is the local food security context.
Climate impacts such as droughts frequently lead to food insecurity and famines (Barbier et al. 2009; Baro and Deubel 2006), especially on the African continent under conditions of high agricultural dependence and a lack of technological infrastructure (e.g., irrigation). To regain food security, households may first employ in-situ (in place) adaptation strategies such as selling surplus items or drawing on formal and informal assistance (Gray and Mueller 2012a; Haile 2005). Concomitantly or when in-situ adaptation strategies have failed, households may attempt to regain food security by reducing expensive international moves (Henry et al. 2004) and increasing their allocation of labor to food production on the family farm to meet subsistence requirements (Ward and Shively 2015).
The connection between food-security, climate, and migration has been recognized (McGregor 1994; McMichael 2014) but not empirically tested. To begin filling this gap, we investigate whether climate variability is more strongly associated with international migration in highly food insecure regions of two west-African countries: Burkina Faso and Senegal. These two countries provide a useful case for the study of climate-migration and food security due to an established history of migration, widespread poverty and food insecurity, and an observed trend of warming and a reduction in rainfall (see Appendix A: Case).
Data – Introducing TerraPop
We obtained sociodemgraphic data and detailed climate information from the novel TerraPop data access system (Kugler et al. 2015; MPC 2013). TerraPop has developed a user-friendly extract engine that is publically available, free of charge at https://data.terrapop.org. TerraPop combines census microdata from IPUMS International (IPUMS-I) (MPC 2015; Ruggles et al. 2003), with area-level data describing geographic units, and raster data from various sources (e.g., MODIS). The three types of data are blended using location-based integration, allowing population researchers to easily discover and work with geographic data that typically requires specialized software and skills (e.g., analyzing spatial data in a GIS). Even for researchers familiar with multiple data structures, data collection, cleaning, processing, and transformation can consume significant amounts of time – around 40% of the total time spent on a typical modeling project (Munson 2011). By handling these issues, TerraPop allows researchers to spend more time on the substantive analysis that constitutes the core of research activity.
Within the TerraPop system, raster data (structured as a spatial grid of cells, with each cell having a value) are transformed to area-level data by summarizing the values of cells within geographic units. Area-level data are then attached to microdata records based on variables identifying the geographic unit in which the individual resides (Figure 1).1
Fig. 1. Attaching raster information to microdata through vector-raster overlay performed by TerraPop.
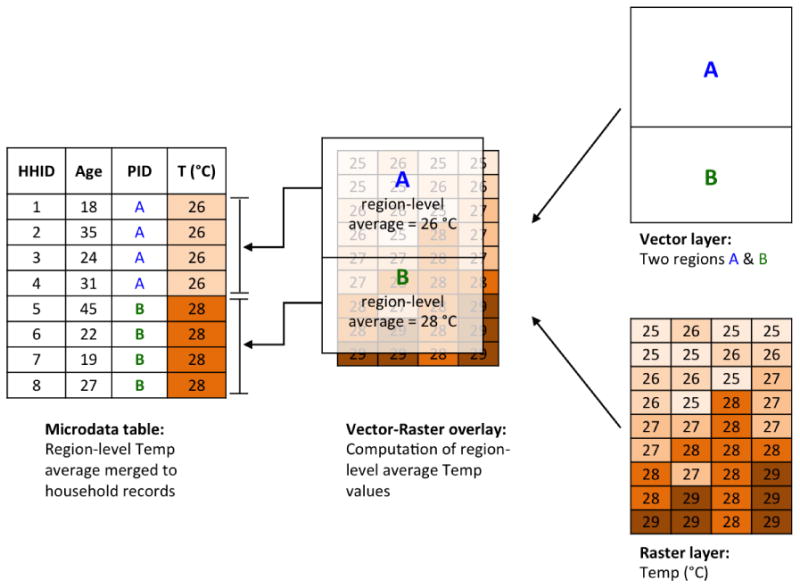
Notes: HHID = unique Household ID; PID = province ID; vector layers of regions at the 2nd administrative level are regionalized and harmonized prior to the vector-raster overlay operation (for details see Kugler et al., 2015); microdata records are available via IPUMS International (MPC, 2015; Ruggles et al. 2003) and contain province ID information that allow linking area-level aggregates to person and household records.
For this study we employ data at the second administrative level - provinces in Burkina Faso and departments in Senegal. The sociodemographic data were extracted for the most recent census rounds available via TerraPop, years 2006 and 2002 for Burkina Faso and Senegal, respectively. We restrict our analysis to rural households (agglomerations of less than 10,000 people), resulting in an analytical sample of n=164,884 (Burkina Faso) and n=57,052 (Senegal) households located in 45 provinces (Burkina Faso) and 31 departments (Senegal).
In addition to the sociodemographic information, the present study required detailed climate information. The climate information available via TerraPop came from the Climate Research Unit (CRU) of the University of East Anglia (Harris et al. 2014). The CRU data constitute a high-resolution (0.5 × 0.5 degrees) gridded data product of temperature (min, max) and precipitation that is available at monthly time steps for the years 1900 to 2013. The climate data and additional raster-based control variables were summarized to provinces/departments and attached to the microdata.
As a final core component for the present analysis we derived indicators of food security from the Demographic and Health Survey (DHS) phase IV for the year 2003 for Burkina Faso (DHS 2004) and the year 2005 for Senegal (DHS 2006).2 Information of the geographic location of villages (cluster points) available in the DHS data allowed us to link location-specific information on food security to the TerraPop data extract, as done in prior research (Sullivan Robinson et al. 2014). Fig. 2 shows the location of rural cluster points within the second-level administrative units in Burkina Faso and Senegal.3
Fig. 2. Location of rural DHS cluster points within second-level administrative units for Burkina Faso (a) and Senegal (b).
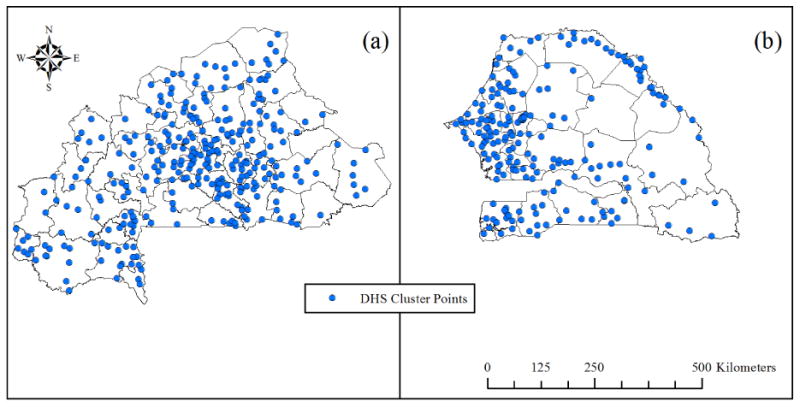
Notes: For the present analysis we aggregated DHS data from n=308 (Burkina Faso) and n=208 (Senegal) rural cluster points (villages) to n=45 provinces (Burkina Faso) and n=31 departments (Senegal).
Measures and Methods
Outcome variable
We chose the household as unit of analysis because the decision to migrate in the developing world is mostly reached within the family unit (Stark and Bloom, 1985; Massey et al., 1993). The census question asked respondents to indicate the number of people who left the household and moved to another country in the five years leading up to the census round. This variable was dichotomized and coded 1 for households that had at least one migrant and 0 otherwise. In our sample, about 10% of households in Burkina Faso and 11% of households in Senegal had sent a member to an international destination, with percentages varying by province/department (Fig. 3).
Fig. 3. Spatial distribution of migration prevalence across second-level administrative units in Burkina Faso (a) and Senegal (b).
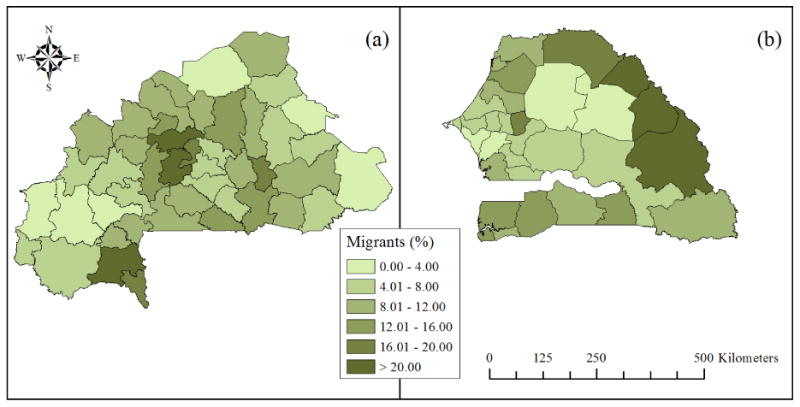
Note: Migrant prevalence is reflected as the percentage of households who have sent a migrant to an international destination within the five years leading up to the census.
Climate change
Agronomical research has shown that temperature and precipitation events above certain thresholds are more problematic for the agricultural sector than changes in average conditions (Lobell et al. 2013; Schlenker and Roberts 2009), and may therefore be more strongly associated with livelihood outcomes. We constructed a set of five climate measures using a threshold of one standard deviation, in line with prior work (Diffenbaugh et al. 2015). The climate measures capture percentage of months for which a threshold was surpassed during a relevant observation window. We use the five years prior to the census year during which migration was observed, plus one year to account for lagged effects, resulting in a six-year (71 months) observation window. A month was counted as surpassing the threshold if the relevant variable was more than one standard deviation above or below the 30-year (1961-1990) long-term average for the particular calendar month for the administrative unit.4 Thresholds considered were heat waves (maximum temperature), cold snap (minimum temperature), drought, and excessive precipitation. We constructed an additional measure, referred to as the climate impact index, which captures the simultaneous occurrence of drought and heat wave months. Heat waves and droughts exhibit distinct spatial patterning in both countries (Fig. 4).
Fig. 4. Spatial distribution of heat wave (top panels) and drought (bottom panels) occurrence during the 6-year period prior to the census for Burkina Faso (a, c) and Senegal (b, d).
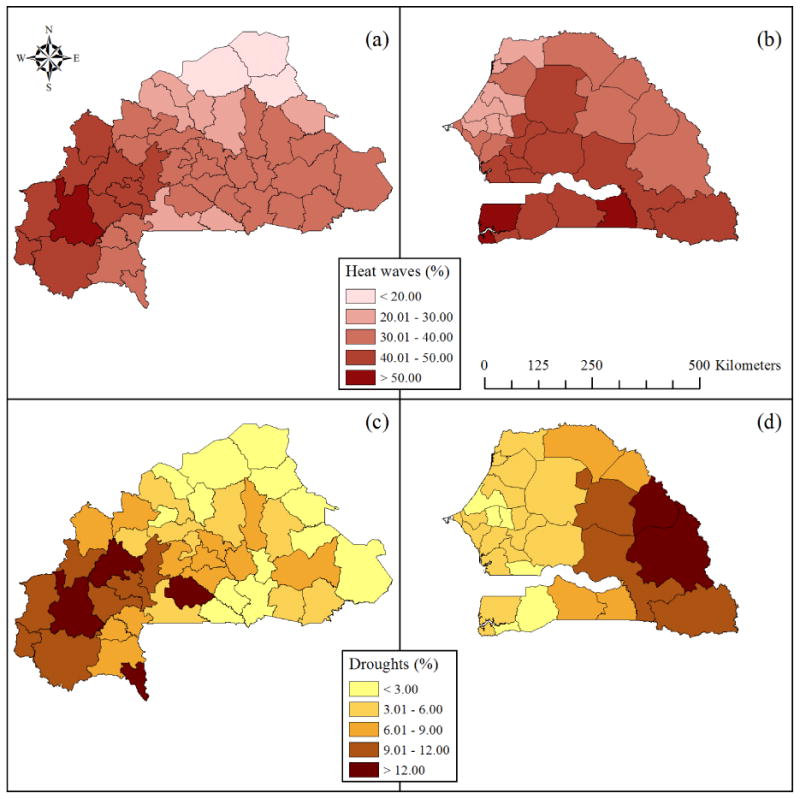
Note: Percentage of heat waves and droughts refers to the number of months during the 6-year (71 months) period, leading up to the census, during which temperature and precipitation were above/below a 1 SD threshold relative to the 30-year (1961-1990) long-term average.
Food security
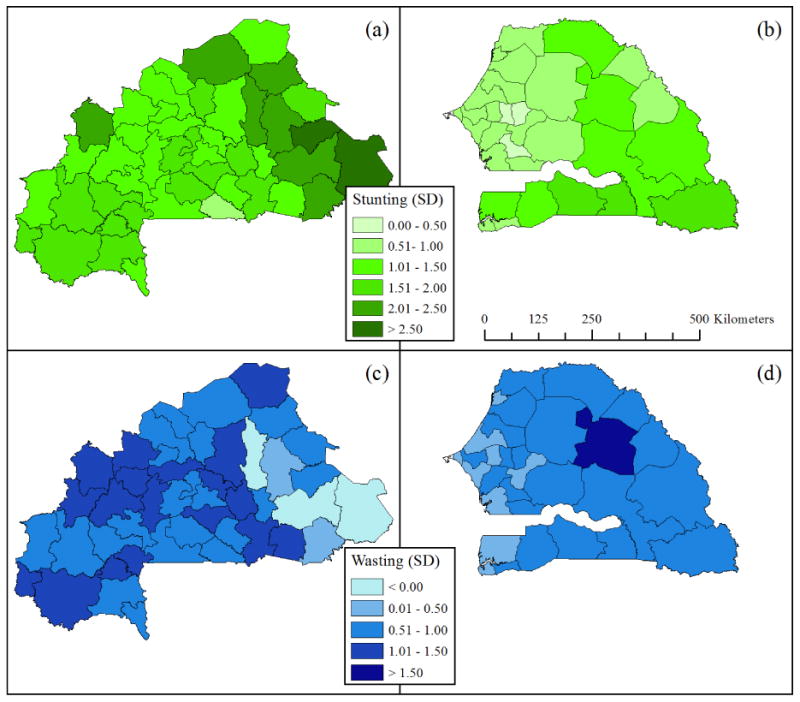
We use two anthropometric indices of child nutritional status available through DHS: child stunting and wasting. Physical growth of children under 5 years is an accepted indicator of the nutritional well-being of the population they represent (WFP and CDC 2005). Young children are particularly sensitive to reduced nutrient intake, which directly impacts their skeletal growth rates and overall health conditions (Black et al. 2008). To determine children's (age < 5 years) nutritional status, their weight and height was compared to a reference population of healthy children of the same sex and age (Brown et al. 2014; DHS 2008). The stunting measure was computed as the difference in the height of a child relative to the median height of a child in the reference group reflected in Z-scores (height-for-age; HAZ) (Waterlow et al. 1977; WHO 1983). Stunting indicates a chronic restriction of children's potential growth, resulting from long-term nutrition deficiencies and various health impacts (Black et al. 2008). The wasting measure compares the weight of a child to the median weight of children of the same height in the reference group reflected in Z-scores (weight-for-height; WHZ) (Waterlow et al. 1977; WHO 1983). Wasting measures acute weight loss, resulting from short-term food deficiencies and diseases (Black et al. 2008). We rescaled the stunting and wasting measures (multiplication by -1) so that higher Z-scores reflect more severe undernutrition (e.g., more stunting and wasting) for convenience of interpreting the regression coefficients. Using a geographical information system, we assigned each geo-referenced cluster point within the DHS sample to the respective province/department ID used in the TerraPop data. In a final step, we computed the population weighted average (mean) value of stunting and wasting for each province/department and merged the DHS data with our TerraPop data extract. Stunting and wasting result from a combination of inadequate dietary intake and other health impacts (e.g., diseases) and therefore measure food security only partially and indirectly. However, because of strong correlations of stunting and wasting with more direct measures of food security (Baig-Ansari et al. 2006; Saha et al. 2009), we refer to these measures as indicators of food security in the remainder of the text. In Senegal, stunting and wasting are generally more pronounced in eastern regions (Fig. 5). Burkina Faso shows highest stunting levels in southeastern provinces and high wasting levels in central-western regions.
Fig. 5. Spatial distribution of DHS-based anthropometric indicators of child stunting (top panels) and wasting (bottom panels) for Burkina Faso (a, c) and Senegal (b, d).
Household controls
The decision to migrate internationally is influenced by a plethora of sociodemographic and contextual factors (Brown and Bean 2006) and we account for these influences through various control variables (Table 1). We include the marital status (1=married, 0=other) and the religious affiliation (1=Muslim, 0=other) of the household head to capture differences in social capital based on access to extended family networks (Abu et al. 2014) and religious norms, expectations and sanctions (Smidt 2003) that may influence migration behavior. To capture human capital, we included a measure of the age of the household head (Booysen 2006), the percentage of household members with at least primary education (Taylor and Martin 2001), the percentage of household members employed (Nawrotzki et al. 2013), and the total number of persons in the household (Abu et al. 2014). Following the UN Population Division (UNPD 2012), we constructed the child (age < 15 years) and retiree (age > 64 years) dependency ratio as the proportion of household members in the particular age group relative to the total household size. Home ownership (1=owner) was included as measure of physical capital because migration is frequently used as means to access capital to fund the purchase of property or the construction of a home (Taylor et al. 1996). In addition, an additive wealth index, based on nine items (Chronbach's alpha: 0.74) was used as a measure of overall household wealth (Mberu 2006; Nawrotzki et al. 2013).5
Table 1. Descriptive statistics of variables employed in the analysis of the relationship between climate, migration, and the local food security context in Burkina Faso and Senegal.
| Unit | Min | Max | SD | Sample mean | ||
|---|---|---|---|---|---|---|
|
|
||||||
| BF | SN | |||||
| Outcome variable | ||||||
| Migrant HH | 1|0 | 0 | 1 | 0.30 | 0.10 | 0.11 |
| Household controls | ||||||
| Head married | 1|0 | 0 | 1 | 0.26 | 0.91 | 0.99 |
| Muslim | 1|0 | 0 | 1 | 0.46 | 0.60 | 0.96 |
| Age of head | years | 15 | 98 | 15.76 | 42.41 | 49.56 |
| Primary education | % | 0 | 100 | 13.55 | 4.01 | 5.98 |
| Child dep. ratio | % | 0 | 90 | 21.18 | 41.55 | 43.56 |
| Retiree dep. ratio | % | 0 | 100 | 12.55 | 4.41 | 4.60 |
| Employed in HH | % | 0 | 100 | 26.73 | 54.16 | 35.31 |
| Persons in HH | count | 1 | 99 | 5.06 | 6.35 | 10.32 |
| Home owner | 1|0 | 0 | 1 | 0.27 | 0.93 | 0.91 |
| Wealth index | count | 0 | 9 | 1.60 | 0.86 | 2.36 |
| Province/department controls | ||||||
| Network density | % | 0.37 | 27.95 | 6.89 | 12.05 | 4.38 |
| Urban land | % | 0 | 4.68 | 0.67 | 0.16 | 0.48 |
| Cotton/groundnuts | sqm/100ha | 0 | 42.71 | 6.40 | 0.72 | 6.70 |
| Baseline climate hot | 1|0 | 0 | 1 | 0.50 | 0.49 | 0.55 |
| Food security measures | ||||||
| Child stunting | z-score | 0.17 | 3.2 | 0.55 | 1.62 | 0.89 |
| Child wasting | z-score | -0.34 | 1.88 | 0.38 | 0.88 | 0.63 |
| Climate measures | ||||||
| Heat wave | % | 19.44 | 55.56 | 8.39 | 34.20 | 39.11 |
| Cold snap | % | 0 | 18.06 | 3.60 | 2.07 | 3.32 |
| Drought | % | 0 | 13.89 | 3.50 | 6.20 | 5.60 |
| Excess precip | % | 5.56 | 16.67 | 2.28 | 10.19 | 9.36 |
| Climate impact index | % | 9.72 | 34.03 | 5.14 | 20.20 | 22.36 |
| Sample size | ||||||
| Households | count | 164884 | 57052 | |||
| Provinces/departments | count | 45 | 31 | |||
Note: BF=Burkina Faso, SN=Senegal; Values for Min, Max, and SD refer to the complete sample.
Province/department controls
We approximated access to migrant networks as important predictor of future migration (Fussell and Massey 2004) by computing the percentage of households with international migration experience during the prior census round (Burkina Faso: 1996; Senegal: 1988). To capture access to urban infrastructure we used a measure of the percentage of urban land, based on MODIS urban extents (Schneider et al. 2009). To account for different levels of agricultural dependence we employed a measure of the area harvested (sqm/100ha) for cotton (Burkina Faso) and groundnuts (Senegal) as the crop types of primary economic importance (CIA 2014), constructed by the Global Landscape Initiative (GLI) (Monfreda et al. 2008). Finally, to account for the historical climatic context (Nawrotzki et al. 2013) we included a measure indicating whether the temperature in a given province/department was above or below the country average during the 30-year (1961-1990) baseline period.
Estimation strategy
We employed multilevel logit models to estimate the odds of a move to an international destination from a household i located within a province/department j (Equation 1).
Parameter b0 constitutes the conventional intercept term. Parameters b1 and b2 reflect the effect of food security (FSj) and climate (CLIMj) on the migration response. Due to high correlation among variables, only one climate and one food security measure at a time could be included in the model. Most important for the present study, the parameter b3 reflects the effect of the interaction between a given food security and climate measure (FSj * CLIMj). The summation term reflects the effects (b4, b5, …, bk) of various control variables (x4z, x5z, …, xkz), operating at the household and the province/department level, as indicated by the generic subscript z. Finally, the parameter uj constitutes the province/department random effects term, which accounts for the clustering of households within geographic regions.6
Results and Discussion
Controlling for various socioeconomic and contextual factors (for details see Appendix B: Base model), we observe no significant associations between the local food security context and migration probabilities (Table 2). For example, households residing in areas characterized by high versus low levels of stunting are similarly likely to send a member to an international destination.
Table 2. Impact of the local food security context and climate on the odds of international migration from rural households in Burkina Faso and Senegal.
| Burkina Faso | Senegal | |||
|---|---|---|---|---|
|
|
|
|||
| b | sig. | b | sig. | |
| Food security measures | ||||
| Child stunting | 0.80 | 0.67 | ||
| Child wasting | 1.20 | 0.84 | ||
| Climate measures | ||||
| Heat wave | 0.79 | * | 0.96 | |
| Cold snap | 0.96 | 0.97 | ||
| Drought | 1.01 | 0.70 | ||
| Excess precip | 1.02 | 3.37 | ** | |
| Climate impact index | 0.77 | 0.85 | ||
Notes: Coefficients reported in odds ratios; Coefficients of climate measures refer to an incremental change of 10%; Each estimate is derived from a separate model using all control variables (Appendix Table 4) and adding one food security or one climate measure at a time. Separate models were necessary due to high correlation among the climate and food security measures. A jack-knife type procedure was performed, removing one province/department at a time from the sample and re-estimating the models (Nawrotzki 2012; Ruiter and De Graaf 2006). This test demonstrated that the results were highly robust.
p<0.05;
p<0.01;
p<0.001
We also observe few significant climate effects in line with assumptions that influence of climate on migration is largely indirect in nature and therefore difficult to detect (Black et al. 2011a). Similar to a study using data from the African Migration and Remittances Surveys (Gray and Wise 2016), we observe that an increase in heat wave occurrence is associated with a decrease in international outmigration from Burkina Faso. When heat waves adversely impact agricultural production and livelihoods, the resource base of households may degrade, making it difficult to finance an expensive international move (Henry et al. 2004). In contrast, for Senegal we observe that an increase in precipitation is associated with an increase in international outmigration. In the arid climate of Senegal, above average precipitation is likely beneficial for the agriculture sector. An increase in agriculture-based income may enable households to finance an international move. Together, these findings suggest that international migration from Burkina Faso and Senegal increases under beneficial climatic conditions and decreases when conditions become less favorable (Nawrotzki and Bakhtsiyarava 2016). A similar directionality has been observed for rural South Africa where improved access to natural resources enabled outmigration (Hunter et al. 2014).
However, rather than focusing on main effects, the primary goal of this study was to investigate whether climate effects on international migration differ by the local food-security context. To test for conditional effects, we interacted the anthropometric measures of stunting and wasting with the climate measures (Table 3).
Table 3. Interaction between climate and food security in predicting the odds of international migration from rural households in Burkina Faso and Senegal.
| Burkina Faso | Senegal | |||||||||||
|---|---|---|---|---|---|---|---|---|---|---|---|---|
|
|
|
|||||||||||
| Clim | FS | Clim × FS | Clim | FS | Clim × FS | |||||||
| b | sig. | b | sig. | b | sig. | b | sig. | b | sig. | b | sig. | |
| Child stunting x climate | ||||||||||||
| Heat wave | 0.80 | * | 0.87 | 1.24 | 0.98 | 0.77 | 0.81 | |||||
| Cold snap | 1.00 | 0.80 | 1.10 | 0.93 | 0.66 | 0.75 | ||||||
| Drought | 1.12 | 0.93 | 2.30 | * | 0.82 | 0.74 | 0.34 | |||||
| Excess precip | 1.14 | 0.78 | 1.95 | 3.25 | * | 0.89 | 0.39 | |||||
| Climate impact index | 0.80 | 0.87 | 1.55 | 0.87 | 0.94 | 0.43 | ||||||
| Child wasting x climate | ||||||||||||
| Heat wave | 0.80 | * | 1.10 | 1.50 | 0.83 | 0.65 | 0.25 | ** | ||||
| Cold snap | 1.01 | 1.14 | 0.52 | 1.03 | 0.87 | 8.40 | ||||||
| Drought | 1.03 | 1.12 | 0.34 | 0.77 | 1.86 | 0.03 | ** | |||||
| Excess precip | 0.92 | 1.21 | 4.77 | 2.34 | 0.95 | 0.12 | ||||||
| Climate impact index | 0.78 | 1.16 | 1.29 | 0.64 | 0.85 | 0.05 | *** | |||||
Notes: Coefficients reported in odds ratios; Coefficients of climate measures refer to an incremental change of 10%; Clim = climate effects, FS = food security, Clim × FS = interaction between climate and food security; each row represents a fully adjusted multi-level model (Appendix Table 4) of which only the coefficients involved in the interaction are shown; variables were centered;
p<0.05;
p<0.01;
p<0.001
Significant interactions predominantly emerged for Senegal for climate and the food security indicators of child wasting. This suggests that the climate-migration relationship differs by the acute (short-term) rather than the chronic (long-term) nutritional status of the population. The interactions are significant for heat waves, droughts and the climate impact index and show generally a negative directionality.
We observe a similar shape of the interactions for heat waves, droughts, and the climate impact index (Fig. 6). In general, heat wave and drought occurrence is strongly associated with a decrease in migration probability in marginalized Senegalese departments characterized by high levels of child wasting (90th percentile, solid black line). However, the depressing effect of adverse climatic conditions on the probability to migrate weakens considerably in departments with average food security conditions (50th percentile, dashed line), and becomes even slightly positive in areas with very good food security conditions (10th percentile, dotted line). In short, the interactions suggest that adverse climate impacts are associated with a decline in international migration predominantly in highly food insecure regions. This finding is supported by earlier work, demonstrating that poverty may constrain migration in response to adverse environmental conditions (Gray and Mueller 2012b).
Fig. 6. Graphical representation of interaction between child wasting and heat wave (a), drought (b), and climate impact index (c) in predicting international migration from Senegal.
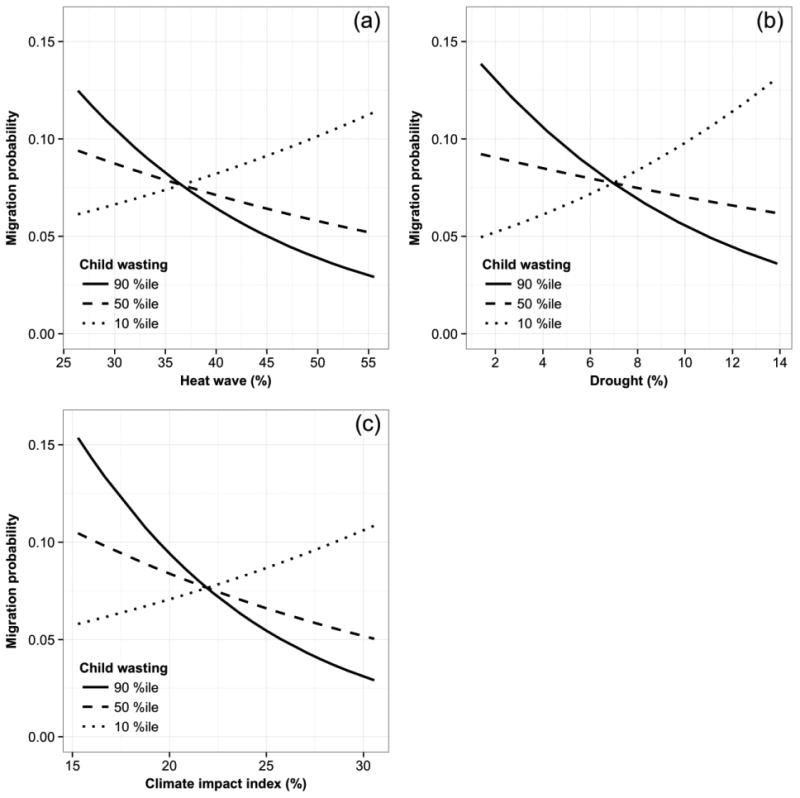
Notes: Graphs reflect predicted probabilities, using mean values on all control variables and only varying the measures involved in the interaction.
Conclusion
In this article we have introduced the novel TerraPop data access system and showcased its use with an example exploring the importance of the local food-security context for the climate-migration association. For this study we extracted microdata for Burkina Faso and Senegal linked to high-resolution climate information. In addition, TerraPop provides geographic unit boundary shapefiles that allow users to easily add external information, such as data from the Demographic and Health Survey (DHS), describing the health or nutritional status of the local population.
We find that an increase in heat waves was associated with a decrease in international outmigration from Burkina Faso, while an increase in precipitation increased in international outmigration from Senegal (Nawrotzki and Bakhtsiyarava 2016). These results suggest that international migration may increase under favorable climatic conditions but decrease under climate stress, possibly related to changes in resources available to finance an expensive international move (Henry et al. 2004). Moreover, interaction models revealed important conditional effects for Senegal: Heat waves and droughts were associated with a decrease in the probability of international migration predominantly in regions characterized by high levels of acute undernutrition (wasting).
However, a number of caveats should be considered. First, our anthropometric indicators of stunting and wasting measure food security only indirectly. Although stunting and wasting are strongly correlated with more direct measures of food security (Baig-Ansari et al. 2006; Saha et al. 2009), future research may validate our findings using dietary schedules and child feeding indices. Second, our food security measures operate at the regional level. Stronger interactions between climate and food security can be expected when household-specific indicators of food security are used. Third, we deliberately chose to investigate international migration based on data availability and the political and policy relevance of this migration stream. Exploring the interaction between climate variability and food security on domestic moves remains a topic for future research.
Our findings have important policy implications. Migration can be viewed as an important strategy of income diversification to adapt to climate change (Black et al. 2011b). Our results show that households in food insecure regions of Senegal are particularly vulnerable to become “trapped” in place and climate change adaptation programs should be targeted towards these communities. For example, programs to fund the installation of small-scale irrigation systems (Burney et al. 2013), distribution of heat and drought-resistant crop varieties, and improve access to seasonal weather forecasting tools (Cooper et al. 2008) may serve the dual benefit of reducing food insecurity and may improve household's resource base, enabling them to employ migration as an important strategy of livelihood diversification (Ward and Shively 2015) and climate adaptation (Black et al. 2011b). The Matam department of Senegal displays the highest levels of acute undernutrition (see dark blue center polygon of Fig. 5d) and may be a good candidate for the implementation of livelihood based climate adaptation programs.
The present study provides only one example of the type of population-environment research that can be performed with TerraPop data. Many other topics can be addressed, spanning the whole spectrum of household/individual population responses including fertility, mortality, family composition, socio-economic status, and gender differences, to mention just a few. Similarly, at the community-level a wealth of variables is available, capturing ecosystem services, land cover/land use, road networks, species distribution, vegetation indices and many other aspects of the natural and built environment. In addition, harmonized shapefiles enable longitudinal studies at the community level and allow the linking of spatial data sets that are not part of TerraPop. Because TerraPop is available to the public free-of-charge, it has the potential to become a primary source of population-environment data for demographers and other researchers, and will facilitate the growth of knowledge in this important field of study.
Acknowledgments
The authors gratefully acknowledge support from the Minnesota Population Center (5R24HD041023), funded through grants from the Eunice Kennedy Shriver National Institute for Child Health and Human Development (NICHD). In addition, this work received support from the National Science Foundation funded Terra Populus project (NSF Award ACI-0940818). The authors wish to acknowledge the statistical offices that provided the underlying data making this research possible: National Institute of Statistics and Demography, Burkina Faso and National Agency of Statistics and Demography, Senegal. We express our gratitude to Joshua Donato and David Haynes for help with the construction of the spatial variables. Special thanks to the journal editor and two anonymous reviewers for insightful comments and suggestions on earlier versions of this manuscript.
Appendix A: Case
Burkina Faso and Senegal are among the poorest countries of the world, ranking 181 (Burkina Faso), and 163 (Senegal) out of 187 on the human development index (UNDP 2014). In rural areas, households depend heavily on agricultural production for sustenance and income generation (Davis et al. 2007). In Burkina Faso about 90% and in Senegal about 78% of the labor force is employed in the agricultural sector (CIA 2014). The low development level and associated constraints in financial resources hinder the use of technology to guard against adverse climatic impacts (Gutmann and Field 2010). For example, only 0.2% and 1.3% of cropland is irrigated in Burkina Faso and Senegal, respectively (CIA 2014). The confluence of high agricultural dependence and low technological development renders households vulnerable to climate impacts.
Burkina Faso and Senegal are located in the semi-arid Sahelian region of Western Africa. Both countries are characterized by a distinct North-South gradient of temperature and precipitation (Grouzis et al. 1998; Hampshire and Randall 1999). While the northern Sahelian areas are generally hot and arid, the southern regions are relatively cooler and more humid, making farm production more lucrative (Henry et al. 2003; Henry et al. 2004). Since the 1960s, West Africa has experienced a long-term reduction in rainfall and a warming in temperatures (Funk et al. 2012; Nicholson 2001). These historical trends are projected to continue in future decades as a result of global climate change (Niang et al. 2014), making this region an important geographical location for the study of climate impacts on rural livelihoods.
Burkina Faso and Senegal have a rich history of diverse migration patterns within and across national boundaries. International outmigration is generally employment-related and most migration is directed to neighboring countries on the African continent. For Burkina Faso, the primary destinations include Nigeria, Ghana, and Ivory Coast (Arthur 1991), while Senegalese labor migrants often seek employment in Mauritania and Gabon but also in Italy and Spain (Plaza and Ratha 2011; Sinatti 2011). Due to employment in the manual construction and agricultural sectors, these labor migrant streams are characterized by a distinct demographic profile, largely comprised of young males (Henry et al. 2003; Plaza and Ratha 2011; Sinatti 2014). Labor migration is often temporary and circular in nature and migrants usually return to their village of origin after a saving target has been reached (Sinatti 2009).
Appendix B: Base model
Because international migration is a process influenced by various sociodemographic determinants (Brown and Bean 2006), our multivariate base model accounts for these factors (Table 4).
Table 4. Multilevel base model predicting the odds of international migration from rural households in Burkina Faso and Senegal.
| Burkina Faso | Senegal | |||
|---|---|---|---|---|
|
|
|
|||
| b | sig. | b | sig. | |
| Variables | ||||
| Intercept | 0.02 | *** | 0.01 | *** |
| Head married | 0.88 | *** | 1.10 | |
| Muslim | 0.76 | *** | 0.96 | |
| Age of head a | 0.96 | *** | 1.05 | *** |
| Primary education a | 0.94 | *** | 0.97 | * |
| Child dep. ratio a | 1.03 | *** | 0.97 | *** |
| Retiree dep. ratio a | 1.02 | * | 1.08 | *** |
| Employed in HH a | 1.02 | *** | 0.93 | *** |
| Persons in HH a | 1.09 | *** | 1.54 | *** |
| Home owner | 2.07 | *** | 1.64 | *** |
| Wealth index | 1.03 | *** | 1.39 | *** |
| Network density a | 2.01 | *** | 2.41 | ** |
| Urban land | 0.96 | 0.71 | * | |
| Cotton/groundnuts | 0.93 | 0.97 | ** | |
| Baseline climate hot | 1.29 | 1.32 | ||
| Model statistics | ||||
| Random intercept | 1.469 | 1.600 | ||
| BIC | 98406 | 33802 | ||
| N (households) | 164884 | 57052 | ||
| N (provinces/departments) | 45 | 31 | ||
Note: Coefficients reported in odds ratios;
Coefficients refer to an incremental change of 10 units; HH = household; Low values on the Variance Inflation Factor (VIF < 3.1) suggested that multi-collinearity did not bias the estimates;
p<0.05;
p<0.01;
p<0.001
The factors influencing international migration from Burkina Faso and Senegal show considerable similarity. In line with prior research from Ghana, South Africa, and Mexico, we find that the typical migrant household is relatively large (Abu et al. 2014), is relatively wealthy in terms of home ownership and physical assets (Hunter et al. 2014), and has good access to established migrant networks (Fussell and Massey 2004). In addition, an increase in the proportion of retirees was associated with higher odds of international migration, probably related to the added income from old-age pensions that may help finance an international move as demonstrated for rural South Africa (Schatz et al. 2012). Marital status and religious affiliation influence the odds of international migration from Burkina Faso but not from Senegal, with a lower probability of international migration from Muslim households in which the head was married, comparable to findings from rural Ethiopia and Mexico (Ezra and Kiros 2001; Riosmena 2009). In contrast, international migrants from Senegal are more likely to originate from regions with limited access to urban infrastructure and limited production of the primary crops. Finally, the directionality of the effect of age of the household head, child dependency ratio, and proportion of household members employed varied between countries as a result of the country-specific socio-political context.
Footnotes
Geographic unit boundaries are the key to TerraPop's location-based integration, and the system provides several types of boundaries to serve the needs of various users. For use with microdata, geographic units are regionalized to ensure that the population of each unit is greater than 20,000 people to maintain confidentiality. TerraPop also includes both harmonized and year-specific boundaries. In the harmonized boundaries, units that have changed over time are combined to provide consistent footprints facilitating the analysis of change over time (Kugler et al. 2015). For most countries, TerraPop provides first and second administrative level boundaries.
For Burkina Faso the DHS survey year (2003) falls within the 5-year window (2001-2006) prior to the census round in 2006. However, for Senegal the DHS survey was conducted in year 2005, three years after the census round in 2002. Although another full DHS survey was conducted in Senegal in 1997, this earlier wave did not include the relevant anthropometric indicators. We use the Senegal DHS for 2005 based on the common assumption that food security within a population is relatively static (Saha et al. 2009).
For confidentiality purposes, DHS randomly displaces rural cluster centroids between 0-5 km and an additional random selection of 10% of the cluster points between 0-10 km, resulting in a relatively small average displacement distance of 2.45 kilometers (Burgert et al. 2013). The random displacement algorithm ensures that centroids fall within the correct first-level administrative unit (Burgert et al. 2013). Although, we aggregate points to the second-level administrative unit, the introduced uncertainty is likely minimal due to the large size of provinces/departments (most clusters are more than 5 km away from the borders). In addition, the random nature of the displacement ensures that the resulting estimates are not systematically biased.
We use the years 1961-1990 as the standard “climate normal” period recommended by the World Meteorological Organization to be used as reference period for studies of climate change and climate variability (Arguez and Vose 2011).
The wealth index combined three measures of the quality of the housing unit (material of floor, wall, roof), three measures of the type and quality of services available at the residence (type of cooking fuel, toilet type, access to electricity), and three measures to capture the possession of appliances (car, refrigerator, TV).
The models were fit using the package lme4 (Bates 2010; Bates et al. 2014) within the R statistical environment (RCoreTeam 2015). For improved speed and more robust convergence properties, we adjusted the model settings (integer scalar setting nAGQ=0) so that the random and fixed effects were optimized (optimizer=”bobyqa”) in the penalized iteratively reweighted least squares step (Bates et al. 2014).
Contributor Information
Raphael J. Nawrotzki, Email: r.nawrotzki@gmail.com.
Allison M. Schlak, Email: schla300@umn.edu.
Tracy A. Kugler, Email: takugler@umn.edu.
References
- Abu M, Codjoe SNA, Sward J. Climate change and internal migration intentions in the forest-savannah transition zone of Ghana. Population and Environment. 2014;35(4):341–364. doi: 10.1007/s11111-013-0191-y. [DOI] [Google Scholar]
- Arguez A, Vose RS. The Definition of the Standard WMO Climate Normal The Key to Deriving Alternative Climate Normals. Bulletin of the American Meteorological Society. 2011;92(6):699–U345. doi: 10.1175/2010bams2955.1. [DOI] [Google Scholar]
- Arthur J. International labor migration patterns in west africa. African Studies Review. 1991;34(3):65–87. [Google Scholar]
- Baig-Ansari N, Rahbar MH, Bhutta ZA, Badruddin SH. Child's gender and household food insecurity are associated with stunting among young Pakistani children residing in urban squatter settlements. Food and Nutrition Bulletin. 2006;27(2):114–127. doi: 10.1177/156482650602700203. [DOI] [PubMed] [Google Scholar]
- Barbier B, Yacouba H, Karambiri H, Zorome M, Some B. Human Vulnerability to Climate Variability in the Sahel: Farmers' Adaptation Strategies in Northern Burkina Faso. Environmental Management. 2009;43(5):790–803. doi: 10.1007/s00267-008-9237-9. [DOI] [PubMed] [Google Scholar]
- Baro M, Deubel TF. Persistent hunger: Perspectives on vulnerability, famine, and food security in Sub-Saharan African. Annual Review of Anthropology. 2006;35:521–538. doi: 10.1146/annurev.anthro.35.081705.123224. [DOI] [Google Scholar]
- Bates DM. lme4: Mixed-effects modeling with R. New York: Springer; 2010. [Google Scholar]
- Bates DM, Maechler M, Bolker BM, Walker S. lme4: Linear mixed-effects models using Eigen and S4. Vienna, Austria: CRAN.R-project.org; 2014. [Google Scholar]
- Black R, Adger WN, Arnell NW, Dercon S, Geddes A, Thomas DS. The effect of environmental change on human migration. Global Environmental Change-Human and Policy Dimensions. 2011a;21:S3–S11. doi: 10.1016/j.gloenvcha.2011.10.001. [DOI] [Google Scholar]
- Black R, Bennett SRG, Thomas SM, Beddington JR. Migration as adaptation. Nature. 2011b;478(7370):447–449. doi: 10.1038/478477a. [DOI] [PubMed] [Google Scholar]
- Black RE, Allen LH, Bhutta ZA, Caulfield LE, de Onis M, Ezzati M, Rivera J. Maternal and child undernutrition: Global and regional exposures and health consequences. Lancet. 2008;371(9608):243–260. doi: 10.1016/s0140-6736(07)61690-0. [DOI] [PubMed] [Google Scholar]
- Booysen F. Out-migration in the context of the HIV/AIDS epidemic: evidence from the Free State Province. Journal of Ethnic and Migration Studies. 2006;32(4):603–631. [Google Scholar]
- Boyd R, Ibarraran ME. Extreme climate events and adaptation: an exploratory analysis of drought in Mexico. Environment and Development Economics. 2009;14:371–395. doi: 10.1017/s1355770x08004956. [DOI] [Google Scholar]
- Brown ME, Grace K, Shively G, Johnson KB, Carroll M. Using satellite remote sensing and household survey data to assess human health and nutrition response to environmental change. Population and Environment. 2014;36(1):48–72. doi: 10.1007/s11111-013-0201-0. [DOI] [PMC free article] [PubMed] [Google Scholar]
- Brown SK, Bean FD. International Migration. In: Posten D, Micklin M, editors. Handbook of population. New York: Springer Publishers; 2006. pp. 347–382. [Google Scholar]
- Burgert C, Colston J, Roy T, Zachary B. Geographic displacement procedure and georeferenced data release policy for the Demographic and Health Surveys. Calverton, MD: ICF International; 2013. [Google Scholar]
- Burney J, Naylor R, Postel S. The case for distributed irrigation as a development priority in sub-Saharan Africa. Proceedings of the National Academy of Sciences of the United States of America. 2013;110(31):12513–12517. doi: 10.1073/pnas.1203597110. [DOI] [PMC free article] [PubMed] [Google Scholar]
- CIA. The world factbook. Washington, DC: Central Intelligence Agency; 2014. [Google Scholar]
- Cooper PJM, Dimes J, Rao KPC, Shapiro B, Shiferaw B, Twomlow S. Coping better with current climatic variability in the rain-fed farming systems of sub-Saharan Africa: An essential first step in adapting to future climate change? Agriculture Ecosystems & Environment. 2008;126(1-2):24–35. doi: 10.1016/j.agee.2008.01.007. [DOI] [Google Scholar]
- Davis B, Winters P, Carletto G, Covarrubias K, Quinones E, Zezza A, DiGiuseppe S. Rural income generating activities: A cross country comparison. Washington, DC: World Bank; 2007. [Google Scholar]
- DHS. Enquete Demographique et de Sante Burkina Faso 2003 [Dataset: FR154] Ouagadougou, Burkina Faso: Institut National de la Statistique et de la Demographie Ministere de l'Economie ed du Developpement; 2004. [Google Scholar]
- DHS. Enquete Demographique et de Sante Senegal 2005 [Dataset: FR177] Dakar, Senegal: Ministere de la Sante et de la Prevention Medicale Centre de Recherche pour le Development Humain; 2006. [Google Scholar]
- DHS. Demographic and Health Survey: Description of the demographic and health surveys individual recode data file [DHS IV] Rockville, MD: ICF International; 2008. [Google Scholar]
- Diffenbaugh NS, Swain DL, Touma D. Anthropogenic warming has increased drought risk in California. Proceedings of the National Academy of Sciences of the United States of America. 2015;112(13):3931–3936. doi: 10.1073/pnas.1422385112. [DOI] [PMC free article] [PubMed] [Google Scholar]
- Ezra M, Kiros GE. Rural out-migration in the drought prone areas of Ethiopia: A multilevel analysis. International Migration Review. 2001;35(3):749–771. doi: 10.1111/j.1747-7379.2001.tb00039.x. [DOI] [PubMed] [Google Scholar]
- Feng S, Oppenheimer M. Applying statistical models to the climate-migration relationship. Proceedings of the National Academy of Science. 2012;109(43):E2915. doi: 10.1073/pnas.1212226109. [DOI] [PMC free article] [PubMed] [Google Scholar]
- Funk C, Rowland J, Adoum A, Eilerts G, Verdin J, White L. A climate trend analysis of Senegal. Reston, VA: US Geological Survey; 2012. [Google Scholar]
- Fussell E, Massey DS. The limits to cumulative causation: International migration from Mexican urban areas. Demography. 2004;41(1):151–171. doi: 10.1353/dem.2004.0003. [DOI] [PubMed] [Google Scholar]
- Gray CL, Bilsborrow R. Environmental Influences on Human Migration in Rural Ecuador. Demography. 2013;50:1217–1241. doi: 10.1007/s13524-012-0192-y. [DOI] [PMC free article] [PubMed] [Google Scholar]
- Gray CL, Mueller V. Drought and Population Mobility in Rural Ethiopia. World Development. 2012a;40(1):134–145. doi: 10.1016/j.worlddev.2011.05.023. [DOI] [PMC free article] [PubMed] [Google Scholar]
- Gray CL, Mueller V. Natural disasters and population mobility in Bangladesh. Proceedings of the National Academy of Sciences of the United States of America. 2012b;109(16):6000–6005. doi: 10.1073/pnas.1115944109. [DOI] [PMC free article] [PubMed] [Google Scholar]
- Gray CL, Wise E. Country-specific effects of climate variability on human migration. Climatic Change. 2016;135(3):555–568. doi: 10.1007/s10584-015-1592-y. [DOI] [PMC free article] [PubMed] [Google Scholar]
- Grouzis M, Diedhiou I, Rocheteau A. Legumes diversity and root symbioses on an aridity gradient in Senegal. African Journal of Ecology. 1998;36(2):129–139. [Google Scholar]
- Gutmann MP, Field V. Katrina in historical context: environment and migration in the US. Population and Environment. 2010;31(1-3):3–19. doi: 10.1007/s11111-009-0088-y. [DOI] [PMC free article] [PubMed] [Google Scholar]
- Haile M. Weather patterns, food security and humanitarian response in sub-Saharan Africa. Philosophical Transactions of the Royal Society B-Biological Sciences. 2005;360(1463):2169–2182. doi: 10.1098/rstb.2005.1746. [DOI] [PMC free article] [PubMed] [Google Scholar]
- Hampshire K, Randall S. Seasonal labour migration strategies in the Sahel: coping with poverty or optimising security? International Journal of Population Geography. 1999;5(5):367–385. doi: 10.1002/(sici)1099-1220(199909/10)5:5<367::aid-ijpg154>3.0.co;2-o. [DOI] [PubMed] [Google Scholar]
- Harris I, Jones PD, Osborn TJ, Lister DH. Updated high-resolution grids of monthly climatic observations - the CRU TS3.10 Dataset. International Journal of Climatology. 2014;34(3):623–642. doi: 10.1002/joc.3711. [DOI] [Google Scholar]
- Henry S, Boyle P, Lambin EF. Modelling inter-provincial migration in Burkina Faso, West Africa: the role of socio-demographic and environmental factors. Applied Geography. 2003;23(2-3):115–136. doi: 10.1016/j.apgeog.2002.08.001. [DOI] [Google Scholar]
- Henry S, Schoumaker B, Beauchemin C. The impact of rainfall on the first out-migration: A multi-level event-history analysis in Burkina Faso. Population and Environment. 2004;25(5):423–460. [Google Scholar]
- Hunter LM, Luna JK, Norton RM. Environmental dimensions of migration. Annual Review of Sociology. 2015;41:377–397. doi: 10.1146/annurev-soc-073014-112223. [DOI] [PMC free article] [PubMed] [Google Scholar]
- Hunter LM, Nawrotzki RJ, Leyk S, Maclaurin GJ, Twine W, Collinson M, Erasmus B. Rural outmigration, natural capital, and livelihoods in South Africa. Population, Space, and Place. 2014;20:402–420. doi: 10.1002/psp.1776. [DOI] [PMC free article] [PubMed] [Google Scholar]
- Hunter LM, O'Neill BC. Enhancing engagement between the population, environment, and climate research communities: the shared socio-economic pathway process. Population and Environment. 2014;35(3):231–242. doi: 10.1007/s11111-014-0202-7. [DOI] [PMC free article] [PubMed] [Google Scholar]
- Kugler TA, Van Riper DC, Manson SM, Haynes DA, Donato J, Stinebaugh K. Terra Populus: Workflows for integrating and harmonizing geospatial population and environmental data. Journal of Map and Geography Libraries. 2015;11(2):180–206. doi: 10.1080/15420353.2015.1036484. [DOI] [Google Scholar]
- Lobell DB, Hammer GL, McLean G, Messina C, Roberts MJ, Schlenker W. The critical role of extreme heat for maize production in the United States. Nature Climate Change. 2013;3(5):497–501. doi: 10.1038/nclimate1832. [DOI] [Google Scholar]
- Massey DS, Arango J, Hugo G, Kouaouci A, Pellegrino A, Taylor JE. Theories of international migration - A review and appraisal. Population and Development Review. 1993;19(3):431–466. [Google Scholar]
- Mberu BU. Internal migration and household living conditions in Ethiopia. Demographic Research. 2006;14:509–539. doi: 10.4054/DemRes.2006.14.21. [DOI] [Google Scholar]
- McGregor J. Climate-change and involuntary migration: Implications for food security. Food Policy. 1994;19(2):120–132. doi: 10.1016/0306-9192(94)90065-5. [DOI] [Google Scholar]
- McLeman RA. Migration out of 1930s - Rural Eastern Oklahoma insights for climate change research. Great Plains Quarterly. 2006;26(1):27–40. [Google Scholar]
- McLeman RA. Settlement abandonment in the context of global environmental change. Global Environmental Change. 2011;21:S108–S120. [Google Scholar]
- McMichael C. Climate change and migration: Food insecurity as a driver and outcome of climate change-related migration. In: Malik A, Ahtar R, Grohmann E, editors. Environmental deterioration and human health. New York: Springer; 2014. pp. 291–313. [Google Scholar]
- Monfreda C, Ramankutty N, Foley J. Farming the planet: 2. Geographic distribution of crop areas, yields, physiological types, and net primary production in the year 2000. Global Biogeochemical Cycles. 2008;22(1):1–19. doi: 10.1029/2007GB002947. [DOI] [Google Scholar]
- MPC. Terra Populus: Beta Version [Machine-readable database] Minneapolis, MN: Minnesota Population Center, University of Minnesota; 2013. [Google Scholar]
- MPC. Integrated Public Use Microdata Series, International: Version 6.3 [Machine-readable database] Minneapolis: University of Minnesota; 2015. [Google Scholar]
- Munson MA. A study on the importance of and time spent on different modeling steps. SIGKDD Explorations. 2011;13(2):65–71. [Google Scholar]
- Myers N. Environmental refugees: a growing phenomenon of the 21st century. Philosophical Transactions of the Royal Society of London Series B-Biological Sciences. 2002;357(1420):609–613. doi: 10.1098/rstb.2001.0953. [DOI] [PMC free article] [PubMed] [Google Scholar]
- Nawrotzki RJ. The politics of environmental concern: A cross-national analysis. Organization & Environment. 2012;25(3):286–307. doi: 10.1177/1086026612456535. [DOI] [PMC free article] [PubMed] [Google Scholar]
- Nawrotzki RJ, Bakhtsiyarava M. International climate migration: Evidence for the climate inhibitor mechanism and the agricultural pathway. Population, Space & Place. 2016:1–12. doi: 10.1002/psp.2033. in press. [DOI] [PMC free article] [PubMed] [Google Scholar]
- Nawrotzki RJ, Hunter LM, Runfola DM, Riosmena F. Climate change as migration driver from rural and urban Mexico. Environmental Research Letters. 2015a;10(11):114023. doi: 10.1088/1748-9326/10/11/114023. [DOI] [PMC free article] [PubMed] [Google Scholar]
- Nawrotzki RJ, Riosmena F, Hunter LM. Do rainfall deficits predict U.S.-bound migration from rural Mexico? Evidence from the Mexican census. Population Research and Policy Review. 2013;32(1):129–158. doi: 10.1007/s11113-012-9251-8. [DOI] [PMC free article] [PubMed] [Google Scholar]
- Nawrotzki RJ, Riosmena F, Hunter LM, Runfola DM. Amplification or suppression: Social networks and the climate change-migration association in rural Mexico. Global Environmental Change. 2015b;35:463–474. doi: 10.1016/j.gloenvcha.2015.09.002. [DOI] [PMC free article] [PubMed] [Google Scholar]
- Niang I, Ruppel OC, Abdrabo MA, Essel A, Lennard C, Padgham J, Urquhart P. Africa. In: Barros VR, Field CB, Dokken DJ, Mastrandrea MD, Mach KJ, Bilir TE, Chatterjee M, Ebi KL, Estrada YO, Genova RC, Girma B, Kissel ES, Levy AN, MacCracken S, Mastrandrea PR, White LL, editors. Climate Change 2014: Impacts, Adaptation, and Vulnerability. Part B: Regional Aspects. Contribution of Working Group II to the Fifth Assessment Report of the Intergovernmental Panel on Climate Change. Cambridge, United Kingdom: Cambridge University Press; 2014. pp. 199–1265. [Google Scholar]
- Nicholson SE. Climatic and environmental change in Africa during the last two centuries. Climate Research. 2001;17(2):123–144. doi: 10.3354/cr017123. [DOI] [Google Scholar]
- Plaza S, Ratha D. Diaspora for Development in Africa. Washington, DC: World Bank; 2011. [Google Scholar]
- RCoreTeam. R: A language and environment for statistical computing. Vienna, Austria: R Foundation for Statistical Computing; 2015. [Google Scholar]
- Riosmena F. Socioeconomic context and the association between marriage and Mexico-US migration. Social Science Research. 2009;38(2):324–337. doi: 10.1016/j.ssresearch.2008.12.001. [DOI] [PMC free article] [PubMed] [Google Scholar]
- Ruggles S, King ML, Levison D, McCaa R, Sobek M. IPUMS-International. Historical Methods. 2003;36(2):60–65. [Google Scholar]
- Ruiter S, De Graaf ND. National context, religiosity, and volunteering: Results from 53 countries. American Sociological Review. 2006;71(2):191–210. [Google Scholar]
- Saha KK, Frongillo EA, Alam DS, Arifeen SE, Persson LA, Rasmussen KM. Household food security is associated with growth of infants and young children in rural Bangladesh. Public Health Nutrition. 2009;12(9):1556–1562. doi: 10.1017/s1368980009004765. [DOI] [PubMed] [Google Scholar]
- Schatz E, Gomez-Olive X, Ralston M, Menken J, Tollman S. The impact of pensions on health and wellbeing in rural South Africa: Does gender matter? Social Science & Medicine. 2012;75(10):1864–1873. doi: 10.1016/j.socscimed.2012.07.004. [DOI] [PMC free article] [PubMed] [Google Scholar]
- Schlenker W, Roberts MJ. Nonlinear temperature effects indicate severe damages to US crop yields under climate change. Proceedings of the National Academy of Sciences of the United States of America. 2009;106(37):15594–15598. doi: 10.1073/pnas.0906865106. [DOI] [PMC free article] [PubMed] [Google Scholar]
- Schneider A, Friedl M, Potere D. A new map of global urban extent from MODIS satellite data. Environmental Research Letters. 2009;4(4):1–11. doi: 10.1088/1748-9326/4/4/044003. [DOI] [Google Scholar]
- Sinatti G. Home is where the heart abides: Migration, return and housing in Dakar, Senegal. Open House International. 2009;34(3):49–56. [Google Scholar]
- Sinatti G. ‘Mobile Transmigrants’ or ‘Unsettled Returnees’? Myth of Return and Permanent Resettlement among Senegalese Migrants. Population Space and Place. 2011;17(2):153–166. doi: 10.1002/psp.608. [DOI] [Google Scholar]
- Sinatti G. Masculinities and Intersectionality in Migration: Transnational Wolof Migrants Negotiating Manhood and Gendered Family Roles. In: Thanh-Dam T, Gasper D, Jeff H, Bergh S, editors. Migration, Gender and Social Justice. New York: Springer; 2014. pp. 215–226. [Google Scholar]
- Smidt C. Religion as social capital: Producing the common good. Waco, Texas: Baylor University Press; 2003. [Google Scholar]
- Stern N. Economics of climate change: The Stern review. Cambridge: Cambridge University Press; 2007. [Google Scholar]
- Sullivan Robinson R, Meier A, Trinitapoli J, Svec J. Integrating the Demographic and Health Surveys, IPUMS-I, and Terra Populus to explore mortality and health outcomes at the district level in Ghana, Malawi, and Tanzania. African Population Studies. 2014;28(2):917–926. doi: 10.11564/28-0-545. [DOI] [PMC free article] [PubMed] [Google Scholar]
- Taylor EJ, Martin PL. Human capital: Migration and rural population change. In: Gardner BL, Rausser GC, editors. Handbook of agricultural economics. Vol. 1. Amsterdam, The Netherlands: Elsevier Science; 2001. [Google Scholar]
- Taylor JE, Arango J, Hugo G, Kouaouci A, Massey DS, Pellegrino A. International migration and community development. Population Index. 1996;62(3):397–418. doi: 10.2307/3645924. [DOI] [PubMed] [Google Scholar]
- UNDP. Human development report 2014. New York, NY: United Nations Development Programme; 2014. [Google Scholar]
- UNPD. World Population Prospect (2012 Revisions): Glossary of Demographic Terms. New York, NY: United Nations, Department of Economic and Social Affairs, Population Division; 2012. [Google Scholar]
- Ward PS, Shively GE. Migration and Land Rental as Responses to Income Shocks in Rural China. Pacific Economic Review. 2015;20(4):511–543. doi: 10.1111/1468-0106.12072. [DOI] [Google Scholar]
- Waterlow JC, Buzina R, Keller W, Lane JM, Nichaman MZ, Tanner JM. The presentation and use of height and weight data for comparing the nutritional status of groups of children under the age 10 years. Bulletin of the World Health Organization. 1977;55(4):489–498. [PMC free article] [PubMed] [Google Scholar]
- WFP, & CDC. Measuring and interpreting malnutrition and mortality. Rome: Wold Food Programme; 2005. [Google Scholar]
- WHO. Measuring change in nutritional status. Geneva, Switzerland: World Health Organization; 1983. [Google Scholar]
- Wodon Q, Burger N, Grant A, Joseph G, Liverani A, Tkacheva O. Climate change, extreme weather events, and migration: Review of the literature for five Arab countries. In: Piguet E, Laczko F, editors. People on the move in a changing climate. New York, NY: Springer; 2014. pp. 111–135. [Google Scholar]