

Abstract
We hypothesized that skeletal muscle perfusion is impaired in peripheral arterial disease (PAD) patients compared to healthy controls and that perfusion patterns exhibit marked differences across five leg muscle compartments including the anterior muscle group (AM), lateral muscle group (LM), deep posterior muscle group (DM), soleus (SM), and the gastrocnemius muscle (GM). A total of 40 individuals (26 PAD patients, and 14 healthy controls) underwent contrast-enhanced magnetic resonance imaging (CE-MRI) utilizing a reactive hyperemia protocol. Muscle perfusion maps were developed for AM, LM, DM, SM, and GM. Perfusion maps were analyzed over the course of 2 minutes, starting at local pre-contrast arrival, to study early to intermediate gadolinium enhancement. PAD patients had a higher fraction of hypointense voxels at pre-contrast arrival for all five muscle compartments compared with healthy controls (p<0.0005). Among PAD patients, the fraction of hypointense voxels of the AM, LM, and GM were inversely correlated with the estimated glomerular filtration rate (eGFR; r= −0.509, p=0.008; r= −0.441, p=0.024; and r= −0.431, p=0.028, respectively). CE-MRI based skeletal leg muscle perfusion is markedly reduced in PAD patients compared with healthy controls and shows heterogeneous patterns across calf muscle compartments.
Keywords: peripheral artery disease, magnetic resonance imaging, microvascular circulation, image analysis
1. Introduction
Peripheral arterial disease (PAD) or lower-extremity (LE) arterial disease is associated with impaired leg muscle function, possible limb loss and an increased risk of atherothrombotic cardiovascular events and mortality.1, 2 Intermittent claudication (IC) is a classic PAD symptom occurring in 40% of symptomatic patients, and is associated with 5-, 10-, and 15-year mortality rates of 30%, 50%, and 70%, respectively.3 Typical endpoints in clinical PAD trials are ankle brachial index (ABI), quality of life questionnaires, and treadmill performance measures which have been shown to exhibit marked variability and limited reproducibility.4 Previous findings suggest that alterations in microcirculation due to a paucity of collateralization may contribute to functional impairment in PAD patients.5 Therefore, small vessel blood flow at the level of leg muscles may be of importance. Although in vivo measurements of the microvasculature is challenging, skeletal leg muscle perfusion may be a clinically important surrogate imaging marker of leg function in PAD.6 A limited number of PAD imaging studies have utilized MRI and ultrasonography to assess leg muscle perfusion.6–8 Calf muscle function during plantar flexion exercise has been studied previously with contrast-enhanced MRI (CE-MRI).9 However, perfusion analysis methods are not standardized and it is unknown whether skeletal leg muscle compartments exhibit different perfusion characteristics.
Reference regions have been utilized frequently to assess tissue characteristics in MR imaging. Yoshida et al.10 have utilized the sternocleidomastoid muscle on T1-weighted MRI scans as the reference regions for each patient to assess carotid artery plaque characteristics. Yuan et al.11 developed a method to identify carotid artery plaques as either hypo-, iso-, or hyperintense with respect to the nearby sternocleidomastoid muscle that served as a reference region for each carotid artery MRI scan. The implicit assumption of utilizing intra-scan reference regions is that the depicted area is not affected by the disease being studied. This assumption may not be valid in the case of lower extremity PAD which has been associated with fiber loss, increased levels of apoptosis and an increase in connective tissue that in turn affect the MR signal due to a lower spin density.12–14
First pass perfusion measurements have been incorporated in various imaging studies and tissue perfusion characteristics can be obtained by analyzing contrast signal-enhancement curves. Kim et al analyzed contrast enhanced MRIs of patients with prostate cancer to assess local tumor progression post high-intensity focused ultrasonic ablation.15 Changes in perfusion in manually selected regions of interest were assessed, among other parameters, by the wash-in slope that is denoted as the maximum slope between the time of onset of contrast inflow and the time of peak enhancement on the time signal intensity curve.15 Wu et al computed time-to-peak (TTP) in continuous arterial spin-labeling MRI scans from PAD patients and controls. TTP was measured starting from the time of cuff deflation to peak hyperemic flow in the calf muscle.8 Duerschmied et al analyzed calf muscle perfusion curves from PAD patients and controls who underwent contrast-enhanced ultrasound imaging.16 Perfusion was assessed post injection of 2.4 mL of SonoVue by randomly placing circular regions of interest with a diameter of 4 cm in the gastrocnemius and soleus muscles.
We sought to study for the first time skeletal leg muscle perfusion patterns separately for the five leg muscle compartments by incorporating physiological and fixed time points. We have developed a muscle perfusion MR imaging and analysis protocol to study microvascular perfusion patterns in the five leg muscle compartments including the anterior muscle group (AM), lateral muscle group (LM), deep posterior muscle group (DM), soleus muscle (SM), and the gastrocnemius muscle (GM). We hypothesized that microvascular perfusion can be measured with CE-MRI and will be heterogeneous in calf muscles of PAD patients compared with healthy controls. To this end, we have utilized a high resolution saturation recovery gradient echo (GRE) pulse sequence with adequate temporal resolution to measure perfusion changes following cuff-induced reactive hyperemia. Measurements were normalized in order to account for inter-patient differences in the time from cuff-deflation to contrast arrival in the leg. A novel perfusion analysis method has been implemented to obtain reference regions by calculating ensemble means signal-time curves for each of the five calf muscle regions extracted from a set of contrast-enhanced MRI scans obtained in healthy controls without PAD. We have implemented an automated peak detection algorithm to identify physiological and fixed time points in the arterial input function taken from the most patent major leg artery during first-pass CE-MRI. The ensemble means algorithm and the time points from the arterial input function were incorporated to generate normalized voxel-based perfusion maps that quantify the fraction of hypointense, isointense, and hyperintense voxels in the mid-calf. The utilization of the novel perfusion maps was demonstrated in 26 PAD patients and 14 healthy controls.
2. Materials and Methods
2.1. Pilot Study Design and Patient Population
Male or non-pregnant female individuals 40 years of age and older with symptomatic lower extremity PAD were enrolled in this pilot study. PAD was indicated by a resting ankle brachial index (ABI) of <0.9. Patients were excluded if their estimated glomerular filtration rate (eGFR) ≤ 40mL/min/1.73.m2. Other exclusion criteria were contraindications to MRI, uncontrolled arrhythmias, or inability to provide informed consent. Patients were recruited at the vascular clinics at the Houston Methodist Hospital, Houston, TX. For control purposes, healthy volunteers underwent the same MR imaging protocol. A total of 40 individuals (26 PAD patients, and 14 healthy volunteers) were included in this study. Informed consent was obtained from all individual participants included in the study. The study was approved by the institutional review board.
2.2. Magnetic Resonance Imaging Protocol
Prior to imaging, a nurse placed a peripheral intravenous 22-gauge cannula in a cubital vein. Participants were positioned on the scanner table feet first in the supine position. Participants underwent MR perfusion imaging using a dedicated 36-element bilateral peripheral angio array coil on a 3.0T MRI system (Siemens, Magnetom Verio, Erlangen, Germany). Contrast enhanced (CE) MRI was performed at the mid-calf level. True fast imaging with steady-state precession (TrueFISP) localizers were acquired first (repetition [TR]= 9.02 ms, echo time [TE]= 3.93 ms, averages= 2, field of view [FOV]= 19.9×39.9 cm, bandwidth= 814 Hz/px; flip angle [FA]= 25°; matrix= 256×256).
Next, a state of reactive hyperemia was induced by 3.5 minutes of suprasystolic inflation of a bilateral MRI compatible blood-pressure cuff positioned above the knee. Commercially available MRI compatible bilateral low-extremity cuffs and manometer were used during imaging (SmartTourniquet system, Topspins Inc., Ann Arbor, MI, USA). Maximum cuff pressures did not exceed 170 mmHg, depending on patient tolerability. Rapid cuff deflation lasting approximately 1–2 sec was synchronized with the administration of gadopentetate dimeglumine (Magnevist, Bayer Inc.), a Gadolinium-based contrast agent (0.2 mmol/kg, flow rate= 4ml/s) and a saline flush (20 ml at a rate of 4 ml/s). Immediately after cuff deflation, perfusion imaging was commenced using a high resolution saturation recovery gradient echo (GRE) pulse sequence (TR= 2.7 ms; TE= 1.23 ms; slice thickness (ST)= 10 mm; bandwidth= 1021 Hz/px; FA= 30°;FOV= 17.5×35.0 cm; matrix= 144×288, number of averages= 1). Perfusion images were acquired every 409 ms (temporal resolution). In contrast-enhanced MRI, regions of hypoperfusion are inidcated as dark areas (reduced signal intensity).17 Total imaging exam time was approximately 20–30 min.
2.3. Image Analysis
MRI images were saved in DICOM format and transferred to a workstation for offline processing. Five distinct leg muscle compartments including the i) anterior muscle group, ii) lateral muscle group, iii) deep posterior muscle group, iv) soleus muscle; and v) gastrocnemius muscle were semi-automatically segmented based on a muscle quantification algorithm and an in-house developed graphical user interface (GUI).18–20 The segmented region contours were smoothed using a level set algorithm with a weighting term for a curvature-based force.21 Figure 1 shows the segmentation of the 5 muscle groups. In order to calculate the muscle perfusion maps, arterial enhancement curves were analyzed and an ensemble (collective) means algorithm was implemented for each of the 5 distinct skeletal muscle groups signal intensities versus time curves (muscle perfusion curves), both of which are detailed next. The image analysis method has been detailed in part previously18, including intra- and inter-observer reproducibility, assessed with intraclass correlation coefficients (ICC) using a 2-way model (ICC>0.95, p<.0001, for images of good quality22).
Figure 1.
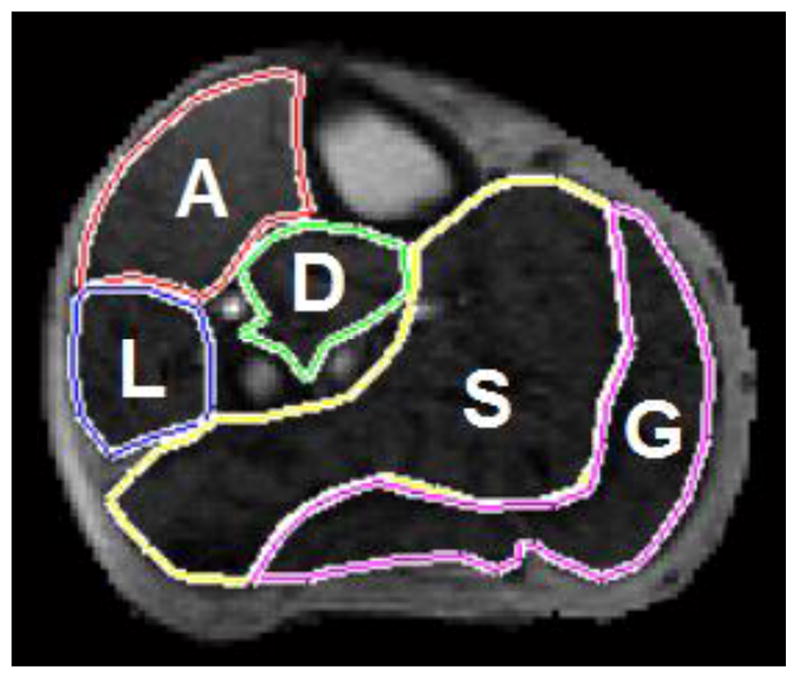
Leg muscle compartments.
CE-MRI image from a PAD patient showing the semi-automatically segmented leg muscle compartments: A=anterior muscle group; L=lateral muscle group; D=deep posterior muscle group; S=soleus; and G=gastrocnemius.
2.4. Muscle Perfusion Curves
The leg muscle contours were quantified in one CE-MRI frame and an image analysis algorithm automatically propagated the contours to all frames of the acquisition. Care was taken to correct for leg motion. The usage of a 90-cm bilateral coil which was strapped onto the table effectively limited leg motion during imaging. An in-house developed graphical user interface was utilized to segment each of the five calf muscle contours. Muscle signal intensity versus time curves were created for each of the 5 muscle compartments by calculating the mean signal intensity for every frame over the high resolution saturation recovery GRE pulse sequence. Specifically, let I(x, y)∈ R2, with x∈(1,2,...,X), and y∈(1,2,..., Y) be a raw DICOM slice and A be the number of intensity levels {α = 1,2,...,A}. Then the muscle perfusion analysis algorithm calculated the average signal by first smoothing each MRI slice by convolving I(x, y) with a Gaussian as
and variance ν. This iterative process provided for each muscle group a vector with a length equal to the number of frames with a temporal resolution of 409 ms. Subsequently, the perfusion curves of every muscle group were smoothed using a moving average filter based on local regression using weighted linear least squares and a first degree polynomial model. The smoothing method assigns zero weight to all data points outside the six mean absolute deviations. This robust version assigns lower weights to outliers in the regression. The span for the filter was 10% of the total number of measured data points. The filtering was implemented with the smooth function in MATLAB (MATLAB version 7.8, MathWorks Inc., Natick, MA). The robust filtering was used to avoid large outliers in each time series and the 10% filter-span was selected based on the 2 minute perfusion sequence length incorporated in the analysis which resulted in an adequate signal representation.
2.5. Extraction of Physiological Time Points
Perfusion maps were calculated for 5 distinct time points at pre-contrast arrival, peak arterial enhancement, first minimum post peak enhancement, at 1 minute, and at 2 minutes. These points were chosen to study skeletal muscle perfusion using reference time points measured directly in the more symptomatic leg. Time points were extracted from arterial signal enhancement curves (Figure 2). Specifically, the pre-contrast arrival time was determined visually as the frame before any arterial signal enhancement was visible. Peak arterial enhancement was determined from either the anterior tibial artery, posterior tibial artery, or peroneal artery, depending on signal enhancement, vessel patency, and by tracking the lumen of the most patent artery over the perfusion sequence. The first minimum post peak enhancement is located between the peak and the recirculation peak of the gadolinium bolus, as illustrated in Figure 2. The 1 and 2 minute time points were selected to study early to intermediate gadolinium enhancement. We chose physiological time points to account for variations including among others patient height, heart rate, and arterial disease. The one and two minute intervals were included to provide a frame of comparison with similar perfusion studies.7, 23 Figure 2 also shows the recirculation peak of the bolus that can be identified as the second smaller peak which was not always clearly present, especially in PAD patients. Therefore this physiology time point was not included in this analysis. The peak arterial signal and the first minimum post peak were automatically identified using an inhouse developed peak detection algorithm.24 Detected points were visually confirmed (Figure 2).
Figure 2.

Arterial signal enhancement curve.
Arterial signal enhancement from a healthy control (left panel) and a PAD patient (right panel). The markers on the curves represent the time points prior to contrast arrival, peak arterial enhancement, the minimum prior to the re-circulation peak, 1 minute and 2 minutes after the first marker.
2.6. Ensemble-Means Algorithm
In order to calculate perfusion maps illustrating hypo-, iso-, and hyperintense voxels, a set of reference values was required which were taken from muscle compartments of healthy controls. Due to potential variations across multiple controls, the muscle perfusion curves were averaged over all healthy controls using an automatic ensemble-means algorithm, a known methodology described previously by several groups including ours.24,25 Secondly, leg muscle groups contain both slow and fast twitch muscle fibers that are arranged in a mosaic-like pattern. For instance, the soleus muscle typically has a high percentage of slow twitch mitochondrial type I muscle fibers, whereas the gastrocnemius contains more fast twitch glycolytic type II muscle fibers.26 However, these percentages are known to vary across patients and may influence MR signal and therefore ensemble-means curves were calculated separately for all five muscle compartments. Briefly, the ensemble-means methodology permits averaging over discrete data points recorded over multiple frames and across subjects, taking into account different acquisition durations and varying temporal resolution of the acquired data, as detailed previously.24 The ensemble-means algorithm uses five distinct physiological time points including the pre-contrast arrival, peak arterial enhancement, the first minimum post peak enhancement, 1 minute, and 2 minutes to align and subsequently interpolate the muscle perfusion curves across subjects. The five resulting ensemble-means curves represent standardized post-reactive hyperemia muscle perfusion curves over the course of 2 minutes for healthy controls which were used as reference values, as detailed next (Supplemental Figure 1). The calculation of the ensemble-means curves was validated using leave-one-out cross-validation (LOOCV), a rigorous and computationally demanding iterative validation method, as described previously.18, 27 The muscle perfusion curves from one control at a time were left out, and the ensemble means curves were constructed with the remaining NC−1 observations, with NC being the number of controls. This iterative process was repeated with muscle perfusion curves from each control. The Dice similarity coefficient (DSC), a known metric to quantify differences between feature vectors or images, was used to quantify the similarity of the ensemble-means curves across the validation subsets.28, 29 The Dice coefficient is defined as: , where V1 and V2 are vectors, and ∩ is the symbol for the intersection.
2.7. Perfusion Maps
Perfusion maps were computed based on skeletal muscle voxels which were categorized as either hypointense ( ), isointense ( ), or as hyperintense ( ). The voxel categorization was based on muscle group specific reference values calculated from the ensemble-means perfusion curve of the healthy controls (Supplemental Table 1). Specifically, two reference values were calculated for each muscle group M ={AM, LM, DM,SM,GM} as and , where μM and σM are the mean and standard deviation for muscle group M, respectively. The thresholds were determined individually for each muscle group and every time point in the analysis to account for signal enhancement due to reactive hyperemia. The thresholds of mean ± 2 standard deviations to identify hypointense, isointense and hyperintense regions were based on reports from previous perfusion imaging studies.30–32 Each muscle voxel was categorized as either hypointense, isointense, and hyperintense in relation to the references values based on
| (1) |
In order to account for differences in area of muscle compartments (number of voxels) a histogram-based approach was taken. The histogram represents the distribution of the relative signal intensities for each muscle group with the added advantage of being robust against similarity transformations (motion artifacts) and signal fluctuations due to image noise. For each muscle group a histogram HM was calculated based on the respective signal intensity values of each voxel as
| (2) |
where BM denotes the number of bins for each histogram and M indicates the muscle group. The b-th bin for each histogram is defined as
| (3) |
where sij is used as a synonym for a voxel element of any one of the segmented five muscle regions. Although the algorithm can utilize different numbers of bins per muscle group, we used BM = 32 for all muscle groups which provides a robust and compact histogram representation. The voxel categorization was performed for the five time points (pre-contrast arrival, peak arterial enhancement, first minimum post peak enhancement, at 1 minute, and at 2 minutes) using the histogram representation and the reference values extracted from the muscle group specific ensemble-means perfusion curves from the healthy controls. The resulting perfusion feature vectors were normalized to represent hypo-, iso-, and hyperintense voxels as percentage values and perfusion maps were color-coded (Figures 3 and 4).
Figure 3.

CE-MRI of a healthy control: Time course post reactive hyperemia.
Time course of post reactive hyperemia contrast-enhancement MRI of a healthy control. Panels A–E show the time points prior to contrast arrival (panel A), peak arterial enhancement (panel B), the minimum prior to the re-circulation peak (panel C), 1 minute (panel D) and 2 minutes (panel E) after the first marker. Panels F–J show the respective perfusion maps for the five segmented muscle groups where blue indicate hypointense voxels, green represent isointense voxels, and red show hyperintense voxels. The lateral muscle compartment shows a higher fraction of hyperintense voxels over time whereas only few areas indicate hypointense voxels (A= anterior muscle group, L= lateral muscle group, S= soleus muscle, D= deep posterior muscle group, and G= gastrocnemius muscle).
Figure 4.

CE-MRI of a PAD patient: Time course post reactive hyperemia.
Time course of post reactive hyperemia contrast-enhancement MRI of PAD patient. Panels A–E show the time points prior to contrast arrival (panel A), peak arterial enhancement (panel B), the minimum prior to the re-circulation peak (panel C), 1 minute (panel D) and 2 minutes (panel E) after the first marker. Panels F–J show the respective perfusion maps for the five segmented muscle groups where blue indicate hypointense voxels, green represent isointense voxels, and red show hyperintense voxels. The soleus and gastrocnemius muscles show a high fraction of hypointense voxels over time indicating impaired skeletal muscle perfusion (A= anterior muscle group, L= lateral muscle group, S= soleus muscle, D= deep posterior muscle group, and G= gastrocnemius muscle).
2.8. Statistical Analysis
Variables were expressed as mean ± standard deviation, median (interquartile range [IQR]), percentages, or frequencies. Variable normality was assessed with the Shapiro-Wilk test. A p-value<0.05 was considered statistically significant and all tests were 2-sided. Differences in continuous normal variables were analyzed with independent samples Student’s T-statistic while the Mann-Whitney-Wilcoxon test was used for non-normally distributed independent samples. Group differences of categorical data were analyzed with the Chi-square test or the Fisher exact test. General linear models were used to assess associations between perfusion characteristics and ABI and eGFR. We also calculated Spearman correlation coefficients. The Spearman correlation coefficient (r) was calculated and the strength of correlations described as weak (r< 0.3), medium (0.3 ≤ r <0.5), or strong (r ≥ 0.5).33 The statistical analyses were performed with SAS 9.3.
Repeated measures analysis of covariance (ANCOVA) was used to compare between subjects effects for the fractions of hypo-, iso-, and hyperintense voxels over time. The sphericity assumption for the repeated measures ANCOVA models was checked using Mauchly’s criterion. When sphericity was violated, corrected p-values were reported using the conservative Greenhouse-Geisser (G-G) adjustment along with the G-G epsilon.
3. Results
3.1. Baseline Characteristics
PAD patients were older than the healthy controls (65.5 ± 10.1 years vs. 34.9 ± 5.0 years, p< 0.001) and had a higher BMI (29.05 ± 6.2 kg/m2 vs. 24.33 ± 4.5 kg/m2, p=0.016). There was no difference in gender between PAD patients and healthy controls (15 males (57.7%) vs. 9 males (64.3%), p= 0.68).
Among the 26 PAD patients, 11 (45.8%) presented with rest pain and 10 (38.5%) were diabetic (Table 1). PAD patients had an average ABI of 0.626 ± 0.18 in the more symptomatic leg and an eGFR of 71.9 ± 16.9 mL/min/1.73 m2. The imaging protocol required a bilateral cuff occlusion at moderate suprasystolic pressures for a period of 3.5 minutes. No adverse effects of the imaging protocol were observed in the presence of lower extremity stents and the cuff occlusion was well tolerated in patients with rest pain. Maximal cuff pressures of 170 mmHg were reached in all except one patient who presented with significant rest pain and cuffs were inflated to 145 mmHg for 3.5 minutes.
Table 1.
Baseline characteristics for PAD patients.
| Variable | PAD (n=26) | Controls (n=14) |
|---|---|---|
| Gender, [no. males] | 15 (57.7) | 9 (64.3%) |
| Age [years] | 65.5 (10.1) | 34.9 (5.0) |
| BMI [kg/m2] | 29.0 (6.2) | 24.33 (4.5) |
| ABI of more symptomatic side | 0.626 (0.18) | N/A |
| eGFR [mL/min/1.73 m2] | 71.9 (16.9) | N/A |
| Diabetes, no. (%) | 10 (38.5) | 0 (0.0) |
| Hypertension, no. (%) | 25 (96.2) | 0 (0.0) |
| Current smoker, no. (%) | 10 (38.5) | 0 (0.0) |
| Claudication, no. (%) | 23 (88.5) | 0 (0.0) |
| Rest Pain, no. (%) | 11 (45.8) | 0 (0.0) |
| Non-Healing Wound, no. (%) | 5 (19.2) | 0 (0.0) |
| Coronary Artery Disease, no. (%) | 12 (46.2) | 0 (0.0) |
| Cerebrovascular Disease, no. (%) | 0 (0) | 0 (0.0) |
| Hyperlipidemia, no. (%) | 22 (84.6) | 0 (0.0) |
| Revascularization History, no. (%) | 20 (76.9) | 0 (0.0) |
| ACE-Inhibitor, no. (%) | 8 (30.8) | 0 (0.0) |
| Anti-Platelet, no. (%) | 18 (69.2) | 0 (0.0) |
| Statin, no. (%) | 21 (80.8) | 0 (0.0) |
| Beta Blocker, no. (%) | 13 (50.0) | 0 (0.0) |
| Anti-Coagulation, no. (%) | 9 (34.6) | 0 (0.0) |
ACE=angiotensin-converting-enzyme. eGFR=estimated glomerular filtration rate. Values are reported as mean (standard deviation) or as number (percentage). N/A: not applicable: controls presented without history of impaired kidney function or atherosclerosis.
3.2. Cross-Sectional Leg Measurements
Cross-sectional leg area at the mid-calf level was not different between PAD patients and healthy controls when adjusted for age and gender (93.75 ± 27.5 cm2 vs. 103.92 ± 20.4 cm2; ANCOVA: p= 0.38). Although the cross-sectional areas of the five individual muscle compartments were lower in PAD patients, these differences were not significant when adjusted for age and gender (AM: 7.88 ± 2.6 cm2 vs. 8.25 ± 2.2 cm2, p= 0.56; LM: 4.58 ± 1.6 cm2 vs. 4.68 ± 1.8 cm2, p=0.68; DM: 3.50 ± 1.5 cm2 vs. 3.52 ± 1.4 cm2, p=0.56; SM: 17.8 ± 6.6 cm2 vs. 20.0 ± 5.5cm2, p=0.60; and GM: 15.9 ± 6.7 cm2 vs. 18.0 ± 3.5 cm2, p= 0.51).
3.3. Ensemble-Means Algorithm Validation
Image analysis experiments were conducted on a 2.83GHz 64-bit PC (Intel Quad Core Q9550, 8GB RAM). Image analysis was implemented in Matlab R2009a. Leave-one-out cross-validation was performed separately for the ensemble-means curves of the 5 muscle compartments. The averaged Dice similarity coefficients for the ensemble-means curves of the AM, LM, DM, SM, and GM compartments were 97.79%, 98.20%, 98.45%, 98.53%, and 96.02%, respectively.
3.4. Pre-Contrast Arrival Distribution of Hypointense, Isointense, and Hyperintense Voxels Across Muscle Compartments
PAD patients had a higher fraction of hypointense voxels at pre-contrast arrival for all five muscle compartments compared with healthy controls (AM: 20.3 ± 18.3% vs. 2.35 ± 2.4%; LM: 46.2 ± 26.3 % vs. 15.1 ± 15.2%; DM: 12.5 ± 14.9% vs. 2.54 ± 2.1%; SM: 26.3 ± 19.2% vs. 4.71 ± 7.4%; GM: 28.7± 20.0% vs. 10.6 ± 15.8%; ANCOVA: all p< 0.0005). These differences persisted when adjusted for pre-contrast arrival signal intensities of the muscle compartments and after further adjusting for age and gender, respectively (all p< 0.0003, all p< 0.044), except for AM which was marginally higher (p= 0.051).
The fraction of isointense voxels at pre-contrast arrival was significantly lower for AM, LM, SM, and GM in PAD patients compared with healthy controls (AM: 75.0 ± 7.6% vs. 80.2 ± 6.1%; LM: 60.2 ± 14.6% vs. 74.4 ± 10.4%; DM: 78.3 ± 6.2% vs. 81.6 ± 3.1%; SM: 73.0 ± 9.3% vs. 79.6 ± 7.5%; GM: 69.5 ± 10.0% vs. 76.5± 7.6%; ANCOVA: all p< 0.05 except DM: p= 0.08). When adjusted for pre-contrast arrival signal intensities, only LM remained significant (p=0.018) and there was a trend for GM (p= 0.051). Only the fraction of isointense voxels for DM in PAD patients was significantly lower in the fully adjusted model (p= 0.037).
Conversely, there were no significant differences in the unadjusted and fully adjusted models for the fraction of hyperintense voxels at pre-contrast arrival among all five muscle compartments (AM: 7.64 ± 13.0% vs. 13.8 ± 18.9%; LM: 12.8 ± 17.3% vs. 14.1 ± 21.6 %; DM: 7.18 ± 9.5% vs. 5.04 ± 14.8%; SM: 5.54 ± 6.7% vs. 8.86 ± 19.0%; GM: 15.0 ± 17.9% vs. 16.6 ± 21.0%; all not significant). However, LM, and DM had significantly lower fractions of hyperintense voxels in PAD patients compared to healthy controls when adjusted for pre-contrast arrival signal intensities (ANCOVA: p= 0.038, and p= 0.03, respectively).
3.5. Distribution of Hypointense Voxels Over 2 Minutes Post Reactive Hyperemia
In order to test the hypothesis that fractions of hypo-, iso-, and hyperintense voxels in the five leg muscle compartments measured post reactive hyperemia at 5 time points (pre contrast arrival, peak-arterial, first minimum post peak-arterial, at 1 minute, and at 2 minutes) differ overall between PAD patients and controls, we employed unadjusted and adjusted repeated measures ANCOVA models. Table 2 shows the time course from pre-contrast arrival to 2 minutes post contrast for the fraction of hypointense voxels which differed significantly overall for the five muscle groups between PAD patients and healthy controls (between subjects effects) for the unadjusted (all p< 0.007) and minimally adjusted models (all p<0.006), whereas in the fully adjusted model only LM (p= 0.0198) and DM (p= 0.0122) remained significantly different and there was a trend for AM (p= 0.0725, Figures 3 and 4).
Table 2.
Repeated measures ANCOVA models for fractions of hypointense voxels over time post reactive hyperemia for PAD patients and healthy controls.
| Muscle compartments | Groups | Hypointense voxel fractions over time [%] mean (STD) | P-values (overall group differences) | ||||||
|---|---|---|---|---|---|---|---|---|---|
| Pre-CA | Peak | First Min. | 1 minute | 2 minutes | Model 1 | Model 2 | Model 3 | ||
| Anterior | Controls | 2.35 (2.4) | 9.43 (11.3) | 5.18 (5.6) | 3.96 (5.8) | 1.30 1.5) | 0.0002 | 0.0055 | 0.0725 |
| PAD | 20.3 (18.3) | 31.7 (27.3) | 25.1 (26.0) | 23.3 (26.3) | 19.1 (23.9) | ||||
| Lateral | Controls | 15.1 (15.2) | 6.82 (7.4) | 5.68 (10.3) | 3.36 (5.7) | 12.4 (12.3) | <0.0001 | <0.0001 | 0.0198 |
| PAD | 46.2 (26.3) | 37.9 (26.3) | 29.2 (27.5) | 26.7 (25.6) | 46.7 (32.3) | ||||
| Deep Posterior | Controls | 2.54 (2.1) | 10.2 (6.9) | 5.13 (4.6) | 4.44 (4.2) | 5.88 8.5) | 0.0063 | <0.0001 | 0.0122 |
| PAD | 12.5 (14.9) | 30.2 (24.3) | 19.6 (23.1) | 18.2 (22.5) | 18.1 (27.1) | ||||
| Soleus | Controls | 4.71 (7.4) | 6.38 (9.4) | 10.9 (11.8) | 9.97 (9.2) | 5.47 (6.4) | 0.0003 | <0.0001 | 0.22 |
| PAD | 26.3 (19.2) | 30.8 (29.1) | 35.0 (30.8) | 36.3 (30.6) | 30.5 (29.0) | ||||
| Gastrocnemius | Controls | 10.6 (15.8) | 7.15 (11.4) | 4.45 (7.5) | 3.42 (5.9) | 2.66 (4.8) | 0.0004 | 0.0005 | 0.22 |
| PAD | 28.7 (20.0) | 24.3 (19.2) | 18.4 (18.3) | 17.7 (17.9) | 15.3 (16.3) | ||||
All values are means (standard deviations). PAD= peripheral arterial disease. P-values were calculated for group differences using repeated measures ANCOVA models. Model 1= unadjusted; Model 2= adjusted for muscle group specific median signal intensity prior to contrast arrival. Model 3= Model 2 + age and gender. Pre-CA= prior to contrast arrival; Peak= peak arterial enhancement; First Min.= minimum prior to the re-circulation peak; 1 minute, and 2 minutes after pre-CA.
Overall, there were significant differences between time points (within subjects’ effects) for all muscle groups (p< 0.002, using G-G correction, epsilon <0.7). These differences persisted for all muscle groups (p< 0.04, with G-G correction, epsilon <0.7) except for SM and there was trend for AM (p= 0.0668, G-G correction, epsilon= 0.55), when adjusted for pre-contrast arrival signal intensities. Differences between time points remained significantly different in the fully adjusted model for AM (p= 0.0329, G-G correction, epsilon= 0.58), and DM (p= 0.0237, G-G correction, epsilon= 0.72) and there was a trend for GM (p= 0.0848, G-G correction, epsilon= 0.37).
3.6. Distribution of Isointense Voxels Over 2 Minutes Post Reactive Hyperemia
The fraction of isointense voxels was significantly lower overall for the five muscle groups between PAD patients and healthy controls for the unadjusted repeated measures ANCOVA model (p< 0.05) and only for LM (p= 0.008) and DM (p= 0.02) among the minimally adjusted and fully adjusted models, respectively (Table 3). Overall, there were significant differences only between time points for AM in the fully adjusted model (p= 0.02, G-G correction, epsilon= 0.54) due to the bend occurring near the arterial peak (Figure 5). Moreover, differences among time points for all five muscle groups were significantly different in the unadjusted models (all p< 0.02, G-G correction, epsilon <0.66). Conversely, for the minimally adjusted models only time points for AM, LM, DM, and GM differed significantly (all p< 0.012, G-G correction, epsilon <0.65).
Table 3.
Repeated measures ANCOVA models for fractions of isointense voxels over time post reactive hyperemia for PAD patients and healthy controls.
| Muscle compartments | Groups | Isointense voxel fractions over time [%] mean (STD) | P-values (overall group differences) | ||||||
|---|---|---|---|---|---|---|---|---|---|
| Pre-CA | Peak | First Min. | 1 minute | 2 minutes | Model 1 | Model 2 | Model 3 | ||
| Anterior | Controls | 80.2 (6.1) | 77.3 (6.4) | 78.7 (4.2) | 77.8 (7.4) | 78.4 (7.1) | 0.031 | 0.14 | 0.12 |
| PAD | 75.0 (7.6) | 69.0 (13.6) | 71.4 (12.4) | 70.9 (12.2) | 71.9 (11.1) | ||||
| Lateral | Controls | 74.4 (10.4) | 76.4 (12.6) | 80.5 (3.9) | 79.2 (8.0) | 73.0 (15.6) | 0.002 | 0.0082 | 0.11 |
| PAD | 60.2 (14.6) | 65.0 (12.9) | 67.9 (14.5) | 68.5 (12.9) | 55.4 (18.3) | ||||
| Deep Posterior | Controls | 81.6 (3.1) | 78.5 (3.5) | 81.1 (1.3) | 79.7 5.6) | 76.8 (12.5) | 0.048 | 0.19 | 0.0164 |
| PAD | 78.3 (6.2) | 70.3 (12.1) | 73.2 (12.0) | 73.3 (12.0) | 70.7 (17.2) | ||||
| Soleus | Controls | 79.6 (7.5) | 80.4 (3.4) | 78.0 (4.0) | 76.8 (6.1) | 80.1 (4.5) | 0.002 | 0.085 | 0.15 |
| PAD | 73.0 (9.3) | 68.8 (15.1) | 62.8 (16.8) | 61.1 (16.4) | 67.5 (16.3) | ||||
| Gastrocnemius | Controls | 76.5 (7.6) | 79.7 (4.3) | 80.0 (3.3) | 79.6 (4.2) | 80.7 (3.4) | 0.0075 | 0.010 | 0.52 |
| PAD | 69.5 (10.0) | 72.0 (9.6) | 73.6 (8.5) | 73.6 (8.1) | 74.6 (7.0) | ||||
All values are means (standard deviations). PAD= peripheral arterial disease. P-values were calculated for group differences using repeated measures ANCOVA models. Model 1= unadjusted; Model 2= adjusted for muscle group specific median signal intensity prior to contrast arrival. Model 3= Model 2 + age and gender. Pre-CA= prior to contrast arrival; Peak= peak arterial enhancement; First Min.= minimum prior to the re-circulation peak; 1 minute, and 2 minutes after pre-CA.
Figure 5.

Fractions of hypointense, isointense, and hyperintense voxels post reactive hyperemia.
Fractions of hypointense (blue squares), isointense (green inverted triangles), and hyperintense voxels (red circles) over time post reactive hyperemia for PAD patients and healthy controls. Time course is shown for distinct times including prior to contrast arrival (pre-CA), peak arterial enhancement, the minimum prior to the re-circulation peak, 1 minute, and 2 minutes after the first marker. The time course shows heterogeneity across muscle groups (M.: muscle group/muscle). All values are means and standard errors.
3.7. Distribution of Hyperintense Voxels Over 2 Minutes Post Reactive Hyperemia
For the hyperintense voxels no overall differences were observed for the unadjusted and fully adjusted models (all p> 0.1, Table 4). However, the fraction of hyperintense voxels of LM, SM, and GM were significantly lower (all p< 0.05) in PAD patients compared to controls when adjusted for pre-contrast arrival signal intensities. Similarly, there were significant differences overall between time points for all muscle groups (p< 0.006 using G-G correction epsilon <0.7), except for a marginal trend for GM (p= 0.057, G-G correction, epsilon <0.58). In contrast, none of these differences remained significant when adjusted for pre-contrast arrival signal intensities, except for SM, which was marginally different between time points (p= 0.058, G-G correction, epsilon= 0.42). When fully adjusted only DM was significantly different between time points (p= 0.03, G-G correction, epsilon= 0.56) and the marginal difference remained for SM p= 0.051, G-G correction, epsilon= 0.42) and there was a trend for AM (p= 0.079, G-G correction, epsilon= 0.37). There was no interaction of group by time course for hypo-, iso-, or hyperintense voxels (all p >0.05).
Table 4.
Repeated measures ANCOVA models for fractions of hyperintense voxels over time post reactive hyperemia for PAD patients and healthy controls.
| Muscle compartments | Groups | Hyperintense voxel fractions over time [%] mean (STD) | P-values (overall group differences) | ||||||
|---|---|---|---|---|---|---|---|---|---|
| Pre-CA | Peak | First Min. | 1 minute | 2 minutes | Model 1 | Model 2 | Model 3 | ||
| Anterior | Controls | 13.8 (18.9) | 15.1 (20.9) | 16.9 (22.4) | 20.2 (23.8) | 21.6 (24.8) | 0.43 | 0.068 | 0.31 |
| PAD | 7.64 (13.0) | 8.0 (12.7) | 13.4 (14.9) | 16.5 (19.3) | 20.1 (21.3) | ||||
| Lateral | Controls | 14.1 (21.6) | 15.2 (24.0 | 7.95 (13.6) | 14.4 (20.4) | 20.5 (23.2) | 0.99 | 0.0085 | 0.48 |
| PAD | 12.8 (17.3) | 12.8 (18.2) | 12.5 (21.5) | 15.8 (22.9) | 17.8 (24.2) | ||||
| Deep Posterior | Controls | 5.04 (14.8) | 11.6 (16.0) | 7.95 (10.2) | 13.5 (18.4) | 18.0 (21.7) | 0.73 | 0.0875 | 0.89 |
| PAD | 7.18 (9.5) | 6.29 (11.6) | 12.8 (16.5) | 15.4 (18.1) | 21.9 (19.3) | ||||
| Soleus | Controls | 8.86 (19.0) | 12.4 (9.0) | 17.2 (12.1) | 22.2 (16.3) | 10.4 (15.0) | 0.56 | 0.0038 | 0.18 |
| PAD | 5.54 (6.7) | 12.8 (9.6) | 22.5 (19.8) | 17.1 (14.8) | 15.0 (17.9) | ||||
| Gastrocnemius | Controls | 16.6 (21.0) | 14.0 (11.9) | 18.4 (13.6) | 21.1 (15.6) | 15.7 (15.4) | 0.85 | 0.046 | 0.52 |
| PAD | 15.0 (17.9) | 15.1 (14.9) | 19.7 (17.3) | 20.4 (18.6) | 20.2 (19.6) | ||||
All values are means (standard deviations). PAD= peripheral arterial disease. P-values were calculated for group differences using repeated measures ANCOVA models. Model 1= unadjusted; Model 2= adjusted for muscle group specific median signal intensity prior to contrast arrival. Model 3= Model 2 + age and gender. Pre-CA= prior to contrast arrival; Peak= peak arterial enhancement; First Min.= minimum prior to the re-circulation peak; 1 minute, and 2 minutes after pre-CA.
3.8. Amount of Hypointense Voxels in PAD Patients Correlates Inversely With eGFR
Among PAD patients, the percentage of hypointense pixels at pre-contrast arrival of the AM, LM, and GM were significantly inversely correlated with eGFR (r= −0.509, p= 0.008; r= −0.441, p= 0.024; and r= −0.431, p= 0.028, respectively), but not for SM (r= −0.306, p= 0.13) while there was an inverse trend for DM (r= −0.373, p= 0.06). Conversely, there were no significant correlations with eGFR for the respective percentages of isointense voxels and for the percentages of hyperintense voxels of the LM, SM, and GM. However, the fractions of hyperintense voxels of the AM and DM showed significant positive correlations with eGFR (r= 0.484, p= 0.0122, and r= 0.415, p= 0.0349, respectively). As expected, PAD patient age and eGFR were inversely correlated (Spearman r= −0.406, p= 0.0396). However, patient age did not correlate with any voxel fractions (Spearman, all not significant).
3.9. ABI of PAD Patients is not Correlated With Amount of Hypo-, Iso-, and Hyperintense Voxels
The ABIs of the more symptomatic leg in PAD patients did not show any significant correlations with fractions of hypo-, iso-, or hyperintense voxels (Spearman, all not significant).
4. Discussion
This study investigated skeletal leg muscle perfusion in five muscle compartments including the anterior muscle group, lateral muscle group, deep posterior muscle group, soleus, and the gastrocnemius muscles of PAD patients and healthy controls. Leg muscle perfusion and perfusion patterns were measured post reactive hyperemia by calculating over time hypointense, isointense, and hyperintese voxel fractions for each of the muscle compartments. There were three major findings of this study. Firstly, PAD patients compared to healthy controls had higher fractions of hypointense voxels in leg muscle compartments prior to contrast arrival, persisting for at least 2 minutes during early and intermediate gadolinium enhancement. These higher fractions of hypointense voxels indicate perfusion abnormalities which persisted for the between-group comparison when adjusted for pre-contrast signal intensities and remained significant further adjusting for age and gender for the lateral and deep posterior muscle compartments and there was a trend for the anterior muscle compartment.
Secondly, skeletal muscle perfusion showed marked differences post reactive hyperemia across leg muscle compartments as indicated by differing fractions of hypointense, isointense, and hyperintense voxels. Thirdly, among PAD patients, the fraction of hypointense voxels of the anterior and lateral muscle compartments and the gastrocnemius muscle are inversely correlated with the estimated glomerular filtration rate (r= −0.509, r= −0.441, r= −0.431, all p< 0.029). Conversely, hyperintense voxel fractions of the anterior and deep posterior muscle compartments were significantly positively correlated with eGFR (r= 0.484, p= 0.012, and r= 0.415, p= 0.035), while isointense voxel fractions were not associated with eGFR.
Taken together these results suggest that PAD patients compared with healthy controls have impaired skeletal muscle perfusion, which is in accordance with previous studies.7, 23 Previous studies have established a strong link between PAD and impaired leg muscle function. The results of our study suggest further that skeletal muscle perfusion abnormalities can be seen prior to contrast arrival and persist over the course of at least 2 minutes post reactive hyperemia. Moreover, these effects seem attenuated for the soleus and gastronemius muscles when adjusted for pre-contrast arrival signal intensities, age and gender.
Measurement of skeletal muscle perfusion during postischemic reactive hyperemia using contrast-enhanced MRI with a step-input function has been performed previously.23 Previous studies have suggested that signal enhancement and related slopes of relative signal intensities over time curves may be limited due to averaging over large areas of skeletal leg muscle.23 In fact, it is entirely possible to visualize co-located abnormal perfusion areas within a skeletal muscle compartment.23 Therefore, we implemented CE-MRI perfusion maps to visualize and analyze skeletal muscle perfusion on a voxel by voxel basis. Our study shows heterogeneity in muscle perfusion across leg muscle compartments in healthy controls as well as in PAD patients. Similar findings have been reported by Wu et al.34 whose study of 24 healthy subjects suggested that calf muscle perfusion heterogeneity could be attributed to differences in muscle fiber composition across leg muscles.
Isbell et al.9 studied leg muscle perfusion with CE-MRI in conjunction with a plantar flexion exercise protocol. However, MRI compatible plantar flexion devices are typically not available in clinical scanners. In contrast, in our study a state of reactive hyperemia was achieved with a lower extremity blood pressure cuff positioned above the knee that was released after being inflated to moderate supersystolic pressures for 3.5 minutes. This protocol was well tolerated by PAD patients including 50% of the study population who presented with rest pain and thus providing a potential option to assess muscle perfusion in patients who are unable to perform treadmill testing or other exercise-based imaging tests.
Functional impairment in PAD patients has also been investigated with ultrasound imaging. Lindner et al.7 studied stress-rest perfusion imaging of skeletal muscle in the lower extremity with contrast-enhanced ultrasound (CEU) to assess the severity of disease in 26 controls and 39 PAD patients, 19 of whom presented with type 2 diabetes mellitus. Perfusion was assessed in the gastrocnemius and soleus muscles at rest and after 2 min of calibrated plantar-flexion exercise. Disease severity defined by treadmill performance, was predicted best when combining diabetes status and either exercise blood flow or flow-reserve on CEU. In our study, we also measured perfusion in the gastrocnemius and soleus muscles over 2 minutes post contrast administration and additionally also in the anterior-, lateral-, and deep posterior muscle compartments. We also studied perfusion of skeletal leg muscle groups separately and found marked heterogeneous perfusion abnormalities suggesting localized and muscle group specific perfusion impairments. Future studies need to elucidate whether muscle perfusion heterogeneity is associated with or co-localized with changes in leg muscle capillary density or muscle fiber loss.5
The association of hypointense muscle voxel fractions with estimated glomerular filtration rate suggests that muscle perfusion, as measured by CE-MRI, maybe of interest to study microvascular disease. The average eGFR in our study was 71.9 ± 16.9 mL/min/1.73 m2 and 18 out of 26 PAD patients had an eGFR <90 mL/min/1.73 m2 indicating stage 2 chronic kidney disease. Previous studies have shown that a reduced glomerular filtration rate is associated with an increased risk of peripheral arterial disease.35 Moreover, GFR is not only a measure of renal disease but has been associated with cerebral small vessel disease and a host of diabetes related illnesses including retinopathy and neuropathy.36 Our findings suggest that MRI measured skeletal muscle perfusion is associated with eGFR, a marker of microvascular disease. Future studies will need to elucidate the underlying mechanism.
The lack of a correlation of the ABI with the muscle perfusion markers in PAD patients suggests that the MRI characteristics described in our study are independent measures of PAD. Our study utilized a blood pressure cuff positioned above the knee to induce a state of reactive hyperemia which allows perfusion imaging in PAD patients who cannot perform exercise due to rest pain and provides a potential alternative for clinics without access to MRI compatible exercise equipment. The reactive hyperemia protocol presented in this study, is in agreement with clinical practice in vascular laboratories which recommend that thigh-cuffs are inflated to supra-systolic pressure levels for approximately 3–5 minutes.37 Although some previous studies used target thigh-cuff pressures of up to 250 mmHg, we opted for lower pressure levels (170 mmHg), improving patient safety for PAD patients with rest pain, yet sufficiently high to induce a state of reactive hyperemia.38
Limitations
This study has limitations. Emerging MRI protocols such as arterial spin labeling (ASL) and blood oxygenation level-dependent (BOLD) have been used to assess microvascular perfusion.8, 39 These protocols are technically challenging and not yet widely available in the clinical setting.40 Vascular artifacts may be present which are associated with the inflow of labeled arterial blood into the arteries.40 Significant errors in perfusion measurements may occur in cases of leg motion, in-plane flow, or slow/impaired flow, which are commonly observed in PAD patients. This study used gadolinium and therefore patients with chronic kidney disease with an eGFR<40ml/min/1.73m2 cannot undergo the MRI protocol detailed herein. The 1-, and 2-minute time points were not physiologically motivated and therefore may not account for inter-patient differences due to heart rate, height and arterial disease status. Healthy controls were significantly younger than PAD patients. Plans are underway to study the natural variation of skeletal leg muscle perfusion in young and older individuals. Microvascular perfusion may also be impacted by other factors not limited to smoking status, physical activity, and hypertension, all of which have not been accounted for in the control group. Additional study is needed to assess the proposed imaging protocol in co-morbidity matched controls.
In conclusion, CE-MRI is a feasible technology to image skeletal muscle perfusion in the calf post reactive hyperemia in PAD patients. Skeletal leg muscle perfusion as measured with CE-MRI is markedly reduced in PAD patients compared with healthy controls. Muscle perfusion shows heterogeneous patterns across leg muscle compartments.
Supplementary Material
Ensemble means curve for the soleus muscle obtained from healthy controls. The ensemble means curve constitutes the reference to categorize hypointense, isointense, and hyperintense voxels in the study population.
Acknowledgments
We thank all study participants for their cooperation. This work was supported by The Methodist DeBakey Heart Research Award, Clinical Research Seed Grant from the Society for Vascular Surgery, and AHA Beginning Grant-in-Aid award (13BGIA16720014). Dr. Brunner is supported by an NIH K25 Career Development Award (K25HL121149).
Biographies
 Gerd Brunner, PhD is an Assistant Professor of Medicine at Baylor College of Medicine. Dr. Brunner is an expert in image processing and analysis, magnetic resonance imaging, and atherosclerosis.
 Jean Bismuth, MD is an Associate Professor at the DeBakey Heart & Vascular Center, Houston Methodist Hospital. Dr. Bismuth is a national expert in peripheral artery disease and cardiovascular surgery.
 Vijay Nambi, MD/PhD is an Associate Professor at Baylor College of Medicine. Dr. Nambi is a national expert in atherosclerosis, cardiovascular (CV) imaging, and CV risk prediction and prevention.
 Christie M. Ballantyne, MD is Professor and Chief of the Section of Cardiovascular Research at Baylor College of Medicine. Dr. Ballantyne is an international leader in atherosclerosis and lipidology.
 Addison A. Taylor, MD/PhD is Professor and Chief Division Hypertension-Clinical Pharmacology at Baylor College of Medicine. Dr. Taylor is an international expert in hypertension and vascular medicine.
 Alan B. Lumsden, MD is Professor and Chair Cardiovascular Surgery and Medical Director, Methodist DeBakey Heart & Vascular Center. Dr. Lumsden is an international leader in cardiovascular surgery.
 Joel D. Morrisett, PhD is a Distinguished Emeritus Professor at Baylor College of Medicine. Dr. Morrisett is an international expert in vascular magnetic resonance imaging and atherosclerosis.
 Dipan J. Shah, MD is an Associate Professor and Director of the Cardiovascular MRI Laboratory at the Houston Methodist Hospital. Dr. Shah is a national expert in cardiac MRI and preventive cardiology.
Footnotes
Conflicts of interest: none
Ethical approval: All procedures performed in studies involving human participants were in accordance with the ethical standards of the institutional and/or national research committee and with the 1964 Helsinki declaration and its later amendments or comparable ethical standards.
References
- 1.Lumsden AB, Rice TW, Chen C, Zhou W, Lin PH, Bray P, Morrisett J, Nambi V, Ballantyne C. Peripheral arterial occlusive disease: Magnetic resonance imaging and the role of aggressive medical management. World J Surg. 2007;31:695–704. doi: 10.1007/s00268-006-0732-y. [DOI] [PubMed] [Google Scholar]
- 2.Criqui MH, Langer RD, Fronek A, Feigelson HS, Klauber MR, McCann TJ, Browner D. Mortality over a period of 10 years in patients with peripheral arterial disease. N Engl J Med. 1992;326:381–386. doi: 10.1056/NEJM199202063260605. [DOI] [PubMed] [Google Scholar]
- 3.Dormandy JA, Rutherford RB. Management of peripheral arterial disease (pad). Tasc working group. Transatlantic inter-society consensus (tasc) J Vasc Surg. 2000;31:S1–S296. [PubMed] [Google Scholar]
- 4.Hiatt WR, Cox L, Greenwalt M, Griffin A, Schechter C. Quality of the assessment of primary and secondary endpoints in claudication and critical leg ischemia trials. Vasc Med. 2005;10:207–213. doi: 10.1191/1358863x05vm628oa. [DOI] [PubMed] [Google Scholar]
- 5.Robbins JL, Jones WS, Duscha BD, Allen JD, Kraus WE, Regensteiner JG, Hiatt WR, Annex BH. Relationship between leg muscle capillary density and peak hyperemic blood flow with endurance capacity in peripheral artery disease. J Appl Physiol. 2011;111:81–86. doi: 10.1152/japplphysiol.00141.2011. [DOI] [PMC free article] [PubMed] [Google Scholar]
- 6.Kramer CM. Skeletal muscle perfusion in peripheral arterial disease a novel end point for cardiovascular imaging. JACC Cardiovasc Imaging. 2008;1:351–353. doi: 10.1016/j.jcmg.2008.03.004. [DOI] [PMC free article] [PubMed] [Google Scholar]
- 7.Lindner JR, Womack L, Barrett EJ, Weltman J, Price W, Harthun NL, Kaul S, Patrie JT. Limb stress-rest perfusion imaging with contrast ultrasound for the assessment of peripheral arterial disease severity. JACC Cardiovasc Imaging. 2008;1:343–350. doi: 10.1016/j.jcmg.2008.04.001. [DOI] [PMC free article] [PubMed] [Google Scholar]
- 8.Wu WC, Mohler E, 3rd, Ratcliffe SJ, Wehrli FW, Detre JA, Floyd TF. Skeletal muscle microvascular flow in progressive peripheral artery disease: Assessment with continuous arterial spin-labeling perfusion magnetic resonance imaging. J Am Coll Cardiol. 2009;53:2372–2377. doi: 10.1016/j.jacc.2009.03.033. [DOI] [PMC free article] [PubMed] [Google Scholar]
- 9.Isbell DC, Epstein FH, Zhong X, DiMaria JM, Berr SS, Meyer CH, Rogers WJ, Harthun NL, Hagspiel KD, Weltman A, Kramer CM. Calf muscle perfusion at peak exercise in peripheral arterial disease: Measurement by first-pass contrast-enhanced magnetic resonance imaging. J Magn Reson Imaging. 2007;25:1013–1020. doi: 10.1002/jmri.20899. [DOI] [PMC free article] [PubMed] [Google Scholar]
- 10.Yoshida K, Narumi O, Chin M, Inoue K, Tabuchi T, Oda K, Nagayama M, Egawa N, Hojo M, Goto Y, Watanabe Y, Yamagata S. Characterization of carotid atherosclerosis and detection of soft plaque with use of black-blood mr imaging. AJNR Am J Neuroradiol. 2008;29:868–874. doi: 10.3174/ajnr.A1015. [DOI] [PMC free article] [PubMed] [Google Scholar]
- 11.Yuan C, Mitsumori LM, Ferguson MS, Polissar NL, Echelard D, Ortiz G, Small R, Davies JW, Kerwin WS, Hatsukami TS. In vivo accuracy of multispectral magnetic resonance imaging for identifying lipid-rich necrotic cores and intraplaque hemorrhage in advanced human carotid plaques. Circulation. 2001;104:2051–2056. doi: 10.1161/hc4201.097839. [DOI] [PubMed] [Google Scholar]
- 12.Regensteiner JG, Wolfel EE, Brass EP, Carry MR, Ringel SP, Hargarten ME, Stamm ER, Hiatt WR. Chronic changes in skeletal muscle histology and function in peripheral arterial disease. Circulation. 1993;87:413–421. doi: 10.1161/01.cir.87.2.413. [DOI] [PubMed] [Google Scholar]
- 13.Mitchell RG, Duscha BD, Robbins JL, Redfern SI, Chung J, Bensimhon DR, Kraus WE, Hiatt WR, Regensteiner JG, Annex BH. Increased levels of apoptosis in gastrocnemius skeletal muscle in patients with peripheral arterial disease. Vasc Med. 2007;12:285–290. doi: 10.1177/1358863X07084858. [DOI] [PubMed] [Google Scholar]
- 14.Hedberg B, Angquist KA, Henriksson-Larsen K, Sjostrom M. Fibre loss and distribution in skeletal muscle from patients with severe peripheral arterial insufficiency. Eur J Vasc Surg. 1989;3:315–322. doi: 10.1016/s0950-821x(89)80067-2. [DOI] [PubMed] [Google Scholar]
- 15.Kim CK, Park BK, Lee HM, Kim SS, Kim E. Mri techniques for prediction of local tumor progression after high-intensity focused ultrasonic ablation of prostate cancer. AJR Am J Roentgenol. 2008;190:1180–1186. doi: 10.2214/AJR.07.2924. [DOI] [PubMed] [Google Scholar]
- 16.Duerschmied D, Olson L, Olschewski M, Rossknecht A, Freund G, Bode C, Hehrlein C. Contrast ultrasound perfusion imaging of lower extremities in peripheral arterial disease: A novel diagnostic method. Eur Heart J. 2006;27:310–315. doi: 10.1093/eurheartj/ehi636. [DOI] [PubMed] [Google Scholar]
- 17.Arai AE. Magnetic resonance first-pass myocardial perfusion imaging. Top Magn Reson Imaging. 2000;11:383–398. doi: 10.1097/00002142-200012000-00007. [DOI] [PubMed] [Google Scholar]
- 18.Brunner G, Nambi V, Yang E, Kumar A, Virani SS, Kougias P, Shah D, Lumsden A, Ballantyne CM, Morrisett JD. Automatic quantification of muscle volumes in magnetic resonance imaging scans of the lower extremities. Magnetic Resonance Imaging. 2011;29:1065–1075. doi: 10.1016/j.mri.2011.02.033. [DOI] [PMC free article] [PubMed] [Google Scholar]
- 19.Brunner G, Chittajallu DR, Kurkure U, Kakadiaris IA. Patch-cuts: A graph-based image segmentation method using patch features and spatial relations. Proceedings of the IAPR Conf. on British Machine Vision Conference (BMVC); 2010; –29.21.pp. 29.11 [Google Scholar]
- 20.Brunner G, Chittajallu DR, Kurkure U, Kakadiaris IA. Toward the automatic detection of coronary artery calcification in non-contrast computed tomography data. Int J Cardiovasc Imaging. 2010;26:829–838. doi: 10.1007/s10554-010-9608-1. [DOI] [PubMed] [Google Scholar]
- 21.Osher S, Sethian JA. Fronts propagating with curvature-dependent speed: Algorithms based on hamilton-jacobi formulations. Journal of Computational Physics. 1988;79:12–49. [Google Scholar]
- 22.Brunner G, Yang EY, Kumar A, Sun W, Virani SS, Negi S, Murray T, Lin PH, Hoogeveen RC, Chen C, Kougias P, Taylor A, Lumsden AB, Nambi V, Ballantyne CM, Morrisett JD. The effect of lipid modification on peripheral artery disease after endovascular intervention trial (elimit) Atherosclerosis. 2013;231(2):371–377. doi: 10.1016/j.atherosclerosis.2013.09.034. [DOI] [PMC free article] [PubMed] [Google Scholar]
- 23.Thompson RB, Aviles RJ, Faranesh AZ, Raman VK, Wright V, Balaban RS, McVeigh ER, Lederman RJ. Measurement of skeletal muscle perfusion during postischemic reactive hyperemia using contrast-enhanced mri with a step-input function. Magn Reson Med. 2005;54:289–298. doi: 10.1002/mrm.20535. [DOI] [PMC free article] [PubMed] [Google Scholar]
- 24.Yang[coprimary] EY, Brunner[coprimary] G, Dokainish H, Hartley CJ, Taffet G, Lakkis N, Taylor AA, Misra A, Morrisett MLMJ, Virani SS, Ballantyne CM, Nagueh SF, Nambi V. Application of speckle tracking in the evaluation of carotid artery function in subjects with hypertension and diabetes. Journal of the American Society of Echocardiography (JASE) 2013;26:901–909. doi: 10.1016/j.echo.2013.04.014. [DOI] [PMC free article] [PubMed] [Google Scholar]
- 25.Barrett HH, Yao J, Rolland JP, Myers KJ. Model observers for assessment of image quality. Proc Natl Acad Sci U S A. 1993;90:9758–9765. doi: 10.1073/pnas.90.21.9758. [DOI] [PMC free article] [PubMed] [Google Scholar]
- 26.Mahmoud-Ghoneim D, Cherel Y, Lemaire L, de Certaines JD, Maniere A. Texture analysis of magnetic resonance images of rat muscles during atrophy and regeneration. Magn Reson Imaging. 2006;24:167–171. doi: 10.1016/j.mri.2005.10.002. [DOI] [PubMed] [Google Scholar]
- 27.Chen W, Giger ML, Lan L, Bick U. Computerized interpretation of breast mri: Investigation of enhancement-variance dynamics. Med Phys. 2004;31:1076–1082. doi: 10.1118/1.1695652. [DOI] [PubMed] [Google Scholar]
- 28.Dice LR. Measures of the amount of ecologic association between species. Ecology. 1945;26:297–302. [Google Scholar]
- 29.Chittajallu D, Brunner G, Kurkure U, Yalamanchili R, Kakadiaris IA. Fuzzy-cuts: A knowledge-driven graph-based method for medical image segmentation. Proc. IEEE Computer Society Conference on Computer Vision and Pattern Recognition (CVPR); 2009; pp. 715–722. [Google Scholar]
- 30.Stork A, Lund GK, Bansmann M, Kemper J, Weiss F, Steiner P, Meinertz T, Adam G. comparison of an edema-sensitive haste-tirm sequence with delayed contrast enhancement in acute myocardial infarcts. Rofo. 2003;175:194–198. doi: 10.1055/s-2003-37225. [DOI] [PubMed] [Google Scholar]
- 31.Abdel-Aty H, Zagrosek A, Schulz-Menger J, Taylor AJ, Messroghli D, Kumar A, Gross M, Dietz R, Friedrich MG. Delayed enhancement and t2-weighted cardiovascular magnetic resonance imaging differentiate acute from chronic myocardial infarction. Circulation. 2004;109:2411–2416. doi: 10.1161/01.CIR.0000127428.10985.C6. [DOI] [PubMed] [Google Scholar]
- 32.Wright J, Adriaenssens T, Dymarkowski S, Desmet W, Bogaert J. Quantification of myocardial area at risk with t2-weighted cmr: Comparison with contrast-enhanced cmr and coronary angiography. JACC Cardiovasc Imaging. 2009;2:825–831. doi: 10.1016/j.jcmg.2009.02.011. [DOI] [PubMed] [Google Scholar]
- 33.Cohen J. Statistical power analysis for the behavioral sciences. Hillsdale, NJ: Lawrence Erlbaum Associates; 1988. [Google Scholar]
- 34.Wu WC, Wang J, Detre JA, Wehrli FW, Mohler E, 3rd, Ratcliffe SJ, Floyd TF. Hyperemic flow heterogeneity within the calf, foot, and forearm measured with continuous arterial spin labeling mri. Am J Physiol Heart Circ Physiol. 2008;294:H2129–2136. doi: 10.1152/ajpheart.01399.2007. [DOI] [PMC free article] [PubMed] [Google Scholar]
- 35.Baber U, Mann D, Shimbo D, Woodward M, Olin JW, Muntner P. Combined role of reduced estimated glomerular filtration rate and microalbuminuria on the prevalence of peripheral arterial disease. Am J Cardiol. 2009;104:1446–1451. doi: 10.1016/j.amjcard.2009.06.068. [DOI] [PubMed] [Google Scholar]
- 36.Ikram MA, Vernooij MW, Hofman A, Niessen WJ, van der Lugt A, Breteler MM. Kidney function is related to cerebral small vessel disease. Stroke. 2008;39:55–61. doi: 10.1161/STROKEAHA.107.493494. [DOI] [PubMed] [Google Scholar]
- 37.Abul-Khoudoud O. Diagnosis and risk assessment of lower extremity peripheral arterial disease. J Endovasc Ther. 2006;13(Suppl 2):II10–18. doi: 10.1177/15266028060130S205. [DOI] [PubMed] [Google Scholar]
- 38.Sato K, Fisher JP, Seifert T, Overgaard M, Secher NH, Ogoh S. Blood flow in internal carotid and vertebral arteries during orthostatic stress. Experimental physiology. 2012;97:1272–1280. doi: 10.1113/expphysiol.2012.064774. [DOI] [PubMed] [Google Scholar]
- 39.Chen TY, Chiu L, Wu TC, Wu TC, Lin CJ, Wu SC, Tsui YK. Arterial spin-labeling in routine clinical practice: A preliminary experience of 200 cases and correlation with mri and clinical findings. Clinical imaging. 2012;36:345–352. doi: 10.1016/j.clinimag.2011.11.003. [DOI] [PubMed] [Google Scholar]
- 40.Petersen ET, Zimine I, Ho YC, Golay X. Non-invasive measurement of perfusion: A critical review of arterial spin labelling techniques. Br J Radiol. 2006;79:688–701. doi: 10.1259/bjr/67705974. [DOI] [PubMed] [Google Scholar]
Associated Data
This section collects any data citations, data availability statements, or supplementary materials included in this article.
Supplementary Materials
Ensemble means curve for the soleus muscle obtained from healthy controls. The ensemble means curve constitutes the reference to categorize hypointense, isointense, and hyperintense voxels in the study population.