Abstract
We have synthesized a trio of gallium complexes bearing 9-anthraldehyde thiosemicarbazones. The complexes were assessed for their anticancer activity and their biophysical reactivity was also investigated. The three complexes displayed good cytotoxic profiles against two human colon cancer cell lines, HCT-116 and Caco-2. The IC50 ranged from 4.7 – 44.1 μM with the complex having an unsubstituted amino group on the thiosemicarbazone being the most active. This particular complex also showed a high therapeutic index. All three complexes bind strongly to DNA via intercalation with binding constants ranging from 7.46 × 10⁴ M-1 to 3.25 × 10⁵ M-1. The strength of the binding cannot be directly related to the level of anticancer activity. The complexes also bind strongly to human serum albumin with binding constants on the order of 104 – 105 M-1 as well. The complexes act as chemical nucleases as evidenced by their ability to cleave pBR322 plasmid DNA. The binding constants along with the cleavage results may suggest that the extent of DNA interaction is not directly correlated with anticancer activity. The results of docking studies with DNA, ribonucleotide reductase and human serum albumin, however showed that the complex with the best biological activity had the largest binding constant to DNA.
Graphical abstract
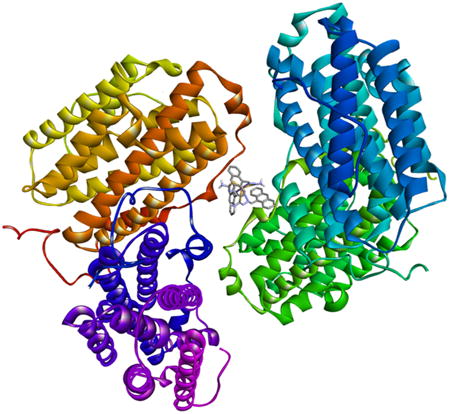
Three gallium complexes bearing 9-anthraldehyde thiosemicarbazones have been synthesized. The three complexes displayed good cytotoxic profiles against two human colon cancer cell lines, HCT-116 and Caco-2. All three complexes bind strongly to DNA via non-classical intercalation and also bind strongly to human serum albumin. Computational docking studies show the complexes bind in the major grove of DNA.
1 Introduction
A number of metal ions, by way of coordination complexes, are currently being studied for use as chemotherapeutics. Among these metals, platinum and ruthenium are probably the most well-known. However, gallium is considered to be the second metal, (after platinum), to have generated much research interest [1], with detailed investigations occurring from the 1970s [2 - 7]. The attractiveness of gallium as a therapeutic agent stems primarily from its biological and chemical mimicry of iron. Gallium(III) has approximately the same charge density as iron(III) and show similar coordination behavior. Gallium salts are not readily bioavailable and various mechanisms have been proposed to explain the biological activity. Gallium affects iron-dependent processes as it competes with iron for binding to transferrin. This fact is also useful since cancer cells typically over-express transferrin receptors so that gallium may be delivered to such cells specifically and in high concentration. Gallium also interacts with ribonucleotide reductase [1], a key enzyme in DNA synthesis, by displacing iron [8 - 9].
The use of gallium salts, at least when administered orally, has its disadvantages. Gallium nitrate is used to treat hypercalcemia. However, it has poor pharmacokinetic properties as a result of its ease of hydrolysis. In general, stabilization of Ga(III) relative to hydrolysis can be achieved by coordination to chelating organic ligands. This could also possibly have the effect of increasing bioavailability and lipophilicity with an overall improvement in cytotoxicity [10]. Various types of ligand systems bearing N-, O- and/or S- donor atoms have been used. The most promising complexes being studied are based on the quinoline (tris(8-quinolinolato)gallium(III) designated as KP46) and maltol (tris(3-hydroxy-2-methyl-4H-pyran-4-onato)gallium(III)) scaffolds [11,12]. KP46 have successfully completed Phase I clinical trials [1].
One other common ligand scaffold that is being explored is the thiosemicarbazone system [13 -15]. These ligands are known to be bioactive, showing a diverse range of biological behaviors including anticancer [16], antibacterial [17], and antiviral [18]. The biological properties of these chemicals can be modified by linkage to metal ions [19–21]. In this paper, we report on the synthesis of a series of three gallium complexes containing thiosemicarbazones from 9-anthraldehyde. We are reporting the results of the initial bioassays of these complexes versus two human colon cancer lines. In addition, their biophysical reactivity with DNA and human serum albumin was investigated and those results are also presented. To complete the paper, we also report on the results of molecular modelling of the complexes interacting with three potential biological targets.
2 Experimental
2.1 Material and Methods
Analytical or reagent grade chemicals were used throughout. All the chemicals including solvents were obtained from Sigma-Aldrich or other commercial vendors and used as received. Microanalyses (C, H, N) were performed by Galbraith Laboratories, (Knoxville, TN). Proton NMR spectra were recorded in dimethylsulfoxide-d6 on a Varian VNMRS-400 spectrometer operating at room temperature. The residual 1H and 13C present in DMSO-d6 (2.50 and 39.51 ppm respectively) were used as internal references. IR spectra in the range 4000 – 500 cm-1 were obtained using the ATR accessory on a Nicolet 6700 FTIR spectrophotometer. Absorption spectra were recorded on an Agilent 8453A spectrophotometer. Fluorescence spectra were recorded on a Varian Cary Eclipse spectrophotometer. Viscosity studies were done using a Cannon-Manning semi micro-dilution viscometer (type 75, Cannon Instruments Co., State College, PA, USA). The conductivity measurements were made on a Accumet AB200 meter. ESI-MS was recorded on an Advion CMS-L mass spectrometer.
2.1 Syntheses
The ligands were synthesized as previously described [22,23]. The complexes were synthesized as follows: The ligand, (3 molar equivalents), was suspended in approximately 25 mL of ethanol and the suspension heated to boiling. In the case of compound 3, an equimolar amount (based on the thiosemicarbazone), of potassium methoxide was added to the reaction. To the boiling mixture was added drop-wise a solution of Ga(NO3)3·×H2O (one molar equivalent) in 5 mL ethanol. The yellow mixture was heated at reflux for 5h during which time it became a bright yellow-orange color. The reaction mixture was allowed to cool to room temperature and then filtered to remove a small amount of a yellow solid. The filtrate was stripped of the solvent and the yellow-orange solid that resulted was washed with a small amount of water followed by extensive ether washes and then drying at the vacuum line.
Ga(ATSC)3, 1
Yield: yellow solid, 161 mg (44 %). Elemental analysis for C48H36GaN9S3; calc./found: C 63.72/63.33, H 4.01/4.47, N 13.93/14.24. IR (cm-1): 3436, 3212, 3152, 2981, 1599, 1585, 1484, 1407, 1282, 1161, 1070, 943, 883, 842, 823, 782, 730. 1H NMR (ppm): 11.65, 9.35, 8.69, 8.58, 8.56, 8.31, 8.29, 8.18, 7.71, 7.56 – 7.66.
Ga(EtATSC)3·0.25C2H5OH 2
Yield: yellow solid, 248 mg (67 %). Elemental analysis for C54.5H49.5GaN9O 0.25S3; calc./found: C 65.43/65.71, H 4.99/5.38, N 12.60/12.67. IR (cm-1): 3354(w), 3342, 3153, 2978, 2929, 2876, 1623, 1533, 1473, 1416, 1299, 1265, 1219, 1158, 1087, 1047, 1018, 943, 891, 840, 812, 785, 729. 1H NMR (ppm): 11.65, 9.28, 8.70, 8.50, 8.48, 8.23, 8.25, 7.55 – 7.65, 3.58, 1.16.
Ga(PhATSC)3·H2O 3
Yield: yellow solid, 185 mg (36 %). Elemental analysis for C66H50GaN9OS3; calc./found: C 68.87/69.18, H 4.38/4.72, N 10.95/11.13. IR (cm-1): 3309, 3129, 3046, 2985, 1622, 1593, 1541, 1531, 1442, 1416, 1398, 1304, 1259, 1194, 1069, 1017, 936, 889, 841, 783, 733. 1H NMR (ppm): 12.01, 9.99, 9.41, 8.75, 8.59, 8.16, 7.56 – 7.66, 7.28 – 7.34.
2.2 Cell culture
The cell lines were two human colon cancer cells: HCT116 (human colon carcinoma) and Caco-2 (human epithelial colorectal adenocarcinoma). In addition, normal human colon cells CCD-18Co (human colon fibroblasts), were included. All cell lines were obtained from the American Type Culture Collection (ATCC, Rockville, MD, USA) and maintained at the University of Rhode Island. Caco-2 cells were grown in EMEM medium supplemented with 10% v/v fetal bovine serum, 1% v/v nonessential amino acids, 1% v/v L-glutamine and 1% v/v antibiotic solution (Sigma). HCT-116 cells were grown in McCoy's 5a medium supplemented with 10% v/v fetal bovine serum, 1% v/v nonessential amino acids, 2% v/v HEPES and 1% v/v antibiotic solution. CCD-18Co cells were grown in EMEM medium supplemented with 10% v/v foetal bovine serum, 1% v/v nonessential amino acids, 1% v/v L-glutamine and 1% v/v antibiotic solution and were used from PDL = 26 to PDL = 35 for all experiments. (PDL is the population doubling levels). The cells were maintained at 37 °C in an incubator under a 5% CO2/95% air atmosphere at constant humidity and maintained in the linear phase of growth. The pH of the culture medium was determined using pH indicator paper (inside the incubator. The complexes were solubilized in DMSO (<0.5 % in the culture medium) by sonication and were filter-sterilized (0.2 μm) prior to addition to the culture media. Control cells were also run in parallel and subjected to the same changes in medium.
2.3 Cytotoxicity assay
The assay was carried out as described previously [24] to measure the IC50 values for the complexes as reported before [22].
2.4 DNA-interaction studies
All the experiments involving the interaction of the complexes with calf-thymus (ct) DNA were carried out in TRIS buffer (5 mM Tris, 50 mM NaCl, pH 7.20). Stock solutions of ct-DNA were prepared by dissolving commercial nucleic acids in buffer and stored at 4 °C for 24 h. The DNA solution was diluted appropriately and the concentration of the diluted solutions (per nucleotide phosphate) was determined spectrophotometrically using the molar absorption coefficient of 6600 M-1 cm-1 at 260 nm [25]. The purity of the solutions was checked by observing a ratio of ≥ 1.8 for the absorbances at 260 nm to 280 nm [26]. The DNA stock solutions were stored at 4 °C and used within 4 days after their preparation. Milli-Q water (18.2 μS/cm) was used in all experiments.
2.4.1 Viscosity measurements
The viscosity of DNA solutions was measured in the presence and absence of the complexes, in a water bath maintained at 31.0 ± 0.1 °C. The DNA concentration in each solution was 100 μM, while the complex concentration was varied from 0 – 40 μM. Data are presented as (η/η0)1/3 versus 1/R, where R = [DNA]/[complex], η is the viscosity of DNA in the presence of the complex and η0 is the relative viscosity of DNA alone. Relative viscosity values were calculated from the observed flow time of DNA solution (t) and for the flow time of buffer (t0), using the expression η0 = (t – t0)/t0. Flow time of each sample was measured three times and an average flow time was used.
2.4.2 Absorbance titration experiments
Spectroscopic titrations were carried out at room temperature to determine the binding affinity between the complexes and ct-DNA. A constant concentration of the complexes (1.0 × 10⁻⁵ M) was treated with aliquots of a concentrated solution of the DNA. The absorption of the added DNA was accounted for by adding an equal amount to a cuvette containing buffer. The values of the intrinsic binding constant Kb, illustrating the binding strength of the complexes with ct-DNA< were determined from the following equation [14]:
| (1) |
where εa, εf and εb correspond to the molar absorptivities of the metal complex after each addition of ct-DNA, for the free metal complexes and for the metal complexes in the fully bound form respectively.
2.4.3 Fluorescence titration experiments
In the fluorescence titration experiment, 3 mL of a 10 μM solution of the complexes in TRIS buffer was titrated with aliquots of a concentrated solution of DNA. After each addition, the solution was stirred at the appropriate temperature for 5 minutes before measurement. The fluorescence spectra of the solution were then obtained by exciting at 520 nm and measuring the emission spectra from 530 to 700 nm using 5 nm slits. Temperature was controlled using a single-cell Peltier accessory.
2.4.4 Chemical nuclease activity
The DNA unwinding and cleavage ability of the complexes were evaluated by agarose gel electrophoresis of supercoiled pBR322 DNA. The experiments were done in the “dark” or with exposure to UV light. Samples of pBR322 DNA (0.1 mg/mL) were incubated with the complexes (in concentration ranging from 10 to 300 μM) in TRIS buffer (50 mM Tris, 18 mM NaCl, pH 8.2) at room temperature for 1 h. The reactions were quenched by addition of 3 μL of loading buffer (0.25% bromophenol blue and 15% Ficoll in water). Samples of the reaction mixtures were loaded onto a 1% agarose gel in TBE buffer (89 mM Tris, 89 mM boric acid, 2 mM EDTA, pH 8.2). The gels were subjected to electrophoresis for 1 h at 70 V, followed by staining with 0.5 mg/mL ethidium bromide for 30 min. The bands on the gel were visualized under UV light and photographed using a GEL Logic 440 Imaging System with a Kodak Molecular Imaging Software.
2.5 Reaction with human serum albumin (HSA)
Stock solutions of HSA (fatty acid-free) were prepared in TRIS buffer (50 mM Tris, pH 7.40, 100 mM NaCl) and stored in the dark at 4 °C. The protein concentration was determined spectrophotometrically using the molar absorptivity of 3.6 × 10⁴ M-1 cm-1 at 280 nm [27]. In the experiments, a solution of HSA (5 μM) was placed in a quartz cuvette and titrated with a concentrated solution of the complex producing the solutions with varied mole ratios of complex to HSA. The complex concentration ranged from 3 to 30 μM. The fluorescence spectra of the solutions were obtained by exciting at 295 nm and measuring the emission spectra from 300 – 500 nm.
2.6 Docking studies with macromolecules
The interaction of the complexes with various biological macromolecules was modelled using the AutoDock 4.2.6 (in AutodockTools) software package [28]. Docking calculations were performed with the crystal structures of DNA, human serum albumin and human ribonucleotide reductase (subunit 2). Grid boxes of 90 × 100 × 80 points (for DNA) and 126 × 126 × 126 points (for the proteins) with a spacing of 0.375 Å between the grid points were used. The box was centered on the macromolecule. One hundred docked structures were generated by using genetic algorithm searches. The protocol that was applied had an initial population of 150 randomly placed individuals, a maximum number of 2,500,000 energy evaluations, a maximum number of 27,000 generations, a mutation rate of 0.02, and a crossover rate of 0.8. Docking input files for the complex and the macromolecule were generated with the ADT software. The results were visualized using the Discovery Studio 4 visualizer from Accelrys.
3 Results and Discussion
3.1 Synthesis and characterization
The ligands were synthesized as previously reported [22]. The complexes were synthesized by the reaction of Ga(NO3)3·×H2O with the appropriate thiosemicarbazone in refluxing ethanol. In the case of complex 3, an equivalent of potassium methoxide was added to force the deprotonation of the thiosemicarbazone ligand.
The complexes were obtained as bright yellow solids that were insoluble in water but were soluble to some extent in alcohols and more soluble in DMSO. The complexes have been characterized by elemental analysis as well as NMR, infrared, electronic absorption and fluorescence spectrophotometry as well as conductivity measurements. Based on the analysis of the characterization data, the complexes have been formulated as Ga(TSC)3 in the solid state. In this configuration, the thiosemicarbazone ligands are proposed to be ligating as bidentate monoanionic species. Thiosemicarbazones are known to exhibit thiol-thione tautomerism and so can bind to metals as either the neutral thione form or the deprotonated form of thiol tautomer. The conductivity of 1 mM solutions of the complexes in DMSO was 4.96 μS/cm, 3.08 μS/cm and 3.48 μS/cm for 1, 2 and 3, respectively. These values confirm the non-electrolytic nature of the complexes [29] and supports the thiol tautomer ligating mode.
The proton NMR spectra (shown in the Supplemental Information) of the complexes are mostly consistent with proposed chemical formulation. The signals arising from the anthracene moiety are expectedly common for all three complexes. There is a pair of doublets centered near 8.50 ppm and 8.18 ppm as well as a multiplet at 7.55-7.66 ppm (H2, H3, H7. H8). The doublets are due to protons (H1, H9) and (H4, H6) respectively. A singlet is also near 8.70 ppm due to the proton (H5) on the center ring. The original aldehydic hydrogen has its signal between 9.33 - 9.41 ppm. These signals are not appreciatively different from those of the corresponding protons in the free ligand [22,25]. The amine protons occur around 8.32 ppm for 1 and 2 but 9.99 ppm for 3, likely due to the effect of the phenyl ring. For complex 2, the ethyl group show up at 1.14 ppm (-CH3) and 3.62 ppm (-CH2). The signals of the phenyl group in 3 are seen at 7.17 – 7.66 ppm.
The complexes exhibited luminescence in DMSO solutions. The emission spectra of the complexes in this solvent are very similar with a maximum near 620 nm upon excitation at 310 nm using 5 nm slits. This would imply that transitions responsible for this observation are probably ligand-based. These emission parameters are also applicable to solutions in TRIS buffer (5 mM Tris, 50 mM NaCl, pH 7.20).
The positive ion ESI-MS of the complexes is unexpectedly complex with mostly lower molecular weight signals (see Supplemental Information). There are no indications of the protonated molecular ion adduct. Instead, we observe species that can reasonably be interpreted to be the ion resulting from the loss of a single thiosemicarbazone ligand (m/z = [M-TSC]+). The protonated free ligand is observed in the spectrum of all the complexes. The calculated structures, (see below), show that there is severe ring strain in two of the chelate rings and decomposition in the mass spectrometer is very possible and likely facile.
3.2 Geometry Optimization
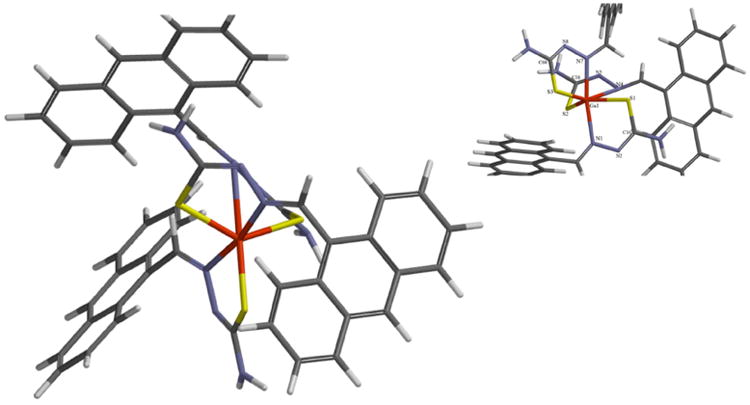
The optimized structures of the complexes were calculated using the Spartan 14 software package [30]. Density functional theory was used to calculate the structure for 1. This was done using the ωB97X-D functional with the basis sets LANL2DZ on Ga and 6-31G* on all other atoms. To verify that the geometries were minimized, the vibrational frequencies were also calculated. The structures of 2 and 3 were also calculated but at the PM3 level of theory in order to cut down on computational expense. Both methods calculated a similar structure for all three complexes. Since 1 was calculated more accurately, we discuss its structure in detail. Table 1 shows some selected geometric parameters from the optimized structure. Figure 1 illustrates the calculated structure. (Complexes 2 and 3 can be seen in the supplemental information). The general shape of the complexes is that of a severely distorted octahedron around the gallium ion. As can be seen in the table there is one very long (Ga-N4) and one very short (Ga-N7) bond. None of the bond angles around the metal ion is near the ideal 180° or 90°. In fact, the angle relating the bonds is only 76.5°. As the figure shows, one of the chelate rings is relatively planar while a second is severely tilted out of the plane of the gallium ion. Another structural feature of the complex is that the anthracene unit of the thiosemicarbazone ligand is flat but at an angle to the chelating fragment of the ligand. This is an important factor to consider in examining the interaction of these complexes with DNA; it suggests that a classical intercalative mode of binding is not possible.
Table 1. Selected calculated geometrical parameters for the complexes.
| 1 | 2 | 3 | |
|---|---|---|---|
| Bond distances | |||
|
| |||
| Ga(1)-N(4) | 3.289 | 2.390 | 2.384 |
| Ga(1)-S(3) | 2.309 | 2.466 | 2.469 |
| Ga(1)-S(1) | 2.284 | 2.457 | 2.456 |
| Ga(1)-S(2) | 2.297 | 2.436 | 2.423 |
| Ga(1)-N(1) | 2.302 | 2.506 | 2.515 |
| Ga(1)-N(7) | 2.175 | 1.834 | 1.836 |
|
| |||
| Bond angles | |||
|
| |||
| S(1)-Ga(1)-S(2) | 134.33 | 165.86 | 165.69 |
| S(3)-Ga(1)-N(4) | 154.24 | 172.53 | 173.38 |
| N(1)-Ga(1)-N(7) | 170.76 | 168.32 | 168.81 |
| S(2)-Ga(1)-S(3) | 109.78 | 92.41 | 91.90 |
| S(1)-Ga(1)-S(3) | 115.81 | 92.79 | 92.19 |
| S(2)-Ga(1)-N(7) | 98.69 | 103.70 | 103.63 |
| S(2)-Ga(1)-N(4) | 61.44 | 82.06 | 82.74 |
| N(7)-Ga(1)-N(4) | 76.52 | 96.27 | 95.26 |
| N(1)-Ga(1)-S(1) | 80.13 | 79.20 | 78.91 |
| N(1)-Ga(1)-N(4) | 101.83 | 86.56 | 87.29 |
| N(1)-Ga(1)-S(2) | 88.27 | 87.86 | 87.49 |
| S(3)-Ga(1)-N(7) | 81.44 | 89.90 | 89.73 |
Figure 1. Calculated structure of complex 1.
3.2 Anticancer activity
The biological behavior of the complexes was investigated by assaying their anticancer activity against a panel of human cancer cell lines that included HCT-116 (colon adenocarcinoma) and Caco-2 (epithelial colorectal adenocarcinoma). In addition, a non-cancer cell line, CCD-18Co (colon fibroblasts) was included in the assays. Etoposide, a common clinical drug, was used as a comparison. Table 2 shows the results of the in vitro assay and all three complexes show cytotoxic profiles with IC50 values in the tens of micromolar. It is obvious that incubation time of the drugs with the cells have an impact on the anticancer activity. As a generalization, longer incubation times resulted in more observed cytotoxicity with the IC50 values for the 72 h incubation period being as much as 3.5 times for the 24 h incubation. Comparing the two cancer cell lines it was observed that there is a marked difference in sensitivity towards the three complexes. For complexes 1 and 2 over the 72 h incubation period the complexes are generally more cytotoxic to the Caco-2 cells versus the HCT-116. This is actually reversed for complex 3. Against both cell lines, the activity profile was in the order 1 > 2 > 3. Overall 1 showed the best activity with IC50 of 4.7 μM against the Caco-2 cells. Speculating on a qualitative structure-activity analysis, we can suggest that substituting the amine nitrogen with a bigger group that is electron-donating leads to a decrease in cytotoxic activity. Of the three complexes, only 1 was comparable to and in fact showed better cytotoxicity against both cell lines when compared to the comparison drug etoposide though 2 has comparable activity in the Caco-2 cell line. Another important point to make relates to the therapeutic indices for the complexes. We are defining the therapeutic index as the ratio of the IC50 values against the CCD-18Co (normal) cells to the IC50 values against the cancer cells. The larger this number is, the more selective for the cancer cells over the normal cells the compounds are. This is a desired property in drug development. Complex 1 shows an excellent TI of 12 for the Caco-2 cells while 2 also show good selectivity (TI = 5) for these cells. Compound 1 also exhibits good selectivity for the HCT-116 cells (TI = 4.2). Against both cell lines, 1 show a better therapeutic index than even the etoposide.
Table 2.
Anti-proliferative activity represented by IC50 values (μM)) of the three complexes in a panel of three human cell lines – 2 tumorigenic (HCT-116 and Caco-2) and one normal (CCD-18Co).
| Complex | IC50 (μM) | |||||
|---|---|---|---|---|---|---|
|
| ||||||
| HCT-116 | Caco-2 | |||||
|
|
|
|||||
| 24 h | 48 h | 72 h | 24 h | 48 h | 72 h | |
| 1 | 25.4 ± 0.9 | 17.7 ± 2.2 | 13.1 ± 1.2 | 16.5 ± 2.2 | 7.7 ± 1.5 | 4.7 ± 1.1 |
| 2 | 49.9 ± 2.5 | 43.6 ± 2.1 | 30.1 ± 1.1 | 23.1 ± 2.1 | 18.7 ± 1.7 | 11.6 ± 1.1 |
| 3 | 79.0 ± 1.1 | 56.0 ± 1.7 | 32.1 ± 2.4 | 78.7 ± 5.3 | 58.0 ± 1.5 | 44.1 ± 3.6 |
| Etoposide | 28.9 ± 2.0 | 26.9 ± 1.5 | 14.3 ± 1.4 | 23.0 ± 0.9 | 18.9 ± 1.6 | 16.2 ± 1.7 |
| IC50 (μM) | ||||||
|
|
||||||
| CCD-18Co | ||||||
|
|
||||||
| 24 h | 48 h | 72 h | ||||
|
|
||||||
| 1 | 54.0 ± 1.8 | 41.9 ± 1.9 | 55.4 ± 2.1 | |||
| 2 | 78.6 ± 2.1 | 60.6 ± 2.0 | 59.5 ± 2.5 | |||
| 3 | 80.9 ± 2.6 | 59.2 ± 2.6 | 42.9 ± 1.3 | |||
| Etoposide | 51.2 ± 1.1 | 48.7 ± 3.1 | 43.9 ± 1.8 | |||
|
|
||||||
| Complex | IC50 (μM) | |||||
|
|
||||||
| HCT-116 | TI* | Caco-2 | TI* | CCD-18Co | ||
| 72 h | 72 h | 72 h | ||||
|
|
||||||
| 1 | 13.1 ± 1.2 | 4.22 | 4.7 ± 1.1 | 11.8 | 55.4 ± 2.1 | |
| 2 | 30.1 ± 1.1 | 1.98 | 11.6 ± 1.1 | 5.14 | 59.5 ± 2.5 | |
| 3 | 32.1 ± 2.4 | 1.33 | 44.1 ± 3.6 | 0.97 | 42.9 ± 1.3 | |
| Etoposide | 14.3 ± 1.4 | 3.07 | 16.2 ± 1.7 | 2.71 | 43.9 ± 1.8 | |
|
|
||||||
TI = therapeutic index = (IC50)CCD-18Co/(IC50)cancer cells
3.3 Reactions with DNA
The pharmacological targets for anticancer metal complexes are quite varied and becoming more so. For the famous platinum drugs, DNA is a well-established target [31]. For ruthenium complexes, there are no unequivocally established targets as complexes are known to target DNA [31-33] and topoisomerase II [34-36]. Gallium complexes are assumed to follow the same biochemical transport pathways and mechanisms as iron. Consequently, the enzyme ribonucleotide reductase has been considered a reasonable target for gallium complexes [37]. Given that ribonucleotide reductase is such an important enzyme in the DNA replication process, we hypothesized that our complexes can directly target DNA. In addition, given the molecular shape of the thiosemicarbazone ligands with the “extended” flat aromatic anthracene group, we presumed that they could interact with DNA via an intercalative mechanism particularly since the complexes are not charged. The initial reactions with DNA were studied via absorption spectrophotometry. The binding of potentially intercalative drugs is easily studied by this method as such drugs typically show hypochromism of the major absorption bands upon interaction with DNA [38, 39]. In addition, there is usually a shift to longer wavelengths accompanying the hypochromism. The extent of the absorption reduction is often consistent with the strength of the intercalative interaction [39, 40]. Figure 2 shows the absorption spectra of complex 1 upon titration with ct-DNA. It is obvious that with increasing DNA concentration there is hypochromism of the absorption band at 254 nm. The extent of hypochromism is approximately 15%. Complexes 2 and 3 show similar behavior (figures shown in Supplemental Information). A quantitative analysis of the absorption data according to equation 1, allowed for the determination of the binding constant, Kb, from the ratio of the slope to the intercept. The plots of the data according to the equation 1, [DNA]/(εa – εf) vs. [DNA], are shown as the insets in Figure 2. The calculated binding constants were (9.70 ± 0.43) × 104 M-1, (3.25 ± 0.29) × 105 M-1 and (7.46 ± 0.44) × 104 M-1 for 1, 2, and 3 respectively. The magnitude of the values suggests that the complexes are moderate intercalators.
Figure 2.
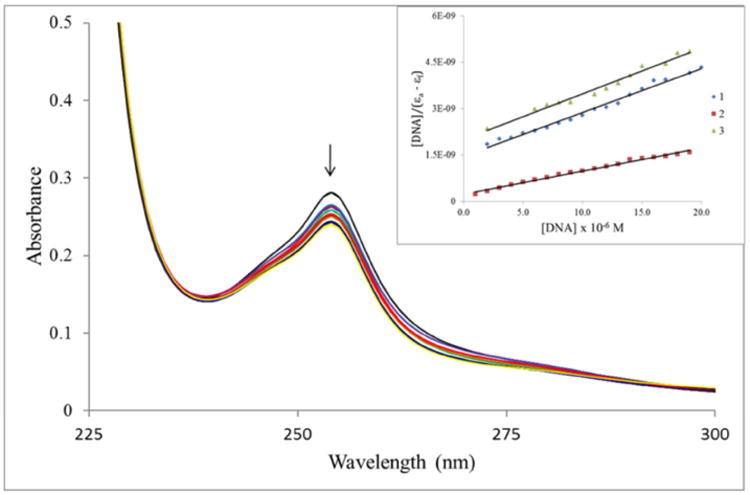
Electronic absorption spectral changes of complex 1 on titration with ct-DNA. [Ga] = 100 μM, [DNA] = 0, 2, 4, 6, 10, 16, 18, 20, 22, 24 and 26 μM. Arrow indicates the change upon increasing DNA concentration. Inset: Plot of [DNA]/(εa –εf) vs. [DNA]
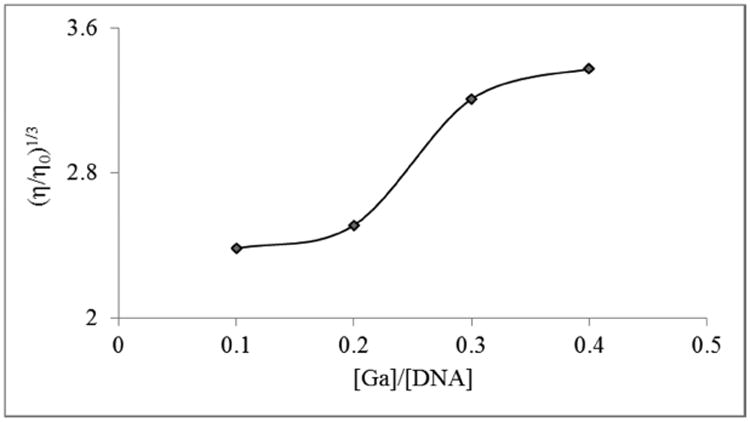
The mild intercalative nature of the interaction between the complexes was further inferred from a fluorescence titration. Figure 3 shows the emission spectra of complex 1 upon titration with DNA. The decrease in the fluorescence intensity is a result of the changes in the electronic structure of the complexes as a result of the interaction. While spectrophotometry (absorption and emission) are useful and simple in obtaining mechanistic information pertaining to binding to DNA, viscometry is considered to be a more definitive technique with regards to an intercalative mode of binding. In the standard interpretation, an intercalator will cause lengthening of the DNA strands as it (the DNA) accommodates the compound. This will result in an increase in the viscosity of a DNA solution containing the intercalators relative to a free DNA solution. To confirm that our complexes could intercalate into DNA we carried out such an experiment using 1. As can be seen in Figure 4, there is a general increase in the viscosity of DNA solutions containing various amounts of 1. This shows that our complexes do intercalate though likely not in the classical fashion as the increase is not large.
Figure 3.
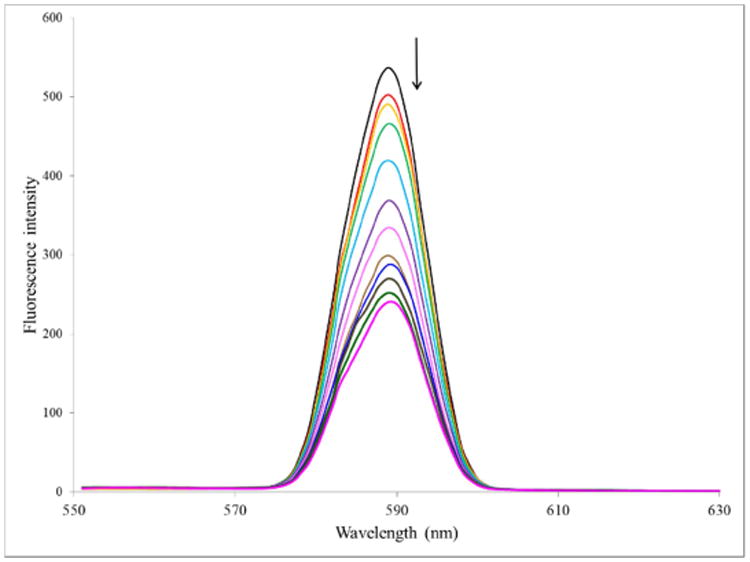
Emission spectra of complex 1 in the absence and presence of increasing amounts of ct-DNA, λex = 294 nm, [1] = 10 μM, [DNA] = 0 – 12 in 1 μM increments. Temperature = 303 K
Figure 4. Effect of increasing concentrations of complex 1 on the relative viscosity of ct-DNA solutions at 304 K ± 1 K.
3.4 Chemical nuclease activity
The chemical nuclease activity of the complexes was investigated in the cleavage of supercoiled pBR322 plasmid DNA in a medium of Tris-boric acid-EDTA (TBE) buffer (pH 8.2) at 37 °C by gel electrophoresis. In a first experiment, the concentration of 1 was varied from 5 μM to 100 μM. Under the experimental conditions, it was observed that when the concentration of the complex was increased whilst keeping that of the DNA constant, higher concentrations (≥ 30 μM) can cause significant cleavage of the DNA as evidenced by the appearance of the nicked-circular (Form II) fragments of the DNA in the gel lanes (Figure 5). For 2 and 3 the highest concentrations (50 and 100 μM) from the initial experiment were studied. Again, it was observed that cleavage of the DNA occurred with both the Form II and Form III (linear DNA) being present for complex 3, indicating that this complex can cut the DNA. Our experiments and results do not allow us to determine if the mechanism of cleavage involve reactive oxygen species or a hydrolytic pathway. However, to check the involvement of the solvent we included a lane with just DNA and DMSO. The shape of the bands compared to the DNA alone indicates no effect of the DMSO. While the concentration of the solvent was minimal, this might hint that species such as peroxide and singlet oxygen were not involved in the process.
Figure 5.
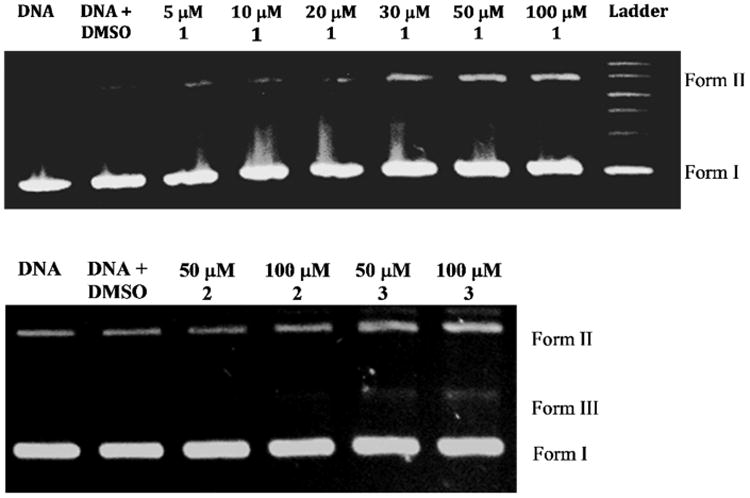
Agarose gel electrophoresis diagram for the cleavage of pBR322 DNA by all complexes at 37 °C under aerobic conditions. Incubation time was 1 h
3.5 Reaction with human serum albumin
Human serum albumin (HSA) is a 67 kDa protein consisting of a single polypeptide chain. Of the wide variety of roles that the proteins plays, probably the most essential physiological role is that of a transport agent. Drug molecules need to get to their site of action to effect their pharmacological activity. HSA binds to these molecules reducing their active concentrations as well as the bioavailability. Consequently, it is extremely crucial to understand how potential drugs interact with this important protein.
The secondary structure of HSA has three homologous domains, each consisting of two subdomains [41]. The primary structure has a single tryptophan residue at position 214 (site I) along with eighteen tyrosines and thirty-one phenylalanine residues. All three amino acids are emissive with tryptophan ≫ tyrosine > phenylalanine with respect to fluorescent intensity [42]. Consequently, the large majority of the intrinsic fluorescence of HSA is contributed by the sole tryptophan residue. From the vast amount of data in the scientific literature [43], it is accepted that changes in intrinsic fluorescence can be used to monitor structural changes in a protein. These changes can be effected by titrating a protein solution with a small molecule, in our case the complexes, and measuring the quenching of the fluorescence. So given the importance of HSA in moderating drug pharmacokinetic and pharmacodynamic behavior, we studied its interaction with the complexes by a fluorescence titration. Figure 6(A) shows the changes in fluorescence intensity as increasing amounts of 1 are added. There is an 86% reduction in the fluorescence intensity with a blue shift to 330 nm from 341 nm (Δλ = 11 nm). These changes indicate that the conformation of the protein is affected by binding to 1. Typically for HSA, the tryptophan residue is buried in the hydrophobic core of protein and will have maximum fluorescence emission at about 330 nm; if the residue is exposed to a more polar environment then it will emit near 350 nm. Therefore a decrease in the polarity in the environment of this residue on interaction with a ligand will result in blue-shifted spectral bands. Such a change would require reorganization of the protein involving the expulsion of water molecules and creating the nonpolar pocket. The strength of the binding may be quantified using the Stern-Volmer equation (2).
Figure 6.
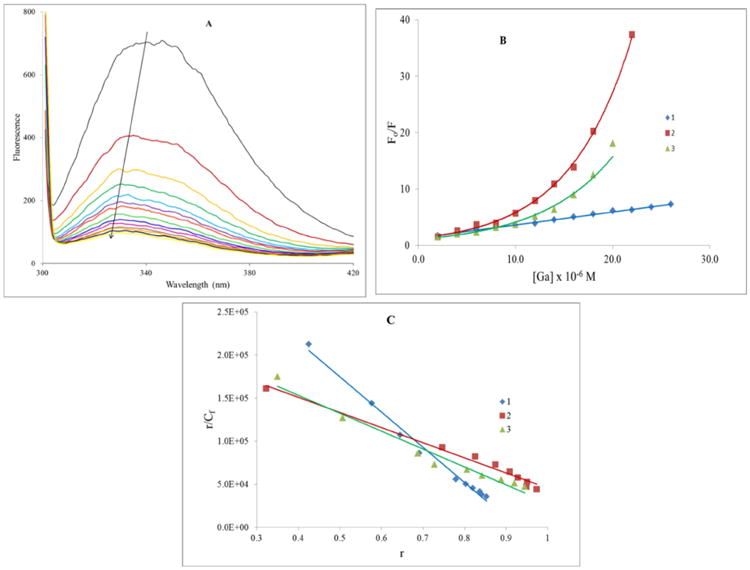
(A) Emission spectra of HSA in the absence and presence of increasing amounts of 1, λex = 295 nm, [HSA] = 5.0 μM and [1] (μM): 0 – 26 in 2.0 μM increments. Temperature = 303 K. (B) Stern-Volmer plots for the reaction of 1, 2, and 3 with HSA at 303 K. (C) The Scatchard plot for the binding of 1, 2, and 3 to HSA at 303 K.
| (2) |
Kq is the bimolecular quenching constant and τ0 is the lifetime of the fluorophore in the absence of complex. The Stern-Volmer quenching constant is given by KD = Kqτ0 a representation of the KSV if the quenching is known to be dynamic. KSV is the measure of the effectiveness of the complex as a quencher. As seen in Figure 6(B), at 303 K the plot is linear as expected and it gives a calculated quenching constant of (1.66 ± 0.08) × 105 M-1. However, for this complex at 308 K and for the other two complexes at 298 K, 303 K and 308 K, the Stern-Volmer plot shows a distinct upward curvature (see Supplemental Information). For protein solutions having homogeneous emission upward curvature has been observed with a wide variety of quenchers [44]. In fact, the fluorescence of most proteins is likely heterogeneous [45]. As mentioned above, tryptophan amino acid residues have higher quantum yields than the two other fluorescent amino acids. Despite this, the tyrosine in particular may still contribute significantly to protein fluorescence because it is typically present in larger numbers. In the case of HSA with the eighteen residues, one cannot completely eliminate tyrosine emission.
Since linearity of a Stern-Volmer plot is usually associated with the fluorophore possessing a single binding site or multiple accessible binding sites, we suggest that deviation from linearity is due to the existence of non-equivalent (different or same (accessible or non-accessible)) binding sites and/or the occurrence of combined quenching. That is, in addition to the dynamic quenching which governs the Stern-Volmer plot, a second mechanism, static quenching, can occur simultaneously. The static contribution may be calculated from the following equation:
| (3) |
where KD and KS are the dynamic and static quenching constants. This is a modified form of the Stern-Volmer equation applicable when one is considering the same population of fluorophores [42].
| (4) |
A plot of Kapp versus [Ga] yields a straight line with an intercept of KD + KS and a slope of KSKD. We analyzed the data for 1 at 308 K as well as 2 and 3 at 298 K and 303 K according to this equation (4) [42] (figure shown in Supplemental Information). Only in the case of 3 did the quadratic equation give non-imaginary solutions. In that case, KD was calculated to be 8.64 × 10⁵ M-1 and KS was 3.35 × 10⁴ M-1 at 303 K. At 298 K, the values were KD = 1.62 × 10⁵ M-1 and KS = 2.04 × 10⁴ M-1. A completely unambiguous assignment of KD and KS requires fluorescence lifetime measurements [42]. Typically for proteins the quenching constants are nearly identical. Under these circumstances the binding constant can be obtained from a modified Stern-Volmer (MSV) analysis [44]. Table 3 show the binding constants obtained from a Scatchard analysis (Figure 6(C)). This analysis is based on equation (5).
Table 3. Binding constants for the interaction of complexes with HSA.
| Comp. | Temp. (K) | Modified Stern-Volmer | Scatchard | ||
|---|---|---|---|---|---|
|
| |||||
| K × 105 M-1 (f) | R2 | K × 104 M-1 (n) | R2 | ||
| 1 | 298 | 3.26 (0.96) | 0.996 | 3.30 (0.96) | 0.988 |
| 303 | 4.26 (0.90) | 0.993 | 4.09 (0.93) | 0.990 | |
| 308 | 3.44 (1.1) | 0.999 | 3.39 (1.1) | 0.997 | |
|
|
|||||
| 2 | 298 | 3.08 (1.1) | 0.997 | 2.97 (1.1) | 0.992 |
| 303 | 1.69 (1.3) | 0.990 | 1.76 (1.1) | 0.982 | |
|
|
|||||
| 3 | 298 | 3.02 (0.93) | 0.975 | 2.63 (0.96) | 0.945 |
| 303 | 2.31 (1.1) | 0.979 | 2.08 (1.1) | 0.968 | |
| 308 | 3.25 (1.0) | 0.984 | 2.88 (1.1) | 0.947 | |
| (5) |
In this equation r is the number of moles of 1 bound per mole of HSA. Cf is the molar concentration of the free metal complex, n is the number of binding sites and K is the intrinsic binding constant. Table 3 also show the data (along with the coefficient of determination, R2) obtained from the analysis using a modified Stern-Volmer (MSV) equation (6) [42].
| (6) |
Here f = fraction of the fluorophore that is initially accessible to the complex. This may be interpreted as the number of binding sites on the protein. Both methods provided comparable values with the MSV analysis yielding binding constants on the order of 105 M-1, indicating strong binding. The values from the Scatchard analysis were an order of magnitude less. The difference in the values calculated from the two methods is a function of the deviation from linearity of the Stern-Volmer plot and also possibly related to the known limitations in a Scatchard analysis. The method, for example, require the free ligand concentration in the solution and this is difficult to measure or determine accurately. The original method was applied to identify the number and types of binding sites on a protein as well as the affinity for those sites. The Modified Stern-Volmer approach already assumes that that there are two classes of fluorophores (accessible and inaccessible).It may be that the MSV method isolates the dynamic quenching constant predominantly while the Scatchard analysis illustrates the static contribution primarily The values of f (MSV) and n (Scatchard) indicated that there is a single binding site on the protein for the metal complexes. And as implied above, the blue shift that occurred during the fluorescence titration suggests that the environment of the tryptophan residue became more nonpolar.
3.6 Binding to biological macromolecules
DNA is considered a major biological target for metal complexes that have pharmacological activity. However, given the reasonable similarity of gallium to iron with respect to biological mechanisms, we were also interested in computationally investigating the reactions of the complexes with biological targets that are implicated in iron biological activity. One such target is ribonucleotide reductase [46] and gallium may be considered an inhibitor. Ribonucleotide reductase (RNR) is the major enzyme participating in the synthesis of deoxyribonucleotides, the precursors needed for both synthesis and repair of DNA. The enzyme is highly expressed tumor cells and is a well-known target for cancer chemotherapy.
We have computationally investigated the reaction between the compounds and three macromolecules (MMs). The calculated structures of the complexes were docked with three possible biological targets: DNA (PDB code: 423D), human serum albumin (PDB code: 1AO6) and human ribonucleotide reductase subunit 2 (PDB code: 3OLJ). The structures of these MMs were obtained from the Protein Data Bank. Table 4 contains the calculated binding energies and dissociation constants for the interaction with these MMs. A number of generalizations is worth mentioning. First, all the complexes show strong binding affinities for all the MMs, with dissociation constants in the low nanomolar range. It was also observed that the complexes bind stronger to the proteins than to DNA. Generally, complex 3 bind the strongest to the MMs with the exception of DNA which 1 binds the strongest.
Table 4. Calculated binding parameters for the complexes with DNA, human serum albumin and human ribonucleotide reductase subunit 2 (hRRM2).
| Macromolecular target → Compound ↓ | DNA | hRRM2 | HSA | |||
|---|---|---|---|---|---|---|
| Binding energy* | kI* | Binding energy | kI | Binding energy | kI | |
|
|
||||||
| 1 | - 9.43 | 0.12 | - 9.93 | 0.053 | - 9.69 | 0.078 |
| 2 | - 7.39 | 3.8 | -9.62 | 0.089 | -8.45 | 0.64 |
| 3 | - 8.95 | 0.28 | -10.3 | 0.029 | - 10.4 | 0.024 |
Binding energy is in kJ/mol and dissociation constant (kI) is in micromolar units
Figure 7 shows the most energetically favorable docked conformation of 1 with the MMs as well as the binding interactions that are present. The figure (A) represents the docked pose exhibiting the parameters presented in Table 4. For complex 1, it is obvious that the entry point in the DNA is via the major groove. There are a number of molecular interactions being displayed. The anthracene rings of the thiosemicarbazone ligands are all involved in binding to two deoxycytosine (cyt) units, using a range on interaction modes. Cyt6 is involved in a fairly long pi-pi T-shaped (edge-to face) interaction. This nucleotide is also involved in two pi-anion interactions between the phosphate group and the rings of a second thiosemicarbazone ligand. Cyt15 displays a similar pattern with two T-shape pi-pi interactions with the third anthracene ring set.
Figure 7.
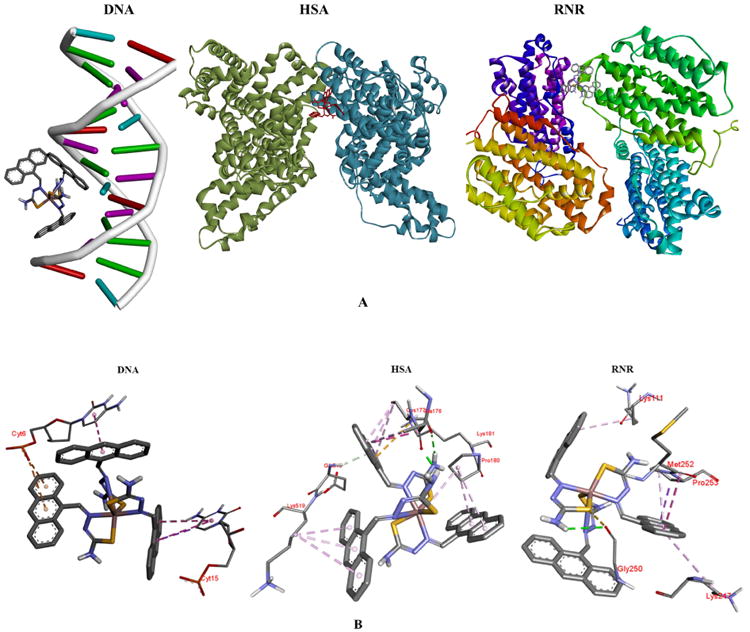
(A) Docked poses of complex 1 with the macromolecules; (B) binding groups and the interactions with the complex.
The minor groove is a target for a large number of species that bind to DNA in a non-covalent manner. For complex 1, a second docked pose of similar energetics (kI = 138 nM and binding energy = -9.36 kJ) to the first, places it in the minor groove (Supplemental Information). The interacting groups now include Gua19 and Thy8 along with Cyt9. Gua19 forms conventional hydrogen bonds to the azomethine nitrogen of the thiosemicarbazone; Cyt9 also forms these conventional hydrogen bonds between the phosphate group and the –NH2 group on the ligand. There is a pi-anion interaction between Thy8 and one anthracene moiety.
There are similar interactions between DNA and complexes 2 and 3 (Supplemental Information). Complex 2 binds in a guanosine-rich region of the helix and hydrogen bonding interactions dominate. The phenyl rings of 3 are heavily involved in binding, introducing more of the pi-anion and pi-sigma interactions.
The major interaction types observed with DNA (Figure 7B) are also seen with the two proteins as well. There are more of these interactions however, which might explain why the complexes bind stronger to these MMs. The amino acid residues involved are varied; however, lysines, alanines, glutamates and leucines feature prominently. For hRRM2, Ala99, Glu105 and Leu109 participates in a regular manner. For the most energetically favorable pose of 1 however, the residues involved are Lys111 and Lys247, Pro253, Gly250 and Met252 which is involved in an amide-pi stacking interaction with an anthracene ring. This pose places the complex in a shallow crevice on the surface of the MM. The strength of binding (Table 4) is not much larger than a second pose (kI = 59.64 nM, Supplemental Information), where the complex is located in the interior of the protein. With HSA, the interactions (as far as types) are more consistent among the three complexes. That is, they are located in the same general region of the protein. There are some unique aspects seen with the docked pose for 1. For instance, there is a pi-alkyl mode of interaction involving the C=S of the coordinating ligand and the ring of Pro180. As seen in Table 4, complex 3 is the strongest binder to the proteins and overall the best binder. A closer look at the interactions it forms indicates that the presence of the phenyl ring is critical to how it binds. Generally speaking, pi-interactions dominate the binding of the complexes to the MMs and the phenyl rings in 3 increase those interactions.
Conclusions
We have synthesized three gallium complexes of an interesting thiosemicarbazone ligand. These complexes show excellent cytotoxicity profiles against two human colon cancer cell lines. They also bind to DNA and human serum albumin with high affinity. The results from the computational docking studies support this observed fact with experimental numbers adequately mirroring the calculated dissociation constants. The complexes bind to the two computationally-studied protein stronger than DNA. However, if we were to speculate, the anticancer results suggest that it is DNA that is most the likely target since the complex that binds strongest to this macromolecule also exhibits the best biological activity.
Supplementary Material
Scheme 1. Synthetic methodology for the complexes.
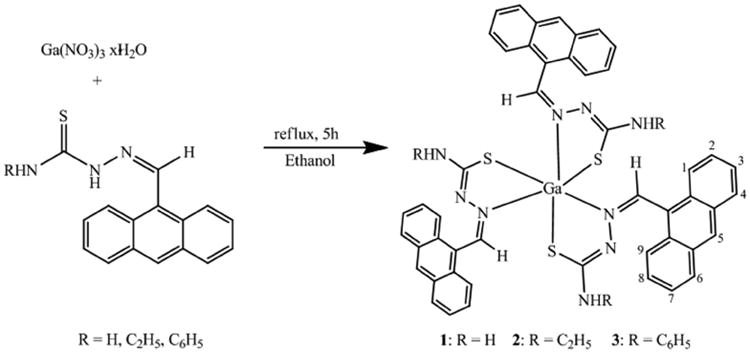
Synthesis of novel gallium thiosemicarbazone complexes
The complexes bind strongly to human serum albumin (HSA).
Complexes show potent anticancer behavior with significant therapeutic indices.
Anticancer activity does not appear to be linked to DNA binding ability.
Computational studies indicate strong bind to DNA, ribonucleotide reductase and HSA.
Acknowledgments
This project was supported by grants from the National Center for Research Resources (5P20RR016460-11) and the National Institute of General Medical Sciences (8P20GM103429-11) from the National Institutes of Health to FAB. The content is solely the responsibility of the authors and does not necessarily represent the official views of the National Center for Research Resources or the National Institutes of Health.
Footnotes
Publisher's Disclaimer: This is a PDF file of an unedited manuscript that has been accepted for publication. As a service to our customers we are providing this early version of the manuscript. The manuscript will undergo copyediting, typesetting, and review of the resulting proof before it is published in its final citable form. Please note that during the production process errors may be discovered which could affect the content, and all legal disclaimers that apply to the journal pertain.
References
- 1.Timerbaev AR. Metallomics. 2009;1:193–198. doi: 10.1039/b902861g. [DOI] [PubMed] [Google Scholar]
- 2.da Silva JG, Azzolini LS, Wardell SMSV, Wardell JL, Beraldo H. Polyhedron. 2009;28:2301–2305. [Google Scholar]
- 3.Gambino D, Fernández M, Santos D, Etcheverría GA, Piro OE, Pavan FR, Leite CQF, Tomaz I, Marques F. Polyhedron. 2011;30:1360–1366. [Google Scholar]
- 4.Arion VB, Jakupec MA, Galanski M, Unfried P, Keppler BK. J Inorg Biochem. 2002;91:298–305. doi: 10.1016/s0162-0134(02)00419-1. [DOI] [PubMed] [Google Scholar]
- 5.Green DE, Ferreira CL, Stick RV, Patrick BO, Adam MJ, Orvig C. Bioconjugate Chem. 2005;16:1597–1609. doi: 10.1021/bc0501808. [DOI] [PubMed] [Google Scholar]
- 6.Tsang BW, Mathias CJ, Fanwick PE, Green MA. J Med Chem. 1994;37:4400–4406. doi: 10.1021/jm00051a018. [DOI] [PubMed] [Google Scholar]
- 7.Harpstrite SE, Beatty AA, Collins SD, Oksman A, Goldberg DE, Sharma V. Inorg Chem. 2003;42:2294–2300. doi: 10.1021/ic034036e. [DOI] [PubMed] [Google Scholar]
- 8.Kowol CR, Berger R, Eichinger R, Roller A, Jakupec MA, Schmidt PP, Arion VB, Keppler BK. J Med Chem. 2007;50:1254–1265. doi: 10.1021/jm0612618. [DOI] [PubMed] [Google Scholar]
- 9.Chitambar CR. Expert Opin Investig Drug. 2004;13:531–541. doi: 10.1517/13543784.13.5.531. [DOI] [PubMed] [Google Scholar]
- 10.Collery P, Keppler B, Madoulet C, Desoize B. Crit Rev Oncol Hematol. 2002;42:283–296. doi: 10.1016/s1040-8428(01)00225-6. [DOI] [PubMed] [Google Scholar]
- 11.Jakupec MA, Galanski MV, Arion B, Hartinger CG, Keppler BK. Dalton Trans. 2008:183–194. doi: 10.1039/b712656p. [DOI] [PubMed] [Google Scholar]
- 12.Frezza M, Verani CN, Chen D, Dou QP. Lett Drug Des Discov. 2007;4:311–317. [Google Scholar]
- 13.Michael MA, Keppler BK. Curr Top Med Chem. 2004;4:1575–1583. doi: 10.2174/1568026043387449. [DOI] [PubMed] [Google Scholar]
- 14.Despaigne AAR, Parrilha GL, Izidoro JB, da Costa PR, dos Santos RG, Piro OE, Castellano EE, Rocha WR, Beraldo H. Eur J Med Chem. 2012;50:163–172. doi: 10.1016/j.ejmech.2012.01.051. [DOI] [PubMed] [Google Scholar]
- 15.de Olivira Bastos T, Soares BM, Cisalpino PS, Mendes IC, dos Santos RG, Beraldo H. Microbio Res. 2010;165:573–577. doi: 10.1016/j.micres.2009.10.005. [DOI] [PubMed] [Google Scholar]
- 16.Quiroga AG, Perez JM, Lopez-Solera I, Masaguer JR, Luque A, Raman P, Edwards A, Alonso C, Navarro-Ranninger C. J Med Chem. 1998;41:1399–1408. doi: 10.1021/jm970520d. [DOI] [PubMed] [Google Scholar]
- 17.Offiong OE, Martelli S. Farmaco. 1994;49:513–518. [PubMed] [Google Scholar]
- 18.Hadjipavlou-Litina D. Pharmazie. 1996;51:468–470. [PubMed] [Google Scholar]
- 19.Garcia-Tojal J, Garcia-Orad A, Serra JL, Pizarro JL, Lezamma L, Arriortua MI, Rojo T. J Inorg Biochem. 1999;75:45–54. doi: 10.1016/S0162-0134(99)00031-8. [DOI] [PubMed] [Google Scholar]
- 20.Petering DH. Bioinorg Chem. 1972;1:255–271. [Google Scholar]
- 21.West DX, Liberta AE, Padhye SB, Chikate RC, Sonawane PB, Kumbhar AS, Yerande RG. Coord Chem Rev. 1993;123:49–71. [Google Scholar]
- 22.Beckford FA, Shaloski M, Jr, Leblanc G, Thessing J, Lewis-Alleyne LC, Holder AA, Li L, Seeram NP. Dalton Trans. 2009:10757–10764. doi: 10.1039/b915081a. [DOI] [PMC free article] [PubMed] [Google Scholar]
- 23.Beckford FA, Leblanc G, Thessing J, Shaloski M, Jr, Frost BJ, Li L, Seeram NP. Inorg Chem Commun. 2009;12:1094–1098. doi: 10.1016/j.inoche.2009.08.034. [DOI] [PMC free article] [PubMed] [Google Scholar]
- 24.Cory AH, Owen TC, Barltrop JA, Cory JG. Cancer Commun. 1991;3:207–212. doi: 10.3727/095535491820873191. [DOI] [PubMed] [Google Scholar]
- 25.Reichmann ME, Rice SA, Thomas CA, Doty PJ. J Am Chem Soc. 1954;76:3047–3053. [Google Scholar]
- 26.Vijayalakshmi R, Kanthimathi M, Subramanian V, Nair BU. Biochim Biophys Acta. 2000;1475:157–162. doi: 10.1016/s0304-4165(00)00063-5. [DOI] [PubMed] [Google Scholar]
- 27.Krimm S, Bandekar J. Adv Protein Chem. 1986;38:181–364. doi: 10.1016/s0065-3233(08)60528-8. [DOI] [PubMed] [Google Scholar]
- 28.Morris GM, Huey R, Lindstrom W, Sanner MF, Belew RK, Goodsell DS, Olson AJ. J Comput Chem. 2009;16:2785–2791. doi: 10.1002/jcc.21256. [DOI] [PMC free article] [PubMed] [Google Scholar]
- 29.Geary WJ. Coordination Chemistry Reviews. 1971;7:81–122. [Google Scholar]
- 30.Spartan'14. Wavefunction, Inc.; Irvine, CA: [Google Scholar]
- 31.Clarke MJ. Coord Chem Rev. 2003;236:209–233. [Google Scholar]
- 32.Chen HM, Parkinson JA, Parsons S, Coxall RA, Gould RO, Sadler PJ. J Am Chem Soc. 2002;124:3064–3082. doi: 10.1021/ja017482e. [DOI] [PubMed] [Google Scholar]
- 33.Novakova O, Chen H, Vrana O, Rodger A, Sadler PJ, Brabec V. Biochemistry. 2003;42:11544–11554. doi: 10.1021/bi034933u. [DOI] [PubMed] [Google Scholar]
- 34.Gopal YNK, Jayoraju D, Kondapi AK. Biochemistry. 1999;38:4382–4388. doi: 10.1021/bi981990s. [DOI] [PubMed] [Google Scholar]
- 35.Groessl M, Bytzex A, Hartinger CG. Electrophoresis. 2009;30:2720–2727. doi: 10.1002/elps.200800745. [DOI] [PubMed] [Google Scholar]
- 36.Beckford FA, Shaloski M, Jr, Thessing J, Woods J, Dourth D, Didion J, Gerasimchuk N, Gonzalez-Sarrías A, Seeram NP. J Inorg Biochem. 2011;105:1019–1029. doi: 10.1016/j.jinorgbio.2011.04.008. [DOI] [PMC free article] [PubMed] [Google Scholar]
- 37.Hansen MJ. Pure Appl Chem. 2007;79:2243–2261. [Google Scholar]
- 38.Mei WJ, Liu J, Zheng CK, Lin LJ, Chao H, Li AX, Yun FC, Ji LN. Dalton Trans. 2003:1352–1359. [Google Scholar]
- 39.Pyle AM, Rehmann JP, Meshoyrer R, Kumar CV, Turro NJ, Barton JK. J Am Chem Soc. 1989;111:3051–3058. [Google Scholar]
- 40.Barton JK, Dennenberg JJ, Raphael AL. J Am Chem Soc. 1982;104:4967–4969. [Google Scholar]
- 41.He XM, Carter DC. Nature. 1992;358:209–215. doi: 10.1038/358209a0. [DOI] [PubMed] [Google Scholar]
- 42.Lacowicz JR. Principles of Fluorescence Spectroscopy. 3rd. Springer; New York: 2006. [Google Scholar]
- 43.Kragh-Hansen U, Chuang VTG, Otagiri M. Biol Pharm Bull. 2002;25:695–704. doi: 10.1248/bpb.25.695. and references therein. [DOI] [PubMed] [Google Scholar]
- 44.Eftnik R, Ghiron CA. J Phy Chem. 1976;80:486–493. [Google Scholar]
- 45.Eftnik R, Ghiron CA. Anal Biochem. 1981;44:199–227. doi: 10.1016/0003-2697(81)90474-7. [DOI] [PubMed] [Google Scholar]
- 46.Chitambar CR, Narasimhan J, Guy J, Sem DS, O'Brien WJ. Cancer Res. 1991;51:6199–6201. [PubMed] [Google Scholar]
- 47.Aye Y, Li M, Long MJC, Weiss RS. Oncogene. 2015;34:2011–2021. doi: 10.1038/onc.2014.155. [DOI] [PubMed] [Google Scholar]
Associated Data
This section collects any data citations, data availability statements, or supplementary materials included in this article.


