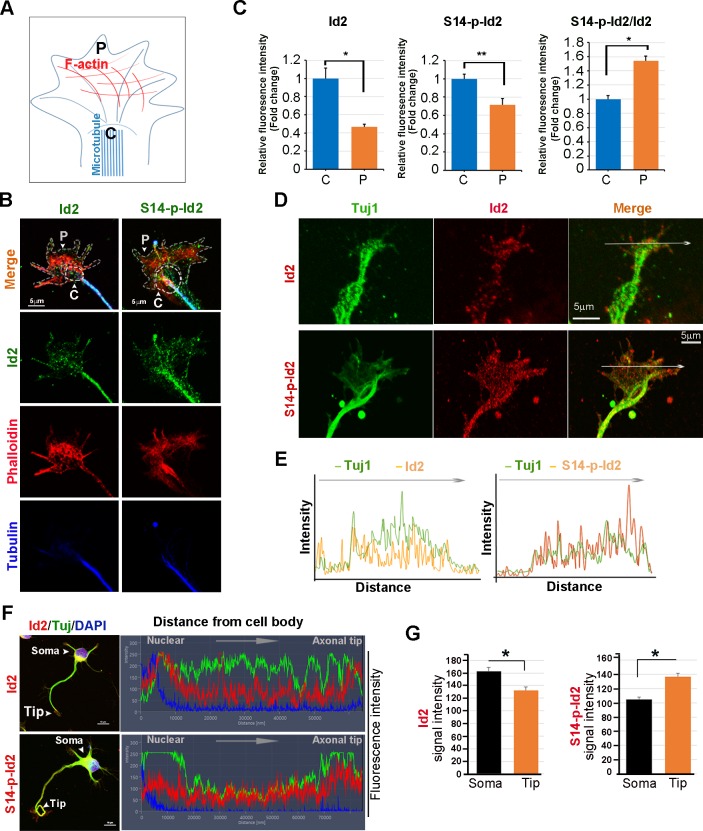
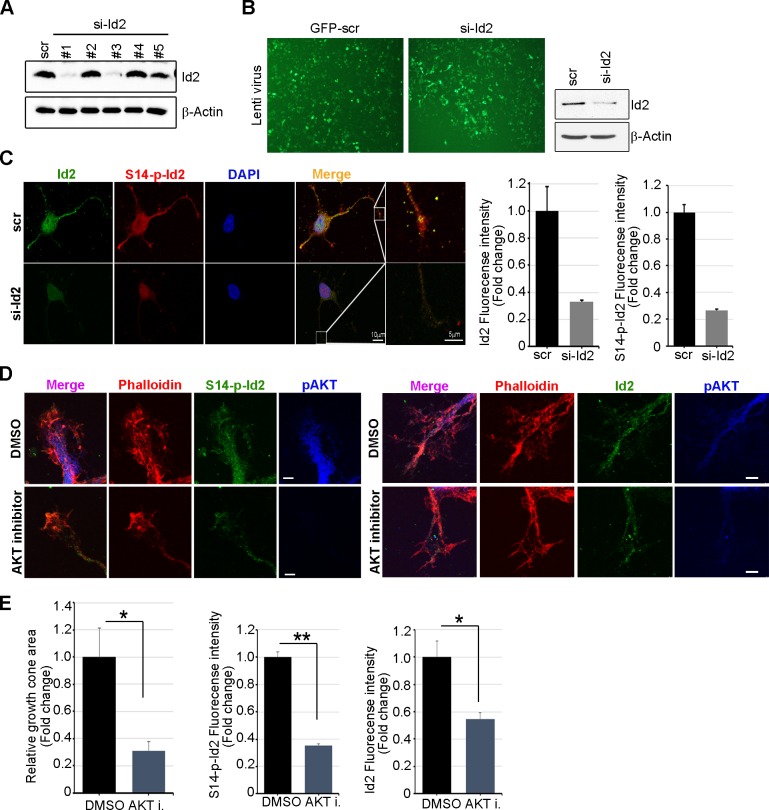
Figure 4. Akt regulates growth cone localization of Id2 in the developing neuron.
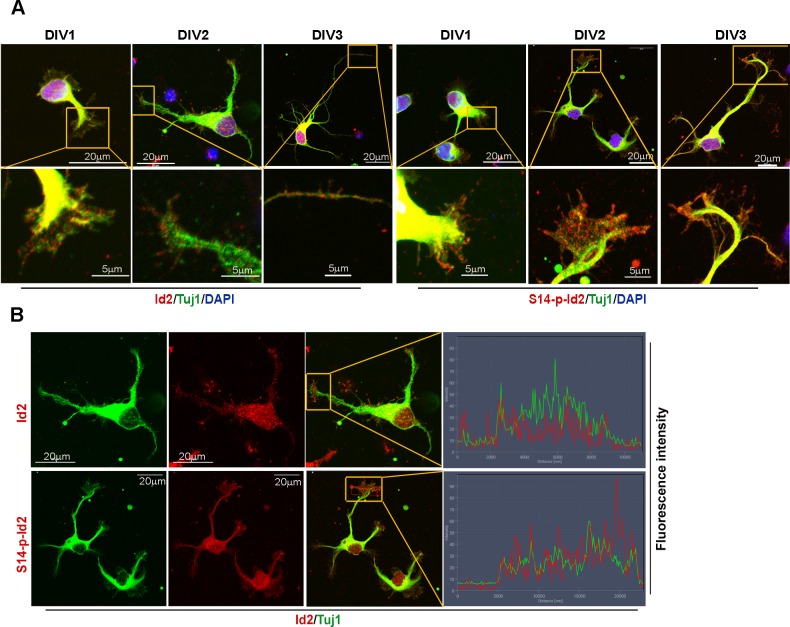
(A) Schematic diagram of growth cone, showing microtubule mostly in the central [C] region and F-actin based peripheral [P]region. (B) Representative image of Id2 or S14-phospho-Id2 (green) with phalloidin labeled F-actin (red) and beta-tubulin (Tuj1:blue) in the growth cone of hippocampal neuron (stage3:DIV3). Arrows indicate example of [P]and [C] domain. Scale bar, 5 µm. (C) Quantification of S14-phospho-Id2/ Phalloidin or Id2/ Phalloidin at [P] and S14-phospho-Id2/Tuj1 or Id2/Tuj1 at [C] domain was averaged over multiple growth cones (right and middle). The ration of S14-phospho-Id2/Id2 at [C] and [P] was shown in left. n = 35. *p<0.05. **p<0.005. [P] or [C] domain is outlined by dashed gray or white line based on immunolabeling of phalloidin or Tuj1 in (B). (D) Representative image of beta-tubulin (Tuj1:green) with Id2 or S14-phospho-Id2 (red) in DIV2 neuron. Scale bar, 5 µm. The fluorescent image of DIV 1–3 is shown in Figure 4—figure supplement 1A and the original image of neuron for this representative growth cone is placed in Figure 4—figure supplement 1B. (E) Graphs plot the fluorescence intensity of immunolabeled Id2 (red) and Tuj1 (green) or phosphor Id2 (red) and Tuj1 (green) the arrowed line in Figure 4D is shown in each growth cone image. (F) The hippocampal neuron was fixed and stained with anti-Id2 or S14-phospho-Id2 antibodies (red). The neuron was stained with the Tuj1 (green), and nuclei were counterstained with DAPI. Scale bar, left: 20 µm. Relative immunofluorescence intensity profiles of Id2 and Tuj1 along the axon from cell body to axonal tip (right). (G) Quantification of Id2 and S14-phospho-Id2 signal intensity in the soma or axonal tip respectively. *p<0.05 versus control.Data represent mean ± SEM of three independent experiments. n = 20. See also Figure 4—figure supplements 1 and 2.


