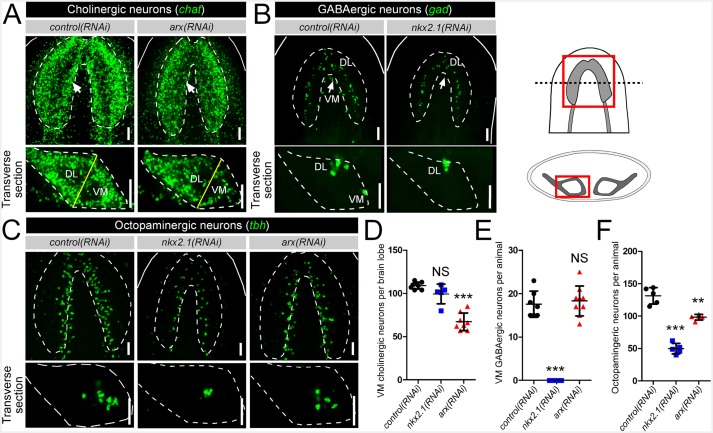
Figure 2. nkx2.1 and arx are required for the maintenance of VM neural cell types.
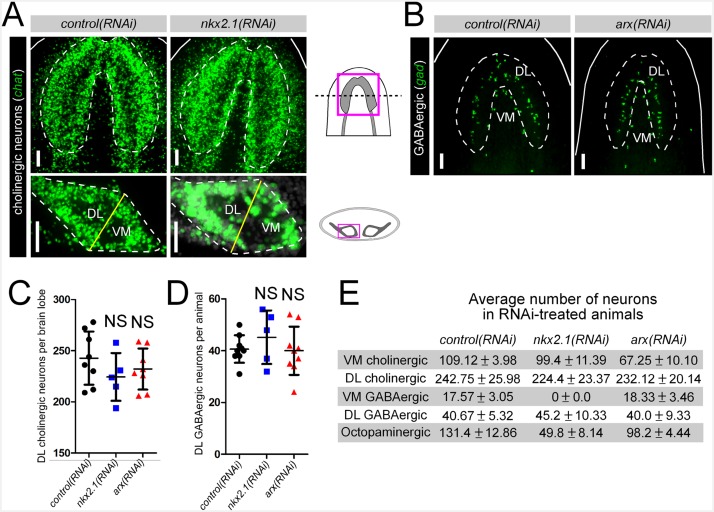
(A–C) Projected confocal image stacks showing cholinergic, GABAergic, or octopaminergic neuronal populations in RNAi-treated animals. VM neural subpopulations are highlighted by white arrows. Regions of interest are represented by cartoons at the right side of the figure. Solid white lines represent the outer border of the animal, and dashed white lines mark the outer border of the CNS. Solid yellow line demarcates the border between the VM and DL brain regions. Scale bar = 50 µm. (D–F) Quantification of VM cholinergic, VM GABAergic, and octopaminergic neurons in RNAi-treated animals. Significance levels in dot plots: **p<0.01, ***p<0.001, error bars are standard deviation. CNS, Central nervous system; DL, Dorsal-lateral; VM, Ventral-medial.


