

Abstract
Accumulating studies have indicated the influence of long non-coding RNAs (lncRNAs) on various biological processes as well as disease development and progression. However, the lncRNAs involved in bacterial meningitis and their regulatory effects are largely unknown. By RNA-sequencing, the transcriptional profiles of host lncRNAs in primary human brain microvascular endothelial cells (hBMECs) in response to meningitic Escherichia coli were demonstrated. Here, 25,257 lncRNAs were identified, including 24,645 annotated lncRNAs and 612 newly found ones. A total of 895 lncRNAs exhibited significant differences upon infection, among which 382 were upregulated and 513 were downregulated (≥2-fold, p < 0.05). Via bioinformatic analysis, the features of these lncRNAs, their possible functions, and the potential regulatory relationships between lncRNAs and mRNAs were predicted. Moreover, we compared the transcriptional specificity of these differential lncRNAs among hBMECs, human astrocyte cell U251, and human umbilical vein endothelial cells, and demonstrated the novel regulatory effects of proinflammatory cytokines on these differential lncRNAs. To our knowledge, this is the first time the transcriptional profiles of host lncRNAs involved in E. coli-induced meningitis have been reported, which shall provide novel insight into the regulatory mechanisms behind bacterial meningitis involving lncRNAs, and contribute to better prevention and therapy of CNS infection.
The central nervous system (CNS) is a shielded environment, which is protected by a variety of physiological barriers. Bacterial meningitis is a serious disease involving CNS infection, with high mortality and morbidity, and is often associated with a poor prognosis and lifelong sequelae in the survivors1. The blood–brain barrier (BBB) is composed of brain microvascular endothelial cells (BMECs), astrocytes, pericyte, and microglia, and maintains CNS homeostasis by regulating the transport of nutrients, molecules, as well as certain cells from the blood to the brain2,3,4. The formation of tight junctions is a major characteristic of BMECs, which largely blocks the entry of circulating bacterial pathogens, and is widely reported to be critical for the structure as well as the function of the BBB5. However, some bacteria, such as Streptococcus pneumoniae, Neisseria meningitidis, Haemophilus influenzae type b, Group B streptococcus and Escherichia coli K1, can nonetheless break through the BBB via different strategies, thereby invading the CNS and causing bacterial meningitis6,7,8,9,10,11.
Accumulating evidence suggests that CNS-infecting bacteria enhance BBB permeability by damaging the tight junctions of BMECs12, and several molecules have been reported to mediate this enhancement of BBB permeability, such as the matrix metallopeptidase (MMP) family, transforming growth factor (TGF) β1, vascular endothelial growth factor (VEGF) A, interleukin (IL)-1β, IL-6 and tumour necrosis factor (TNF)-α13,14,15. In the final stage of this process, a large number of inflammatory cells gain access to the cerebral parenchyma, triggering central inflammatory storm and CNS dysfunction16. Therefore, there is a need to reveal the mechanism underlying the penetration of the BBB by CNS-infecting bacteria, especially regarding how they interact with the host BBB and regulate host targets, thereby contributing to infection. Numerous studies have reported CNS-infecting bacterial invasion of the BBB, the receptors on BMECs with which these bacteria interact, the regulation of host molecules that mediate BBB disruption, as well as characterisation of microRNAs that regulate tight junction expression17. However, to our knowledge, the potential long non-coding RNAs (lncRNAs) and their possible regulatory mechanisms in CNS-infecting bacterial invasion of the host BBB have hardly been identified, but the discovery of such lncRNAs is beneficial for understanding their regulatory mechanisms in central infection.
Since the beginning of the twenty-first century, an increasing number of studies have indicated that non-coding RNAs have a wide variety of biological functions. It is generally believed that more than 40% of the genome is transcribed into mRNAs, of which less than 2% can encode proteins18. Non-coding RNAs are classified according to their length, with those less than 200 nucleotides (nt) being classified as microRNAs, while the remainder are lncRNAs19. lncRNAs were initially believed to have no biological function, but recent studies have suggested that they are widely involved in X-chromosome silencing, genomic imprinting, chromatin modification, transcriptional activation, interference, nuclear transport and other important regulatory processes20,21,22,23. By RNA sequencing (RNA-seq) technology and bioinformatic analysis, thousands of lncRNAs have been discovered in organisms from fruit flies to humans and their functions have been predicted. However, the functions of only a small number of lncRNAs have been verified in the laboratory, largely within the field of oncology24.
Research has also shown that the transcription of lncRNAs has tissue specificity and plays important roles in brain development25. Associations of the expression, sequence and configuration of lncRNAs, as well as their abnormal binding with proteins, have also been revealed to be associated with CNS diseases26. In the case of bacterial meningitis, it has been reported that microRNAs can affect the integrity of the BBB by regulating the expression of tight junctions27. However, little is known about the involvement of lncRNAs in BBB damage and brain pathology. In addition, the existence of lncRNAs involved in bacterial infection of the CNS, as well as their potential molecular regulatory mechanisms, is completely unclear.
To fully elucidate the interaction between CNS-infecting bacteria and the host BBB, as well as the regulatory mechanisms involved in this, in the current study, we applied RNA-seq and bioinformatic approaches to identify potential host lncRNAs active in primary hBMECs in response to the infection of meningitic E. coli strain PCN033, a brain isolate that has been demonstrated to disrupt the BBB as well as inducing CNS inflammatory responses28. The characteristics, potential functions, and transcriptional specificity of these lncRNAs were analyzed, and the possible correlation between lncRNAs and mRNAs was predicted. Moreover, we demonstrated significant regulatory effects of the proinflammatory cytokines on meningitic E. coli induction of lncRNAs. These observations together suggest the novel concept that lncRNAs are involved in bacterial meningitis, which should provide more regulatory host targets and contribute to further study on the pathogenic mechanisms involved in this disease, as well as better prevention and therapy for it.
Results
Identification of differentially expressed lncRNAs and mRNAs in primary hBMECs upon meningitic E. coli infection
To analyze the differences in transcriptomic profiles in primary hBMECs in response to infection, total RNAs from infected or uninfected primary hBMECs were prepared for RNA-seq following the workflow shown in Fig. 1. The RNA-seq data were generated from three uninfected and three infected groups, in which 91.7–99.3 million raw reads and 88.2–89.8 million clear reads per sample were obtained. The base percentage composition and quality distribution of each sample were analyzed (Supplemental Fig. 1). A total of 43,262 RNAs were obtained, among which 25,257 were lncRNAs and 18,005 were coding mRNAs (Table 1). Among these 25,257 lncRNAs, 24,645 lncRNAs had previously been annotated and 612 were potential novel lncRNAs that contained 757 transcripts (Supplemental Table 1 and Supplemental Fig. 2). A total of 1261 RNAs were found to have significant changes in their expression levels (increase by ≥2-fold or decrease to ≤0.5-fold, at p ≤ 0.05), which included 895 lncRNAs and 366 mRNAs (Table 1). The heat maps showed the trends of change of the lncRNAs as well as mRNAs in primary hBMECs upon infection (Fig. 2), among which the levels of 382 lncRNAs increased by ≥2-fold and 513 decreased to ≤0.5-fold. The most significantly upregulated lncRNAs (by >5-fold) and the most significantly downregulated lncRNAs (to <0.125-fold) are listed in Tables 2 and 3. Among the novel unannotated lncRNAs, XLOC_026572 (3.09-fold) and XLOC_026285 (2.75-fold) were the most highly upregulated, while XLOC_175351 (0.37-fold) and XLOC_070887 (0.37-fold) were the most downregulated (Supplemental Table 2).
Figure 1. Overview of the RNA-sequencing processes and bioinformatic analysis.
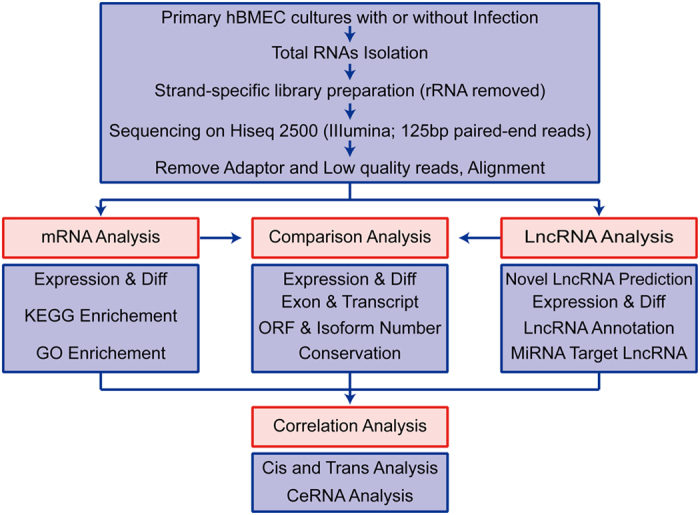
Table 1. Overview of RNA-seq data in this study.
| Transcriptome | Classification | Number |
|---|---|---|
| LncRNAs | Total | 25257 |
| Known lncRNA | 24645 | |
| Novel lncRNA | 612 | |
| Significant change(C-vs-E)* | 895 | |
| > = 2 fold increase | 382 | |
| Known lncRNA | 345 | |
| Novel lncRNA | 37 | |
| > = 2 fold decrease | 513 | |
| Known lncRNA | 497 | |
| Novel lncRNA | 16 | |
| mRNAs | Total | 18005 |
| Significant change(C-vs-E) | 366 | |
| > = 2 fold increase | 198 | |
| > = 2 fold decrease | 168 |
C-vs-E: control groups vs experimental groups.
Figure 2.

Heat maps showing unsupervised clustering of meningitic E. coli-infected primary hBMECs and uninfected primary hBMECs based on differentially expressed lncRNAs (A) and coding genes (B). The expression profiles are displayed with three samples in each group. Red represents high and green represents low relative expression. One-way analysis of variance was used for the statistical analysis. LncRNAs or mRNAs with an increase in expression of ≥2-fold or a decrease to ≤0.5-fold and with a false discovery rate-adjusted p value ≤ 0.05 were considered statistically significant.
Table 2. The most significantly up-regulated lncRNAs in primary hBMEC upon infection (>5-fold).
| Gene ID | Transcript length | Fold change | Chromosome | Strand | Start site | End site | P value |
|---|---|---|---|---|---|---|---|
| lnc-ANKRD37-1 | 668 | 46.99006489 | chr4 | + | 186317995 | 186318861 | 6.29E-94 |
| lnc-CXCL3-1 | 1641 | 22.13861796 | chr4 | − | 74902786 | 74904524 | 2.29E-24 |
| lnc-RAB11B-3 | 316 | 18.62001072 | chr19 | + | 8431472 | 8431787 | 2.02E-18 |
| lnc-RAB11B-2 | 218 | 17.17395822 | chr19 | + | 8432425 | 8432642 | 2.73E-17 |
| lnc-PERP-10 | 2592 | 16.77436303 | chr6 | − | 138186524 | 138191464 | 5.99E-39 |
| lnc-RAB11B-1 | 241 | 16.75688511 | chr19 | + | 8433896 | 8434136 | 2.91E-18 |
| lnc-PTTG1-1 | 2590 | 12.96690686 | chr5 | + | 159895253 | 159914700 | 9.15E-21 |
| lnc-CDC6-3 | 581 | 12.18444019 | chr17 | + | 38479243 | 38487420 | 1.23E-11 |
| lnc-KRT80-4 | 542 | 12.14910943 | chr12 | − | 52452243 | 52453116 | 6.89E-10 |
| lnc-C5-1 | 1052 | 9.478606858 | chr9 | − | 123686736 | 123765819 | 4.23E-10 |
| lnc-BIRC3-1 | 624 | 8.689332826 | chr11 | + | 102188215 | 102192973 | 6.49E-14 |
| lnc-SMNDC1-1 | 470 | 8.399169413 | chr10 | − | 111967608 | 111968349 | 8.05E-09 |
| lnc-IL5-1 | 5153 | 7.509940783 | chr5 | − | 131818777 | 131824724 | 3.84E-115 |
| lnc-RP11-582J16.5.1-2 | 4643 | 7.153618604 | chr8 | − | 22446386 | 22451090 | 4.09E-65 |
| lnc-RSPH9-4 | 2746 | 6.741112911 | chr6 | + | 43745457 | 43754176 | 7.88E-33 |
| lnc-PNMA2-3 | 669 | 6.721131129 | chr8 | − | 26290545 | 26291581 | 4.12E-06 |
| lnc-PDCD2L-3 | 1550 | 6.685537843 | chr19 | + | 34880012 | 34881711 | 2.28E-92 |
| lnc-FOXK2-3 | 731 | 6.581197717 | chr17 | + | 80561513 | 80602538 | 2.90E-18 |
| lnc-PDCD2L-4 | 425 | 6.210225766 | chr19 | + | 34873966 | 34893064 | 1.50E-37 |
| lnc-JUNB-1 | 296 | 6.165567819 | chr19 | + | 12902290 | 12902585 | 5.30E-09 |
| lnc-IL7-3 | 1104 | 5.965037191 | chr8 | − | 79705069 | 79740750 | 0.000110606 |
| lnc-AKR1E2-13 | 417 | 5.935724938 | chr10 | + | 3157046 | 3157462 | 8.28E-39 |
| lnc-AC037459.4.1-1 | 563 | 5.893525076 | chr8 | + | 22442367 | 22443213 | 1.66E-06 |
| lnc-GPRC5A-3 | 1363 | 5.853875789 | chr12 | + | 13052296 | 13083871 | 4.56E-41 |
| lnc-GJD3-1 | 1788 | 5.793832689 | chr17 | − | 38497121 | 38499388 | 1.33E-07 |
| lnc-HKDC1-2 | 3043 | 5.701266506 | chr10 | + | 71096998 | 71148005 | 3.49E-45 |
| lnc-HILPDA-1 | 1370 | 5.655091495 | chr7 | + | 128095957 | 128098472 | 1.77E-29 |
| lnc-FAM55C-2 | 1089 | 5.644875844 | chr3 | + | 101557620 | 101559164 | 7.44E-23 |
| lnc-VAMP2-2 | 691 | 5.58438408 | chr17 | − | 8049958 | 8050867 | 8.29E-10 |
| lnc-NUDT13-2 | 214 | 5.532423848 | chr10 | + | 74824884 | 74825225 | 2.35E-09 |
| lnc-TNNT3-4 | 4686 | 5.380136038 | chr11 | + | 1994989 | 1999674 | 1.02E-18 |
| lnc-TRIML1-7 | 357 | 5.292355107 | chr4 | + | 189027712 | 189028068 | 2.04E-08 |
| lnc-KIAA0355-1 | 378 | 5.1815575 | chr19 | + | 34869883 | 34870772 | 1.27E-23 |
| lnc-TTC21A-4 | 476 | 5.11812019 | chr3 | + | 39194258 | 39198016 | 4.48E-08 |
| lnc-SMARCAL1-2 | 1053 | 5.049579019 | chr2 | + | 217385437 | 217394308 | 4.33E-45 |
| lnc-LRP1-2 | 488 | 5.028288541 | chr12 | + | 57271765 | 57492703 | 2.92E-11 |
| lnc-MRPL14-4 | 4230 | 5.014730246 | chr6 | − | 44036825 | 44041054 | 1.41E-06 |
Table 3. The most significantly down-regulated lncRNAs in primary hBMEC upon infection (<0.125-fold).
| Gene ID | Transcript length | Fold change | Chromosome | Strand | Start site | End site | P value |
|---|---|---|---|---|---|---|---|
| lnc-PRSS16-1 | 258 | 0.031924198 | chr6 | + | 27198177 | 27198434 | 7.89E-19 |
| lnc-SLC1A2-4 | 2206 | 0.036400423 | chr11 | − | 35254171 | 35256403 | 8.08E-25 |
| lnc-OLFML3-5 | 4134 | 0.03753049 | chr1 | + | 114925931 | 114930274 | 7.79E-17 |
| lnc-DHX9-1 | 631 | 0.051312967 | chr1 | + | 182858285 | 182858915 | 2.50E-13 |
| lnc-ITGA11-1 | 2216 | 0.061651513 | chr15 | − | 68591128 | 68593343 | 2.54E-10 |
| lnc-FAM21A-2 | 1885 | 0.068887187 | chr10 | + | 52061404 | 52063940 | 1.15E-11 |
| lnc-PPP2R5B-6 | 971 | 0.070790833 | chr11 | + | 64529676 | 64530646 | 2.39E-11 |
| lnc-GAPT-3 | 332 | 0.073262196 | chr5 | + | 57748236 | 57748567 | 4.67E-13 |
| lnc-MKLN1-6 | 621 | 0.075055731 | chr7 | + | 130556215 | 130556835 | 1.23E-13 |
| lnc-LUC7L2-1 | 3165 | 0.077454351 | chr7 | + | 139115033 | 139118197 | 5.27E-20 |
| lnc-DIRC1-1 | 924 | 0.08141012 | chr2 | − | 189462696 | 189464061 | 4.79E-12 |
| lnc-LUC7L2-2 | 1774 | 0.081633575 | chr7 | + | 139118383 | 139120156 | 5.49E-10 |
| lnc-EPB41-4 | 1287 | 0.084252624 | chr1 | + | 29471992 | 29473278 | 9.92E-12 |
| lnc-MIOS-2 | 731 | 0.091630953 | chr7 | + | 7649827 | 7650557 | 2.95E-08 |
| lnc-LMOD2-1 | 4608 | 0.092163458 | chr7 | + | 123307790 | 123312397 | 1.35E-10 |
| lnc-NXPH2-1 | 2764 | 0.092739421 | chr2 | − | 139357233 | 139359996 | 7.25E-09 |
| lnc-PCIF1-1 | 2345 | 0.09387676 | chr20 | + | 44557746 | 44560154 | 4.66E-19 |
| lnc-MRPS14-1 | 3629 | 0.097804002 | chr1 | − | 174964447 | 174968075 | 1.27E-28 |
| lnc-C7orf11-5 | 1382 | 0.100245336 | chr7 | − | 39659893 | 39662092 | 8.29E-13 |
| lnc-CXCR5-1 | 1419 | 0.101007335 | chr11 | + | 118662550 | 118665346 | 6.93E-07 |
| lnc-RP11-1007G5.2.1-5 | 2304 | 0.101462437 | chr11 | + | 128283245 | 128323809 | 7.43E-07 |
| lnc-IVNS1ABP-3 | 1989 | 0.102964335 | chr1 | − | 185261516 | 185263504 | 3.85E-35 |
| lnc-ZC3H12C-2 | 1548 | 0.10315733 | chr11 | + | 110087285 | 110091622 | 5.11E-12 |
| lnc-PRRC2C-2 | 3210 | 0.103549514 | chr1 | + | 171564842 | 171568051 | 6.30E-22 |
| lnc-LEKR1-5 | 4233 | 0.106612875 | chr3 | + | 156855762 | 156860654 | 1.51E-13 |
| lnc-ALPK2-7 | 740 | 0.10697724 | chr18 | − | 56422091 | 56425074 | 6.17E-13 |
| lnc-CCDC7-4 | 333 | 0.110848641 | chr10 | + | 32555217 | 32558039 | 2.30E-06 |
| lnc-HDAC9-11 | 2309 | 0.111188885 | chr7 | + | 17812631 | 17814939 | 6.22E-07 |
| lnc-FAM187B-4 | 914 | 0.111260248 | chr19 | − | 35771523 | 35772436 | 2.42E-06 |
| lnc-CYP3A43-1 | 4399 | 0.112600764 | chr7 | + | 99517494 | 99522933 | 1.99E-14 |
| lnc-RPN2-2 | 347 | 0.114674146 | chr20 | + | 35875080 | 35875426 | 3.54E-06 |
| lnc-SREK1-3 | 384 | 0.116802856 | chr5 | + | 65486852 | 65487235 | 4.37E-06 |
| lnc-LANCL2-7 | 3944 | 0.116859013 | chr7 | + | 55280605 | 55284548 | 4.60E-17 |
| lnc-ABT1-5 | 4732 | 0.120158068 | chr6 | + | 26630055 | 26634786 | 1.59E-13 |
| lnc-PRRC2C-3 | 868 | 0.120740112 | chr1 | + | 171568253 | 171569120 | 1.16E-07 |
| lnc-ABI1-7 | 2535 | 0.125047496 | chr10 | − | 26984020 | 26986554 | 3.26E-06 |
| lnc-CLDN24-2 | 1423 | 0.127303629 | chr4 | − | 184245123 | 184254636 | 2.94E-07 |
We also demonstrated a total of 366 coding mRNAs for which the expression increased by ≥2-fold or decreased to ≤0.5-fold, among which 198 mRNAs were significantly upregulated and 168 downregulated (Table 1). Detailed information on the differentially expressed mRNAs is listed in Supplemental Table 3. The GO, WEGO term, and KEGG pathway analyzes highlighted some substantially enriched pathways in this profile, including toll-like receptor, p53, NF-kappa B, MAPK, NOD-like receptor, HTLV-I infection, osteoclast differentiation and other important signalling pathways (Supplemental Fig. 3), many of which are closely associated with cell growth, differentiation, environmental adaptation, inflammatory responses and other important cellular physiological/pathological processes.
LncRNA Characterization
We observed that the lncRNA transcripts from primary hBMEC are shorter than the mRNAs (Fig. 3A), and the lncRNAs also tend to contain fewer exons (Fig. 3B). Both lncRNAs and mRNAs have various numbers of transcripts. The majority of lncRNAs identified in our study contain one to two transcripts, while most mRNAs have one to four (Fig. 3C). The open reading frame lengths of mRNAs were greater than those of lncRNAs (Fig. 3D). Fifty-three of the newly identified lncRNAs were differentially transcribed with an increase by ≥2-fold or a decrease to ≤0.5-fold, accounting for 8.7% of the total (Supplemental Table 2), but only 3.4% of the annotated lncRNAs exhibited significant changes (Supplemental Table 4). The overall distribution and number of these differentially expressed lncRNAs and mRNAs are displayed in a volcano plot (Fig. 3E). Box plots were also created to show the characteristics of lncRNA and mRNA expression in each sample (Fig. 3F). Using PhastCon software, we found that lncRNAs were less conserved than mRNA transcripts and the sequences of the newly identified lncRNAs are conserved at similar levels to those of the annotated lncRNAs (Fig. 3G). The level of conservation of lncRNAs was also analyzed among different species, including human, mouse, rat and fruit fly; we observed that lncRNAs, as well as mRNAs of human and mouse, were more similar to each other than those of rat and fruit fly (Fig. 3H).
Figure 3. LncRNA genomic features in primary hBMECs.

(A) Transcript lengths of 25,257 lncRNAs (red) and 18,005 mRNAs (green). (B) Exon numbers of lncRNAs and mRNAs. (C) Transcript numbers of lncRNAs and mRNAs. (D) Open reading frame length distribution of lncRNAs and mRNAs. (E) Volcano plots of the overall distribution of lncRNAs and mRNAs. (F) Box plots showing the expression density distribution of lncRNAs and mRNAs in each sample. (G) The cumulative distributions of median PhastCons score for various kinds of transcript. (H) Conservation score comparison for lncRNAs and mRNAs in human, mouse, rat and fruit fly.
Functional annotation and correlation analysis of the LncRNAs
Since lncRNAs largely function in gene regulation, we next annotated the lncRNAs identified in this study based on the function of the genes that they regulate, by trans target gene analysis, cis target gene analysis and competing endogenous RNA (ceRNA) analysis, etc.29. It has been reported that lncRNAs can regulate overlapping and neighbouring genes30. Considering the correlation between lncRNA and genes, we selected genes that overlap or are 100 kb upstream or downstream of the lncRNAs as candidate target genes regulated by lncRNAs. To investigate the relationship between lncRNAs and their neighbouring coding genes, we analyzed gene pairs formed by lncRNAs and their neighbouring genes, and identified 15,957 coding gene/coding gene pairs (2,467 in divergent) and 40,237 lncRNA/coding gene pairs (5997 in divergent) (Fig. 4A). Divergent lncRNAs were a special kind of lncRNAs that are transcribed in the opposite direction to their nearby coding genes, and could regulate the expression of their chromosomal neighbour genes. For example, recent study has indicated that divergent lncRNAs could regulate their adjacent mRNA in pluripotent cells30. Among these coding genes near lncRNAs, there was a relative higher number of genes involved in the HIF-1 signalling pathway, MAPK signalling pathway, regulation of actin cytoskeleton, as well as tight junction (Fig. 4B). The novel lncRNAs and their associated mRNAs identified by cis target gene analysis are shown in Supplemental Table 5, while the annotated lncRNAs and their associated mRNAs are shown in Supplemental Table 6. The lncRNAs and their associated mRNAs, both of which exhibited significant changes in their expression levels, are listed in Table 4; the correlation coefficient between lnc-ANKRD37-1 and ANKRD37 was the highest.
Figure 4. Analysis of lncRNA functional annotation.

(A) Number of gene pairs formed by lncRNAs and mRNAs located close together in the genome. (B) KEGG annotation of the functions of genes in the vicinity of lncRNAs. Red shows higher expression and blue shows lower expression. The number of differentially expressed genes in the signalling pathway is shown in parentheses.
Table 4. The correlation of both significantly changed lncRNAs and mRNAs (correlation > 0.95).
| chr | LncRNA | lncRNA Fold change | mRNA | mRNA Fold change | Relationship | Correlation |
|---|---|---|---|---|---|---|
| chr4 | lnc-ANKRD37-1 | 46.99006489 | 353322 | 26.69178716 | overlap | 0.998711042 |
| chr12 | lnc-DDX47-3 | 2.218881729 | 9052 | 2.099410084 | Upstream:1525 | 0.997653117 |
| chr6 | lnc-PERP-10 | 16.77436303 | 7128 | 14.74790374 | overlap | 0.996990229 |
| chr19 | lnc-RAB11B-3 | 18.62001072 | 51129 | 14.73578488 | Intron | 0.996724703 |
| chr15 | lnc-C15orf58-5 | 3.098221466 | 10509 | 2.65724822 | Downstream:7766 | 0.996668914 |
| chr17 | lnc-KDM6B-1 | 3.42613139 | 92162 | 2.822479299 | Downstream:10093 | 0.99661261 |
| chr22 | lnc-HORMAD2-2 | 4.762168667 | 3976 | 3.999293052 | overlap | 0.99629189 |
| chr19 | lnc-MIDN-1 | 2.489938048 | 90007 | 2.169345738 | Upstream:2198 | 0.996286441 |
| chr8 | lnc-RP11-582J16.5.1-2 | 7.153618604 | 541565 | 2.604112905 | Downstream:6023 | 0.994946482 |
| chr1 | lnc-CLCNKB-1 | 2.594003457 | 1969 | 2.993281579 | overlap | 0.994383584 |
| chr5 | lnc-ARRDC3-1 | 3.784964094 | 57561 | 7.941640198 | Downstream:54321 | 0.994346909 |
| chr6 | lnc-RSPH9-4 | 6.741112911 | 7422 | 7.54797686 | overlap | 0.993675818 |
| chr7 | lnc-HILPDA-1 | 5.655091495 | 29923 | 6.650408682 | overlap | 0.990959583 |
| chr4 | lnc-CXCL3-1 | 22.13861796 | 2921 | 30.27122178 | overlap | 0.988555244 |
| chr19 | lnc-JUNB-1 | 6.165567819 | 3726 | 8.608071135 | overlap | 0.987643134 |
| chr1 | lnc-TARDBP-3 | 0.384737841 | 10747 | 0.192001568 | Downstream:14269 | 0.987115322 |
| chr3 | lnc-FAM55C-1 | 4.128392214 | 64332 | 2.214397163 | Downstream:20705 | 0.986498767 |
| chr10 | lnc-SEC24C-2 | 4.677854021 | 170384 | 2.454926787 | Intron | 0.985899226 |
| chr20 | lnc-RP11-93B14.6.1-6 | 3.286429152 | 100127888 | 4.232840128 | Downstream:11678 | 0.983603854 |
| chr19 | lnc-APLP1-2 | 4.553517267 | 84807 | 3.589470398 | overlap | 0.982991401 |
| chr8 | lnc-TMEM75-7 | 2.387615886 | 100302161 | 2.256720893 | overlap | 0.981478173 |
| chr1 | lnc-ATP6V1G3-4 | 0.448230773 | 5788 | 0.403181123 | Upstream:44741 | 0.981281791 |
| chr11 | XLOC_026572 | 8.516036227 | 330 | 6.938568258 | overlap | 0.980157008 |
| chrX | lnc-SAT1-1 | 4.537743441 | 6303 | 3.686753603 | overlap | 0.979808008 |
| chr6 | lnc-RAB44-3 | 3.514233388 | 1026 | 2.63619118 | overlap | 0.979207926 |
| chr9 | lnc-C5-1 | 9.478606858 | 7185 | 3.005310388 | overlap | 0.975070872 |
| chr12 | lnc-GRASP-2 | 3.348442864 | 3164 | 7.475924504 | Downstream:7490 | 0.974898217 |
| chr14 | lnc-STRN3-1 | 0.332706964 | 100506071 | 0.430444757 | overlap | 0.97373004 |
| chr3 | lnc-TREX1-6 | 4.153860311 | 5210 | 3.817994435 | Downstream:1592 | 0.973470032 |
| chr3 | lnc-TTC21A-4 | 5.11812019 | 64651 | 5.743459549 | overlap | 0.971352242 |
| chr19 | lnc-ZC3H4-1 | 4.861114927 | 27113 | 2.308751662 | overlap | 0.969394316 |
| chr19 | XLOC_075639 | 3.46201855 | 2696 | 2.335654694 | overlap | 0.968372395 |
| chr17 | lnc-CDC6-3 | 12.18444019 | 5914 | 3.503794106 | overlap | 0.962516599 |
| chr6 | lnc-ARHGAP18-1 | 0.358075817 | 3908 | 0.402223701 | Upstream:7060 | 0.961452699 |
| chr7 | lnc-LUC7L2-1 | 0.077454351 | 100129148 | 0.314493041 | Upstream:2760 | 0.961152676 |
| chr11 | lnc-TIGD3-3 | 3.001327839 | 283131 | 2.399620065 | Downstream:32605 | 0.95972495 |
| chr12 | lnc-MYO1A-2 | 3.608614563 | 4665 | 3.930843701 | Downstream:20911 | 0.955560113 |
| chr12 | lnc-TAS2R10-1 | 0.293147095 | 50839 | 0.288537353 | Upstream:4804 | 0.954639577 |
| chr1 | lnc-HIST2H2AA3-1 | 2.602022887 | 337873 | 2.793967037 | Downstream:1167 | 0.954560596 |
| chr3 | lnc-RFC4-1 | 0.395943408 | 619567 | 0.386907339 | Downstream:616 | 0.951230101 |
| chr10 | lnc-PFKP-31 | 0.355732849 | 1316 | 2.508651384 | Downstream:215 | −0.9729167 |
Apart for the above-mentioned genes near lncRNAs, lncRNAs can also regulate gene expression by a trans effect over a long distance31. The results for such lncRNAs are shown in Supplemental Table 7. Five pairs of genes, such as lnc-NEUROD2-1 and ZNF546, were identified in the trans analysis.
Small RNAs are a large class of regulatory molecules that are found in almost all organisms. A previous study suggested that the function of small RNAs is controlled by nearby lncRNAs32. Here, small RNAs potentially associated with the lncRNAs and within 100 kb of them in the genome were also analyzed, the results of which are shown in Supplemental Table 8. Recent studies have shown that miRNAs can regulate not only gene expression, but also the transcription of lncRNAs25. By using the miRNA target gene prediction software miRanda, we observed that large numbers of miRNAs can bind to different lncRNAs (Supplemental Table 9).
Recent genomic studies have suggested that some lncRNAs are precursors of miRNAs, for which the transformation into mature miRNAs occurs via cutting by the Drosha and Dicer enzymes33. We thus compared our lncRNAs to miRBase to predict the possible miRNA precursors of lncRNAs, and found that seven lncRNAs have the potential to be precursors of miRNA (Supplemental Table 10).
Finally, lncRNAs can act as ceRNAs, which have a miRNA binding site and can regulate the level of miRNA, thus affecting its target genes34. Here, via a series of bioinformatic methods, we analyzed the lncRNAs as well as mRNAs that possibly target the same miRNA and found that 6941 pairs of lncRNA and mRNA may have the same miRNA binding site (Supplemental Table 11).
Real-time polymerase chain reaction (PCR) verification of lncRNAs
Thirty differentially expressed lncRNAs with the most significant changes were selected for verification of their expression levels by quantitative real-time PCR. The results demonstrated that the upregulation (Fig. 5A) or downregulation (Fig. 5B) of the lncRNAs showed the same trends as in the RNA-seq data.
Figure 5. Quantitative PCR verification of the transcription of lncRNAs in primary hBMECs after meningitic E. coli infection.

The relative expression levels of the most highly differentially expressed lncRNAs as indicated were examined using qPCR in primary hBMECs that were treated with meningitic E. coli for 3 h. Data from RNA-seq were highly consistent with the qPCR results. Data are expressed as mean ± SEM from three separate experiments.
Proinflammatory cytokines differentially regulate lncRNAs in primary hBMECs
It was previously reported that cytokines can regulate the transcription of lncRNAs; for example, the transcription of lncRNAs can be affected by IL-4 and interferon-γ in macrophages35. Our early work has also demonstrated that the infection of meningitic E. coli PCN033 can induce a strong inflammatory response in vivo and in vitro28. We therefore investigated the effects of stimulation by diverse cytokines on the transcription of lncRNAs in primary hBMECs. Proinflammatory cytokines, including TNF-α, IL-1β, IL-6, IL-8, GRO-α and MIP-2, were used at a concentration of 10 ng/mL. As shown in Fig. 6, lnc-ANKRD37-1, lnc-RAB11B-3, lnc-PTTG1-1 and lnc-BIRC3-1, the levels of which were significantly increased in response to meningitic E. coli infection, were differentially regulated by the stimulation of different cytokines. GRO-α and MIP-2 significantly decreased the transcription of lnc-ANKRD37-1; TNF-α and IL-1β significantly increased the transcription of lnc-PTTG1-1 and lnc-BIRC3-1, while IL-6 significantly decreased the level of lnc-PTTG1-1. Notably, lnc-RAB11B-3 was downregulated by most of these inflammatory cytokines. Likewise, lnc-PRSS16-1, lnc-OLFML3-5 and lnc-FAM21A-2, which were all downregulated by bacterial challenge in our study, also exhibited different types of regulation in response to cytokines. For example, TNF-α and IL-6 positively regulated lnc-PRSS16-1, IL-1β and GRO-α downregulated lnc-OLFML3-5, and IL-1β significantly decreased the transcription of lnc-FAM21A-2. Taken together, these findings suggest that the proinflammatory cytokines and chemokines could differentially regulate the host lncRNAs. However, the specific regulatory mechanisms of these inflammatory factors on host lncRNAs, as well as their corresponding biological effects, require further investigation.
Figure 6. IL-8, MIP-2, GRO-α, IL-1β, IL-6 and TNF-α alter the expression of lncRNAs in primary hBMECs.
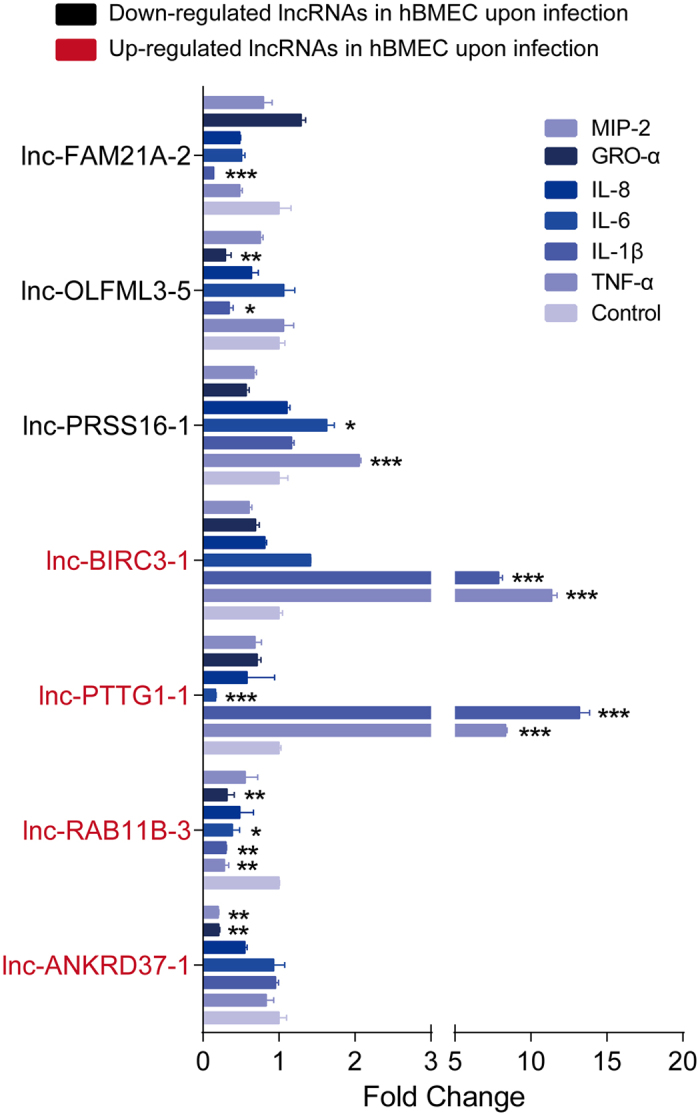
Cytokines at a concentration of 10 ng/mL were used to stimulate primary hBMECs for 24 h, and the transcription of these lncRNAs were investigated via qPCR. Data are expressed as mean ± SEM from three separate experiments.
Cell-type-specificity analysis of the differentially expressed lncRNAs
We next investigated the transcriptional specificity of the differentially expressed lncRNAs among different host cells in response to infection. Since our work was conducted on hBMEC, which is a cerebral microvascular endothelial cell, we thus chose another cerebral-born cell line U251, a human astrocyte, to analyze the transcription of lncRNAs. Meanwhile, since hBMEC is the brain vascular endothelial cell, we therefore tested the transcription of lncRNAs in a different, not brain-derived vascular endothelial cell HUVEC, a human umbilical vein endothelial cell line. We found that lnc-ANKRD37-1, lnc-CDC6-3, lnc-C5-1, lnc-BIRC3-1 and lnc-RP11-582J16.5.1-2 were upregulated in all of these three cell lines (by ≥2-fold) (Figs 5A and 7A,C), but exhibited responses of various intensities to meningitic E. coli infection. We moreover observed that the levels of lnc-CXCL3-1, lnc-PERP-10, lnc-PTTG1-1, lnc-IL5-1 and lnc-RSPH9-4 were increased in both brain-derived cells (≥2-fold): hBMECs and U251 cells, but not in the peripheral endothelial cells HUVECs, suggesting that these differentially expressed lncRNAs might be specifically produced in the brain upon infection. In addition, lnc-RAB11B-3, lnc-RAB11B-2, lnc-RAB11B-1 and lnc-KRT80-4 were found to be induced in hBMECs and HUVECs (≥2-fold) but not in U251 cells (Figs 5A and 7A,C), suggesting that these differentially expressed lncRNAs might typically be transcribed in endothelial cells. More importantly, we found that lnc-SMNDC1-1 was significantly induced in hBMECs but not in U251 cells and HUVECs, suggesting that this lncRNA is involved in meningitic E. coli penetration of the BBB (Figs 5A and 7A,C).
Figure 7. Transcriptional levels of lncRNAs in U251 and HUVEC cells in response to meningitic E. coli challenge.

The relative expression levels of the 30 most differentially expressed lncRNAs as indicated were examined using qPCR. Lnc-CXCL3-1 and lnc-C5-1 was the most significantly upregulated lncRNAs in U251 cells. Lnc-ITGA11-1 and lnc-DIRC1-1 almost maintained their expression levels in U251 cells. In contrast, lnc-ANKRD37-1 and lnc-RAB11B-1 were the lncRNAs that increased the most in HUVECs, but lnc-CXCL3-1 and lnc-PTTG1-1 were almost unchanged in these cells. Similarly, all the downregulated lncRNAs in primary hBMECs were significantly decreased in HUVECs upon infection. The lnc-SMNDC1-1 was undetectable in both U251 and HUVEC cells, which was marked by the empty bar graphs with # symbol. Data are expressed as mean ± SEM from three separate experiments.
We also investigated the lncRNAs with significantly decreased expression in U251 cells and HUVECs in response to infection. We identified only two lncRNAs in U251 cells, lnc-ITGA11-1 and lnc-DIRC1-1, for which the levels were not affected by meningitic E. coli infection, while the remaining ones exhibited similar decreases in hBMECs, U251 cells and HUVECs (Fig. 7B and D). This suggests that the downregulation of these lncRNAs was not cell-specific in response to meningitic E. coli.
Discussion
The aim of this study is to explore the potential key host lncRNAs that are involved in bacterial meningitis. Via RNA-seq approach, we identified and characterized the differentially expressed lncRNAs in primary hBMECs in response to meningitic E. coli. A total of 25,257 lncRNAs were identified here, 24,645 of which have already been annotated and 612 of which are potentially novel. Among these, the expression levels of 895 lncRNAs were significantly changed in response to infection, among which 382 lncRNAs were significantly increased and 513 were decreased. We also investigated the potential regulatory effects of the proinflammatory cytokines on the transcription of lncRNAs, as well as lncRNA specificity in different cells. To our knowledge, this is the first demonstration of the differential induction of host lncRNAs in primary hBMECs by meningitic E. coli, implying that lncRNAs may have potential regulatory roles in the course of bacterial meningitis.
By characterizing the differentially expressed lncRNAs, we found that they possess certain characteristics in common with those reported previously. For example, the lncRNAs are shorter than mRNAs, with fewer exons, fewer transcripts and less conservation than protein-coding mRNAs. We also found that the sequences of the newly identified lncRNAs are conserved at similar levels to those of the annotated lncRNAs. Notably, via correlation analysis, we demonstrated a potential association of these lncRNAs with miRNAs. The miRNAs have been shown to play a critical role in regulating the biological function of endothelial cells, and previous research indicated that miRNAs can affect the integrity of the BBB and blood–tumour barrier by decreasing the expression of tight junctions. For example, miR-155, miR-18a and miR-34c were shown to be able to downregulate ZO-1, occludin and claudin-5 expression, thereby, enhancing barrier permeability36,37,38. LncRNAs were also reported to be involved in brain development as well as in some CNS diseases39,40.
Recent studies have demonstrated that lncRNAs can regulate the expression of their neighbouring genes30. It is well known that tight junction expression is regulated by many factors41,42, but whether lncRNAs are directly involved in this regulation has remained unclear. However, in our correlation results, lnc-TAF9-1 and occludin mRNA were shown to potentially be associated with tight junction regulation (Supplemental Table 6), and our previous data indicate that meningitic E. coli induction of VEGFA and Snail-1 downregulated the expression of tight junctions28. However, whether VEGFA and Snail-1 can be regulated by host lncRNAs was still unclear. Fortunately, our data reveal an extremely strong correlation between lnc-RSPH9-4 and VEGFA (Table 4), implying that lnc-RSPH9-4 may involve in the induction of VEGFA by meningitic E. coli. A recent study also showed that lnc-SPRY4-IT1 regulates intestinal epithelial barrier function by modulating the expression levels of tight junctions43. In embryonic zebrafish, lnc-tie-1AS directly binds mRNA tie-1 and inhibits its transcription, leading to specific defects in vascular endothelial adherens junctions and tight junctions. In addition, lnc-tie-1AS significantly inhibits VEGF-induced endothelial tube formation in HUVEC cultures by decreasing the level of Tie-1 protein and damages the endothelial cell junctions44. Here, we propose that lncRSPH9-4 regulates bacterial-induced VEGFA, which was shown by our previous study to regulate tight junctions. However, further investigation is required to determine how this lncRNA regulates VEGFA, and even the expression of tight junctions. The adhesion molecules VCAM-1 and ICAM-1 have been reported to influence transcellular or paracellular T-cell diapedesis across the BBB45. In a study of portal vein tumour thrombus, lnc-ICR was reported to contribute to the development of disease by regulating ICAM-146. Here, our correlation analysis predicted the possible association of lnc-ZGLP1-3 with ICAM-1, suggesting that the former is a regulator mediating the inflammatory response in the CNS. However, this hypothesis requires verification. In the literature, there is also support for the association of lncRNAs with small RNAs; for example, lnc-TUG1 is known to regulate blood–tumour barrier permeability by targeting miR-144. Knockdown of lnc-MALAT1 increases blood–tumour barrier permeability by upregulating miR-14047,48. The data obtained in this study imply that there might be a regulatory relationship between the identified lncRNAs and small RNAs. Although the primary finding in this report is the differential induction of host lncRNAs in primary hBMECs in response to meningitic E. coli infection, there is a need to undertake further investigation of the specific correlation with a certain lncRNA, as well as its regulatory effect in the process of bacterial meningitis.
It has been reported that cytokines can regulate the transcription of lncRNAs32. For example, in Kawasaki disease, TNF-α induces vascular endothelial cell apoptosis by causing the overexpression of pregnancy-induced non-coding RNA49. Here, E. coli-induced cytokines, such as TNF-α, IL-1β, IL-6, IL-8, GRO-α and MIP-2, were selected to stimulate the primary hBMECs. Upon stimulation, we observed various regulatory effects of these cytokines and chemokines on the lncRNAs. Significantly, both TNF-α and IL-1β induced marked upregulation of lnc-PTTG1-1 and lnc-BIRC3-1. In terms of the functions of the genes associated with these lncRNAs, PTTG1 is an important oncogenic transcriptional factor implicated in various malignancies involved in epithelial–mesenchymal transition50. BIRC3 is closely related to the apoptosis inhibitory factor family and plays pivotal roles in the regulation of apoptosis and NF-κB signalling51. Given this background, the induction of lnc-PTTG1-1 and lnc-BIRC3-1 by cytokines, the specific regulatory mechanisms involved, as well as their associated phenotypes in hBMECs are under our investigations. Meanwhile, our correlation analysis indicated that there is a strong correlation between lncRNAs and cytokines. For example, lnc-CXCL3-1 and GRO-3 exhibited synchronous increases of more than 20-fold, with a correlation coefficient of up to 0.989, providing a potential novel direction for future research.
Previous studies have suggested that lncRNAs exhibit tissue-specific and species-specific expression patterns in multiple diseases or development models52,53. In this study, we demonstrated that lncRNAs exhibit various transcription patterns in primary hBMECs upon meningitic E. coli challenge; those lncRNAs with the greatest changes in expression were also confirmed by qPCR. We also investigated these significantly differentially expressed lncRNAs in another two cell lines, U251 and HUVECs, to analyze their transcriptional specificity. Lnc-CXCL3-1, lnc-PERP-10, lnc-PTTG1-1, lnc-IL5-1 and lnc-RSPH9-4 were excessively transcribed in cerebral cell lines, primary hBMECs and U251, but almost unchanged in HUVECs. In terms of the functions of the genes associated with these lncRNAs, CXCL3 is a member of the chemokine family and involved in many pathophysiological processes, such as inducing leukocyte migration to specific inflammatory sites and promoting carcinogenesis54. PERP was first identified as a p53 effector, and has since been shown to play roles in development, caspase activation and cancer55. IL-5, one of the most important interleukins, is mainly secreted by macrophages and T cells. It has been confirmed to have multiple biological functions, including promoting the differentiation of B-1 cells56. In contrast, lnc-RAB11B-1, lnc-RAB11B-2 and lnc-RAB11B-3, which are all around the mRNA Rab11, were shown to be upregulated in two kinds of endothelial cells, primary hBMECs and HUVECs, but not in U251 cells. Rab11 is reported to be associated with recycling endosomes and has been confirmed to regulate vesicular trafficking through the recycling of endosomal compartments, the plasma membrane and early endosomes to the trans-Golgi network57. In the literature, it is indicated that meningitic E. coli transmigrates through the BBB enclosed in a vacuole without multiplying intracellularly, and it must maintain the ability to traffic in BMECs as live bacteria, during which it must prevent lysosomal fusion, thereby avoiding lysosomal enzyme degradation16. However, it is currently poorly understood whether Rab11 is required in this process and which regulatory mechanisms involving Rab11 may be associated with this. Notably, we observed the specific induction of lnc-SMNDC1-1 in hBMECs, but not in the other two cell lines, in response to meningitic E. coli. The level of lnc-SMNDC1-1 increased more than 8-fold upon infection, and we were able to correlate this lncRNA with the protein-coding gene MXI1. However, the specific role of lnc-SMNDC1-1 and its possible regulatory effects, as well as the mechanisms involved, remain to be uncovered.
In conclusion, these findings indicate that lncRNAs are endogenous regulators that are responsible for certain pathophysiological phenotypes in bacterial meningitis. However, the precise regulatory mechanisms involving individual lncRNAs require more experimental evidence. In previous studies, the differential lncRNA transcriptomic profiles in mouse BMECs after cerebral ischemia were reported58. In addition, in a stroke model, the regulation of lncRNAs in the BBB was studied40. However, to the best of our knowledge, the host lncRNA transcriptomic profiles upon meningitic bacterial penetration of the BBB have not been reported. This is the first attempt via high-throughput RNA sequencing technology to characterize the differentially induced lncRNAs in primary hBMECs in response to meningitic E. coli challenge. Proinflammatory cytokines and chemokines have been shown to be the potential stimuli that mediate the transcription of lncRNAs in primary hBMECs. Moreover, we compared the transcription of these differentially expressed lncRNAs in human primary hBMECs, U251 cells and HUVECs in vitro, and found that some of the lncRNAs exhibited different expression profiles among these cell lines. Taking these findings together, the discovery of host lncRNAs, as well as novel lncRNA transcripts, provides new insights into the process of bacterial meningitis infection, and suggests potential new targets to improve the prevention of this disease in the future.
Methods
Bacterial strain and cell culture
The meningitic E. coli strain used in this study, PCN033, was isolated from swine cerebrospinal fluid in Hunan Province, China, in 200659. The strain was routinely grown aerobically at 37 °C in Luria–Bertani medium overnight.
Primary hBMECs which we used in this study were kept within ten passages were kindly provided by Prof. Kwang Sik Kim from Johns Hopkins University School of Medicine and routinely cultured in RPMI1640 supplemented with 10% heat-inactivated foetal bovine serum (FBS), 10% Nu-Serum, 2 mM L-glutamine, 1 mM sodium pyruvate, nonessential amino acids, vitamins, and penicillin and streptomycin (100 U/mL)60. The human astrocyte cell line U251 was cultured in Dulbecco’s modified Eagle’s medium supplemented with 10% heat-inactivated FBS, and HUVECs were maintained in EGM-2 medium (Lonza, Walkersville, MD, USA) with 10% heat-inactivated FBS. All of the cells were incubated in a 37 °C incubator under 5% CO2 until monolayer confluence. Confluent cells were washed three times with Hanks’ balanced salt solution (Corning Cellgro, Manassas, VA, USA) and starved in serum-free medium (1:1 mixture of Ham’s F-12 and M-199) for 16–18 h before further treatment.
In vitro infection and cytokines stimulation assays
Meningitic E. coli strain infection of primary hBMECs, as well as U251 cells and HUVECs, was performed in accordance with previously described methods61,62. Briefly, E. coli overnight culture was resuspended and diluted in serum-free medium and added to the starved confluent primary hBMEC monolayer grown in 10-cm dishes at a multiplicity of infection of 10 (approximately 108 colony-forming units per dish) to allow invasion at 37 °C for 3 h. For cytokine stimulation, recombinant human IL-8, MIP-2, GRO-α, IL-1β, IL-6 and TNF-α were purchased from Novoprotein Scientific (Shanghai, China) and used at a final concentration of 10 ng/mL to stimulate the primary hBMECs for 24 h. Finally, cells were washed three times with chilled PBS and subjected to RNA extraction by using TRIzol reagent (Invitrogen, Carlsbad, CA, USA), in accordance with the manufacturer’s instructions.
RNA sequencing and bioinformatic analysis
LncRNA library preparation
For library construction, ribosomal RNA was removed using the Ribo-zero rRNA Removal Kit to obtain approximately 2 μg of total RNA. The library was constructed with the NEB Next® Ultra™ Directional RNA Library Prep Kit for Illumina® (NEB, Ipswich, MA, USA), following the manufacturer’s recommendations. Briefly, fragmentation was carried out using divalent cations at an elevated temperature in NEBNext First-Strand Synthesis Reaction Buffer (5×). First-Strand cDNA was synthesised using random hexamer primer and M-MuLV reverse transcriptase. Second-strand cDNA synthesis was subsequently performed using DNA Polymerase I and RNase H. In the reaction buffer, dNTPs with dTTP were replaced by dUTP. Remaining overhangs were converted into blunt ends via the activities of exonuclease/polymerase, followed by adenylation of the 3′ ends of DNA fragments. Finally, NEB Next Adaptor with a hairpin loop structure was ligated to prepare for hybridisation. Fragments of approximately 200 base pairs (bp) were selected and extracted using the AMPure XP system (Beckman Coulter, Beverly, MA, USA). Library quality was assessed on an Agilent Bioanalyzer 2100 system. The libraries were sequenced at the Total Genomics Solution Institute (Shenzhen, China) on an Illumina Hiseq 2500 platform and 125-bp paired-end reads were generated.
Raw reads quality control
Raw reads in fastq format were subjected to a process for removing adaptor and low-quality reads based on the following criteria: (1) reads that aligned to adaptors or primers with no more than two mismatches; (2) reads with >10% unknown bases (N bases); and (3) reads with >50% low-quality bases (quality value ≤10) in one read. Finally, the filtered reads were used for further analysis.
Novel LncRNAs prediction
High-quality reads were first aligned to the human genome (UCSC, hg19) with Hisat (v0.1.6) and then reconstructed to transcripts with StringTie (v1.0.4). To achieve “union” of the transcripts, cuffcompare (v2.1.1) was used to remove the replicated transcripts in different samples or conditions. Subsequently, several filtering steps were applied to isolate the most robust transcripts, in accordance with the method proposed by Prensner63. First, transcripts with a total length of less than 200 nt were discarded. Second, transcripts for which the peak expression across all samples was less than 2.0 and those present in only one sample considered as a ‘background’ transcript were discarded. Third, transcripts overlapping with known mRNAs and lncRNAs on the same strand were removed. Finally, the remaining transcripts without protein-coding potential predicted by lncRNA prediction software (CPC v0.9-r2, CNCI v2.1 and PFAM) were classified as novel lncRNAs.
Analysis of the differential expression of lncRNAs and mRNAs
HTSeq v0.6.1 was used to count the number of reads mapped to each gene for quantification of the gene expression level and normalised using the FPKM (fragment per kilobase per million fragments) method. The R package DESeq2 (v1.4.5) was used to determine the differential expression. The resulting p-values were adjusted using Benjamini and Hochberg’s approach for controlling the false discovery rate64, and genes or lncRNAs with an adjusted p-value of < 0.05 and an increase in their expression of ≥2-fold or a decrease to ≤0.5-fold were considered differentially expressed.
Analysis of cis and trans target gene
For cis role of lncRNA, the gene flanked within 100 kb of lncRNA was chosen. And then the pearson correlation coefficient was calculated between gene and lncRNA using the expression level (FPKM). Finally, the gene-lncRNA pairs with absolute value of the correlation coefficient more than 0.6 were considered as candidate lncRNAs that regulated corresponding cis target genes. For trans role of lncRNA, the pearson correlation coefficient was calculated between gene and lncRNA using the expression level (FPKM). The gene-lncRNA pairs with absolute value of the correlation coefficient more than 0.6 were chosen. And then filtered with sequence homology (blastn, E-value < 1.0E-10 and identity >99 and matched length ≥20 bp) between gene-lncRNA pair.
Competing endogenous RNA analysis
Based on the competing endogenous RNA hypothesis (“ceRNA hypothesis”), lncRNAs can function as mircoRNA “sponge” to interact directly with mircoRNAs and prevent them from binding to mRNAs. The miRNAs binding sites in lncRNAs were predicted with miRanda65. And the miRNAs binding sites of mRNAs were download from miRTarBase database which collectes the experimentally validated microRNA-target interactions.
GO and KEGG enrichment analysis
The R package goseq (v1.16.2) was used to perform the GO enrichment analysis, and GO terms with a corrected p-value of above 0.05 were excluded. For KEGG analysis, the genes were mapped directly to the KEGG database. Then, the enriched pathways were obtained using a q-value cutoff of 0.05 with the R hypergeometric function and R q-value package.
Conservation analysis
PhastCons scores of human (hg19), mouse (mm10), rat (rn5) and fruit fly (dm6) were downloaded from the UCSC database. To assign a conservation score to a transcript, the mean PhastCons score for the exons and introns of each transcript model was calculated. The conservation score was compared among the protein-coding sequence, lncRNA and corresponding introns66.
RNA isolation and quantitative real-time PCR analysis
Total RNA was extracted from primary hBMECs, U251 cells and HUVECs using TRIzol reagent (Invitrogen, Carlsbad, CA, USA). Contaminating genomic DNA was removed by DNase I treatment (NEB, Ipswich, MA, USA). Aliquots (1 μg) of the total RNA in each sample were subjected to cDNA synthesis using PrimeScript™ RT Reagent Kit with gDNA Eraser (Takara Bio Inc., Tokyo, Japan). Real-time PCR was performed with a ViiA™ 7 Real-Time PCR System (Applied BioSystems, Foster City, CA, USA) using Power SYBR Green PCR Master Mix (Applied BioSystems), in accordance with the manufacturer’s instructions. Primers for the quantitative real-time PCR are listed in Supplemental Table 12. The amplification conditions were as follows: 50 °C for 2 min and 95 °C for 10 min, followed by 40 cycles of 95 °C for 15 s and 60 °C for 1 min. The products were then applied to a melt curve stage with denaturation at 95 °C for 15 s, annealing at 60 °C for 1 min and slow dissociation by ramping from 60 °C to 95 °C at 0.05 °C/s to ensure the specificity of the PCR products. The expression levels of the target genes were normalised to the expression of GAPDH. Each assay was performed independently in triplicate.
Statistical analysis
Data are expressed as mean ± standard error of the mean (SEM), and the significance of differences between groups was evaluated by two-way analysis of variance. P-values < 0.05 were considered significant. Graphs were plotted and analyzed using GraphPad Prism version 6.0 (GraphPad Software, La Jolla, CA, USA).
Additional Information
Accession Codes: The transcriptomic data in this study have been submitted and deposited to the BioProject database of National Center for Biotechnology Information (Accession number SRP091345).
How to cite this article: Yang, R. et al. Differential transcription profiles of long non-coding RNAs in primary human brain microvascular endothelial cells in response to meningitic Escherichia coli. Sci. Rep. 6, 38903; doi: 10.1038/srep38903 (2016).
Publisher's note: Springer Nature remains neutral with regard to jurisdictional claims in published maps and institutional affiliations.
Supplementary Material
Acknowledgments
This work was supported by the National Program on Key Research Project of China (2016YFD0500406), the National Natural Science Foundation of China (NSFC) (No. 31502062) and the Fundamental Research Funds for the Central Universities (Program No. 2662014BQ022).
Footnotes
Author Contributions R.Y. prepared the samples, performed experiments, drafted and revised the manuscript. R.Y. and F.H. analyzed and verified the data. J.F., B.D., B.X., L.M., W.L. and X.Y. participated in experiments and helped to analyze the data. C.T. and H.C. provided the technical and administrative support. X.W. conceived the experiments, managed the study coordination and revise the manuscript. All authors reviewed and approved the final manuscript.
References
- Kim K. S. Mechanisms of microbial traversal of the blood–brain barrier. Nat Rev Microbiol 6, 625–634, doi: 10.1038/nrmicro1952 (2008). [DOI] [PMC free article] [PubMed] [Google Scholar]
- Burkhart A. et al. Transfection of brain capillary endothelial cells in primary culture with defined blood-brain barrier properties. Fluids Barriers CNS 12, 19, doi: 10.1186/s12987-015-0015-9 (2015). [DOI] [PMC free article] [PubMed] [Google Scholar]
- Abbott N. J., Patabendige A. A., Dolman D. E., Yusof S. R. & Begley D. J. Structure and function of the blood-brain barrier. Neurobiol Dis 37, 13–25, doi: 10.1016/j.nbd.2009.07.030 (2010). [DOI] [PubMed] [Google Scholar]
- Palmer A. M. The role of the blood-CNS barrier in CNS disorders and their treatment. Neurobiol Dis 37, 3–12, doi: 10.1016/j.nbd.2009.07.029 (2010). [DOI] [PubMed] [Google Scholar]
- Eigenmann D. E. et al. Comparative study of four immortalized human brain capillary endothelial cell lines, hCMEC/D3, hBMEC, TY10, and BB19, and optimization of culture conditions, for an in vitro blood-brain barrier model for drug permeability studies. Fluids Barriers CNS 10, 33, doi: 10.1186/2045-8118-10-33 (2013). [DOI] [PMC free article] [PubMed] [Google Scholar]
- Ring A., Weiser J. N. & Tuomanen E. I. Pneumococcal trafficking across the blood-brain barrier. Molecular analysis of a novel bidirectional pathway. The J Clin Invest 102, 347–360, doi: 10.1172/JCI2406 (1998). [DOI] [PMC free article] [PubMed] [Google Scholar]
- Schubert-Unkmeir A. et al. Neisseria meningitidis induces brain microvascular endothelial cell detachment from the matrix and cleavage of occludin: a role for MMP-8. PLoS Pathog 6, e1000874, doi: 10.1371/journal.ppat.1000874 (2010). [DOI] [PMC free article] [PubMed] [Google Scholar]
- Goluszko P., Popov V., Wen J., Jones A. & Yallampalli C. Group B streptococcus exploits lipid rafts and phosphoinositide 3-kinase/Akt signaling pathway to invade human endometrial cells. Am J Obstet Gynecol 199, 548 e541-549, doi: 10.1016/j.ajog.2008.03.051 (2008). [DOI] [PubMed] [Google Scholar]
- Sukumaran S. K. & Prasadarao N. V. Escherichia coli K1 invasion increases human brain microvascular endothelial cell monolayer permeability by disassembling vascular-endothelial cadherins at tight junctions. J Infect Dis 188, 1295–1309, doi: 10.1086/379042 (2003). [DOI] [PubMed] [Google Scholar]
- Patrick D. et al. Haemophilus influenzae lipopolysaccharide disrupts confluent monolayers of bovine brain endothelial cells via a serum-dependent cytotoxic pathway. J Infect Dis 165, 865–872 (1992). [DOI] [PubMed] [Google Scholar]
- Shin S. H. & Kim K. S. Treatment of bacterial meningitis: an update. Expert Opin Pharmaco 13, 2189–2206, doi: 10.1517/14656566.2012.724399 (2012). [DOI] [PubMed] [Google Scholar]
- Kim B. J. et al. Bacterial induction of Snail1 contributes to blood-brain barrier disruption. J Clin Invest 125, 2473–2483, doi: 10.1172/JCI74159 (2015). [DOI] [PMC free article] [PubMed] [Google Scholar]
- McMillin M. A. et al. TGFbeta1 exacerbates blood-brain barrier permeability in a mouse model of hepatic encephalopathy via upregulation of MMP9 and downregulation of claudin-5. Lab Invest 95, 903–913, doi: 10.1038/labinvest.2015.70 (2015). [DOI] [PMC free article] [PubMed] [Google Scholar]
- Miao Z. et al. VEGF increases paracellular permeability in brain endothelial cells via upregulation of EphA2. Anat Rec 297, 964–972, doi: 10.1002/ar.22878 (2014). [DOI] [PubMed] [Google Scholar]
- Rochfort K. D., Collins L. E., McLoughlin A. & Cummins P. M. Tumour necrosis factor-alpha-mediated disruption of cerebrovascular endothelial barrier integrity in vitro involves the production of proinflammatory interleukin-6. J Neurochem 136, 564–572, doi: 10.1111/jnc.13408 (2016). [DOI] [PubMed] [Google Scholar]
- Kim K. S. Pathogenesis of bacterial meningitis: from bacteraemia to neuronal injury. Nat Rev Neurosci 4, 376–385, doi: 10.1038/nrn1103 (2003). [DOI] [PubMed] [Google Scholar]
- Cichon C., Sabharwal H., Ruter C. & Schmidt M. A. MicroRNAs regulate tight junction proteins and modulate epithelial/endothelial barrier functions. Tissue Barriers 2, e944446, doi: 10.4161/21688362.2014.944446 (2014). [DOI] [PMC free article] [PubMed] [Google Scholar]
- Matera A. G., Terns R. M. & Terns M. P. Non-coding RNAs: lessons from the small nuclear and small nucleolar RNAs. Nat Rev Mol Cell Biol 8, 209–220, doi: 10.1038/nrm2124 (2007). [DOI] [PubMed] [Google Scholar]
- Bompfunewerer A. F. et al. Evolutionary patterns of non-coding RNAs. Theory Biosci 123, 301–369, doi: 10.1016/j.thbio.2005.01.002 (2005). [DOI] [PubMed] [Google Scholar]
- Chen J. & Xue Y. Emerging roles of non-coding RNAs in epigenetic regulation. Sci China Life Sci 59, 227–235, doi: 10.1007/s11427-016-5010-0 (2016). [DOI] [PubMed] [Google Scholar]
- Niu H. et al. Long non-coding RNA AK027294 involves in the process of proliferation, migration, and apoptosis of colorectal cancer cells. Tumour Biol, doi: 10.1007/s13277-015-4350-x (2016). [DOI] [PMC free article] [PubMed] [Google Scholar]
- De Lucia F. & Dean C. Long non-coding RNAs and chromatin regulation. Curr Opin Plant Biol 14, 168–173, doi: 10.1016/j.pbi.2010.11.006 (2011). [DOI] [PubMed] [Google Scholar]
- Chen L. L. & Carmichael G. G. Decoding the function of nuclear long non-coding RNAs. Curr Opin Cell Biol 22, 357–364, doi: 10.1016/j.ceb.2010.03.003 (2010). [DOI] [PMC free article] [PubMed] [Google Scholar]
- Zhang E. et al. E2F1-induced upregulation of long noncoding RNA LINC00668 predicts a poor prognosis of gastric cancer and promotes cell proliferation through epigenetically silencing of CKIs. Oncotarget, doi: 10.18632/oncotarget.6745 (2015). [DOI] [PMC free article] [PubMed] [Google Scholar]
- Fatica A. & Bozzoni I. Long non-coding RNAs: new players in cell differentiation and development. Nat Rev Genet 15, 7–21, doi: 10.1038/nrg3606 (2014). [DOI] [PubMed] [Google Scholar]
- Qureshi I. A. & Mehler M. F. Long non-coding RNAs: novel targets for nervous system disease diagnosis and therapy. Neurotherapeutics 10, 632–646, doi: 10.1007/s13311-013-0199-0 (2013). [DOI] [PMC free article] [PubMed] [Google Scholar]
- Kalani A. et al. Role of microRNA29b in blood-brain barrier dysfunction during hyperhomocysteinemia: an epigenetic mechanism. J Cereb Blood Flow Metab 34, 1212–1222, doi: 10.1038/jcbfm.2014.74 (2014). [DOI] [PMC free article] [PubMed] [Google Scholar]
- Yang R. et al. Induction of VEGFA and Snail-1 by meningitic Escherichia coli mediates disruption of the blood-brain barrier. Oncotarget, doi: 10.18632/oncotarget.11696 (2016). [DOI] [PMC free article] [PubMed] [Google Scholar]
- Moran V. A., Perera R. J. & Khalil A. M. Emerging functional and mechanistic paradigms of mammalian long non-coding RNAs. Nucleic Acids Res 40, 6391–6400, doi: 10.1093/nar/gks296 (2012). [DOI] [PMC free article] [PubMed] [Google Scholar]
- Luo S. et al. Divergent lncRNAs Regulate Gene Expression and Lineage Differentiation in Pluripotent Cells. Cell Stem Cell 18, 637–652, doi: 10.1016/j.stem.2016.01.024 (2016). [DOI] [PubMed] [Google Scholar]
- Galupa R. & Heard E. X-chromosome inactivation: new insights into cis and trans regulation. Curr Opin Genet Dev 31, 57–66, doi: 10.1016/j.gde.2015.04.002 (2015). [DOI] [PubMed] [Google Scholar]
- Rapicavoli N. A. et al. A mammalian pseudogene lncRNA at the interface of inflammation and anti-inflammatory therapeutics. Elife 2, e00762, doi: 10.7554/eLife.00762 (2013). [DOI] [PMC free article] [PubMed] [Google Scholar]
- Sanuki R. et al. miR-124a is required for hippocampal axogenesis and retinal cone survival through Lhx2 suppression. Nat Neurosci 14, 1125–1134, doi: 10.1038/nn.2897 (2011). [DOI] [PubMed] [Google Scholar]
- Cesana M. et al. A long noncoding RNA controls muscle differentiation by functioning as a competing endogenous RNA. Cell 147, 358–369, doi: 10.1016/j.cell.2011.09.028 (2011). [DOI] [PMC free article] [PubMed] [Google Scholar]
- Huang Z. et al. Identification of Differentially Expressed Long Non-coding RNAs in Polarized Macrophages. Sci Rep 6, 19705, doi: 10.1038/srep19705 (2016). [DOI] [PMC free article] [PubMed] [Google Scholar]
- Caballero-Garrido E. et al. In Vivo Inhibition of miR-155 Promotes Recovery after Experimental Mouse Stroke. J Neurosci 35, 12446–12464, doi: 10.1523/JNEUROSCI.1641-15.2015 (2015). [DOI] [PMC free article] [PubMed] [Google Scholar]
- Miao Y. S. et al. MiR-18a increased the permeability of BTB via RUNX1 mediated down-regulation of ZO-1, occludin and claudin-5. Cell Signal 27, 156–167, doi: 10.1016/j.cellsig.2014.10.008 (2015). [DOI] [PubMed] [Google Scholar]
- Zhao L., Wang P., Liu Y., Ma J. & Xue Y. miR-34c regulates the permeability of blood-tumor barrier via MAZ-mediated expression changes of ZO-1, occludin, and claudin-5. J Cell Physiol 230, 716–731, doi: 10.1002/jcp.24799 (2015). [DOI] [PubMed] [Google Scholar]
- Calogero R. A. et al. Identification and Characterization of Long Non-Coding RNAs Related to Mouse Embryonic Brain Development from Available Transcriptomic Data. PLoS One 8, e71152, doi: 10.1371/journal.pone.0071152 (2013). [DOI] [PMC free article] [PubMed] [Google Scholar]
- Yin K. J., Hamblin M. & Chen Y. E. Non-coding RNAs in cerebral endothelial pathophysiology: emerging roles in stroke. Neurochem Int 77, 9–16, doi: 10.1016/j.neuint.2014.03.013 (2014). [DOI] [PMC free article] [PubMed] [Google Scholar]
- Argaw A. T., Gurfein B. T., Zhang Y., Zameer A. & John G. R. VEGF-mediated disruption of endothelial CLN-5 promotes blood-brain barrier breakdown. Proc Natl Acad Sci USA 106, 1977–1982, doi: 10.1073/pnas.0808698106 (2009). [DOI] [PMC free article] [PubMed] [Google Scholar]
- Bezdekova M. et al. Analysis of Snail-1, E-cadherin and claudin-1 expression in colorectal adenomas and carcinomas. Int J Mol Sci 13, 1632–1643, doi: 10.3390/ijms13021632 (2012). [DOI] [PMC free article] [PubMed] [Google Scholar]
- Xiao L. et al. Long noncoding RNA SPRY4-IT1 regulates intestinal epithelial barrier function by modulating the expression levels of tight junction proteins. Mol Biol Cell 27, 617–626, doi: 10.1091/mbc.E15-10-0703 (2016). [DOI] [PMC free article] [PubMed] [Google Scholar]
- Li K. et al. A noncoding antisense RNA in tie-1 locus regulates tie-1 function in vivo. Blood 115, 133–139, doi: 10.1182/blood-2009-09-242180 (2010). [DOI] [PMC free article] [PubMed] [Google Scholar]
- Abadier M. et al. Cell surface levels of endothelial ICAM-1 influence the transcellular or paracellular T-cell diapedesis across the blood-brain barrier. Eur J Immunol 45, 1043–1058, doi: 10.1002/eji.201445125 (2015). [DOI] [PubMed] [Google Scholar]
- Guo W. et al. ICAM-1-Related Noncoding RNA in Cancer Stem Cells Maintains ICAM-1 Expression in Hepatocellular Carcinoma. Clin Cancer Res, doi: 10.1158/1078-0432.CCR-14-3106 (2015). [DOI] [PubMed] [Google Scholar]
- Peterson C. B. et al. Characterization of Expression Quantitative Trait Loci in Pedigrees from Colombia and Costa Rica Ascertained for Bipolar Disorder. PLoS Genet 12, e1006046, doi: 10.1371/journal.pgen.1006046 (2016). [DOI] [PMC free article] [PubMed] [Google Scholar]
- Cai H. et al. The long noncoding RNA TUG1 regulates blood-tumor barrier permeability by targeting miR-144. Oncotarget 6, 19759–19779 (2015). [DOI] [PMC free article] [PubMed] [Google Scholar]
- Jiang C. et al. TNF-alpha induces vascular endothelial cells apoptosis through overexpressing pregnancy induced noncoding RNA in Kawasaki disease model. Int J Biochem Cell Biol 72, 118–124, doi: 10.1016/j.biocel.2016.01.011 (2016). [DOI] [PubMed] [Google Scholar]
- Zhang E. et al. Pituitary tumor-transforming gene 1 (PTTG1) is overexpressed in oral squamous cell carcinoma (OSCC) and promotes migration, invasion and epithelial-mesenchymal transition (EMT) in SCC15 cells. Tumour Biol 35, 8801–8811, doi: 10.1007/s13277-014-2143-2 (2014). [DOI] [PubMed] [Google Scholar]
- Yamato A. et al. Oncogenic activity of BIRC2 and BIRC3 mutants independent of nuclear factor-kappaB-activating potential. Cancer Sci 106, 1137–1142, doi: 10.1111/cas.12726 (2015). [DOI] [PMC free article] [PubMed] [Google Scholar]
- Tsoi L. C. et al. Analysis of long non-coding RNAs highlights tissue-specific expression patterns and epigenetic profiles in normal and psoriatic skin. Genome Biol 16, 24, doi: 10.1186/s13059-014-0570-4 (2015). [DOI] [PMC free article] [PubMed] [Google Scholar]
- Paralkar V. R. et al. Lineage and species-specific long noncoding RNAs during erythro-megakaryocytic development. Blood 123, 1927–1937, doi: 10.1182/blood-2013-12-544494 (2014). [DOI] [PMC free article] [PubMed] [Google Scholar]
- Doll D. et al. Differential expression of the chemokines GRO-2, GRO-3, and interleukin-8 in colon cancer and their impact on metastatic disease and survival. Int J Colorectal Dis 25, 573–581, doi: 10.1007/s00384-010-0901-1 (2010). [DOI] [PubMed] [Google Scholar]
- Hallstrom K. N. & McCormick B. A. The type three secreted effector SipC regulates the trafficking of PERP during Salmonella infection. Gut Microbes 7, 136–145, doi: 10.1080/19490976.2015.1128626 (2016). [DOI] [PMC free article] [PubMed] [Google Scholar]
- Li X. et al. MEK1/2 inhibitors induce interleukin-5 expression in mouse macrophages and lymphocytes. Biochem Biophys Res Commun 473, 939–946, doi: 10.1016/j.bbrc.2016.03.156 (2016). [DOI] [PubMed] [Google Scholar]
- Bhuin T. & Roy J. K. Rab11 in disease progression. Int J Mol Cell Med 4, 1–8 (2015). [PMC free article] [PubMed] [Google Scholar]
- Zhang J. et al. Altered long non-coding RNA transcriptomic profiles in brain microvascular endothelium after cerebral ischemia. Exp Neurol 277, 162–170, doi: 10.1016/j.expneurol.2015.12.014 (2016). [DOI] [PMC free article] [PubMed] [Google Scholar]
- Liu C. et al. Genome analysis and in vivo virulence of porcine extraintestinal pathogenic Escherichia coli strain PCN033. BMC Genomics 16, 717, doi: 10.1186/s12864-015-1890-9 (2015). [DOI] [PMC free article] [PubMed] [Google Scholar]
- Zhu L., Pearce D. & Kim K. S. Prevention of Escherichia coli K1 penetration of the blood-brain barrier by counteracting the host cell receptor and signaling molecule involved in E. coli invasion of human brain microvascular endothelial cells. Infect Immun 78, 3554–3559, doi: 10.1128/IAI.00336-10 (2010). [DOI] [PMC free article] [PubMed] [Google Scholar]
- Zumbansen M. et al. First siRNA library screening in hard-to-transfect HUVEC cells. J RNAi Gene Silencing 6, 354–360 (2010). [PMC free article] [PubMed] [Google Scholar]
- Zhao Y., Pang D., Wang C., Zhong S. & Wang S. MicroRNA-134 modulates glioma cell U251 proliferation and invasion by targeting KRAS and suppressing the ERK pathway. Tumour Biol, doi: 10.1007/s13277-016-5027-9 (2016). [DOI] [PubMed] [Google Scholar]
- Prensner J. R. et al. Transcriptome sequencing across a prostate cancer cohort identifies PCAT-1, an unannotated lincRNA implicated in disease progression. Nat Biotechnol 29, 742–749, doi: 10.1038/nbt.1914 (2011). [DOI] [PMC free article] [PubMed] [Google Scholar]
- Benjamini Y. et al. Controlling the false discovery rate: a practical and powerful approach to multiple testing. J R Stat Soc B 57, 289–300 (1995). [Google Scholar]
- Zhang Y. C. et al. Genome-wide screening and functional analysis identify a large number of long noncoding RNAs involved in the sexual reproduction of rice. Genome Biol 15, 512, doi: 10.1186/s13059-014-0512-1 (2014). [DOI] [PMC free article] [PubMed] [Google Scholar]
- Li T. T. et al. Identification of long non-protein coding RNAs in chicken skeletal muscle using next generation sequencing. Genomics 99, 292–298, doi: 10.1016/j.ygeno.2012.02.003 (2012). [DOI] [PubMed] [Google Scholar]
Associated Data
This section collects any data citations, data availability statements, or supplementary materials included in this article.