Abstract
We propose a novel non-invasive brain tumor type classification using Multi-fractal Detrended Fluctuation Analysis (MFDFA) [1] in structural magnetic resonance (MR) images. This preliminary work investigates the efficacy of the MFDFA features along with our novel texture feature known as multi-fractional Brownian motion (mBm) [2]in classifying (grading) brain tumors as High Grade (HG) and Low Grade (LG). Based on prior performance, Random Forest (RF) [3] is employed for tumor grading using two different datasets such as BRATS-2013 [4] and BRATS-2014 [5]. Quantitative scores such as precision, recall, accuracy are obtained using the confusion matrix. On an average 90% precision and 85% recall from the inter-dataset cross-validation confirm the efficacy of the proposed method.
Keywords: classification, brain tumor, MFDFA, mBm, random forest, MR, texture, tumor grade
1. Introduction
Grading tumor is important clinical decision regarding dose determination, medication or even surgery. Usually the grading is an invasive process that relies almost entirely on visual assessment of the tumor specimen under a microscope. However, the usual tumor grading procedure raises the concern of subjectivity and inter-observer variability; and clearly demands an efficient non-invasive method. In literature several non-invasive computer aided techniques are proposed. Among the recent works, Weber et al. [6] capture the inherent heterogeneity properties of brain neoplasms from spectroscopy and perfusion MR images. In [7], Wang et al. classify malignant and benign brain neoplasm using the spectroscopy and conventional MR images. Zacharaki et al. [8]extract shape and Gabor-like texton [9] features from perfusion and conventional MRIs for tumor grading. However, none of the above methods employ only structural MRI that is the most routinely available imaging modalities. Devising a texture based non-invasive structural MRI method for tumor grading is useful.
In this work, we use MFDFA [1] and mBm [2] features that capture the multi-resolution texture patterns of tumors from the commonly available structural MRIs. Methods proposed in Gu et al. [1] and Kantelhardt et al. [10] show the effectiveness of MFDFA in classifying breast tumor in mammogram images. In our previous work [11], we have shown preliminary results that MFDFA in structural MRI can be useful for tumor grading for the first time in literature. In this work, we use two different types of features; MFDFA and mBm from two different structural MRI modalities such as T1, and T1c. Experimental results shows that further improved results can be obtained with the proposed method.
2. Method
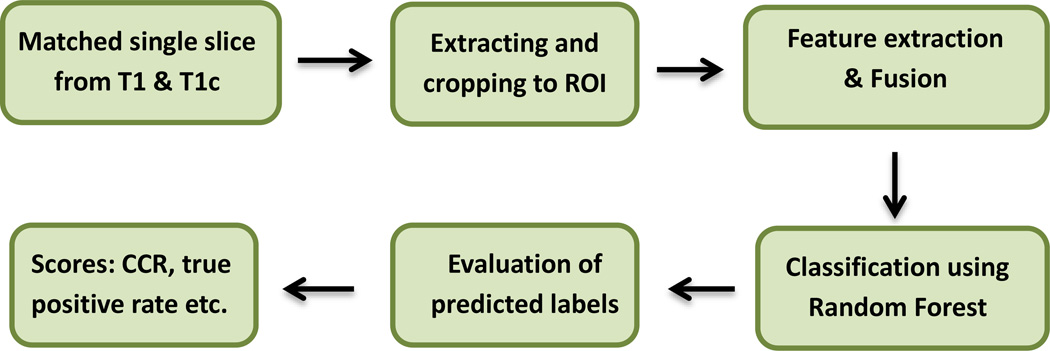
The overall flow diagram of the proposed method is shown in Figure 1. The method uses a single matched slice from T1 and T1c volumes as input. In this work, we use MRI image from 221 patients involving two BRATS challenge [4] [5] datasets: i) 30 (20 High Grade (HG), 10 Low Grade (LG)) training images from BRATS-2013, and ii) 191 (175 HG, and 16 LG) training images from BRATS-2014. Brief descriptions for each steps in the above flow diagram is given below.
Figure 1.
Overall flow diagram of the proposed method
2.1 Input image
A single 2D slice image per modality (T1 and T1c) is selected manually, which shows the maximum size of the tumor regions. We observed that T1 and T1c modality contain the most discriminating information than the other modalities.
2.2 ROI extraction
Using the ground truth or an efficient segmentation method, only the tumor region is obtained and cropped. In general an effective tumor segmentation technique such as [2] [12] would extract the tumor segments. This cropped image is defined as ROI which goes under the next steps.
2.3 Feature extraction and Fusion
From the ROI image, five different features of two different types of features such as MFDFA and mBm are extracted. After extraction, features are fused such that the feature matrix contains all the corresponding feature values. Derivation of the texture feature from the mBm process can be found in [2]. The extraction of four useful features from MFDFA is given below.
2.3.1 Extracting features from MFDFA
The multi-fractal analysis obtains the self-similar features in an object at multiple resolution labels. The process of defining and measuring multifractal properties is only partially established and continues as an active research area. The MFDFA method measures the fluctuation of a signal and estimates the Hurst index at different resolution labels. The steps that are followed to extract the features can also be found in the preliminary work [11]. Here is a brief description of MFDFA;
Set the sub-image size: We use a sliding window of size s by s where, s varies from a minimum 6 to 1/4 × min (row, column)
- For each of the sub-image (Xv,w)
- Find cumulative sum, Uv,w(i,j) and the fitted surface of the cumulative sum, Ũv,m(i,j). where v, w are sub-image index and 1 ≤ (i,j) ≤ s.
- Calculate Detrended fluctuation (DFA) using the following Equation (1)
where, F(v,w,s) is the Detrended fluctuation of the sub-image.(1)
- The qthorder fluctuation of each sub-image is given by Equation (2) is determined for values of q = (−6, −4, −2,2,4,6). The sum of all fluctuations is averaged over total number of sub-images. Equation (3) is used for q =0 [1].
(2)
where, T is the total number of sub-images.(3)
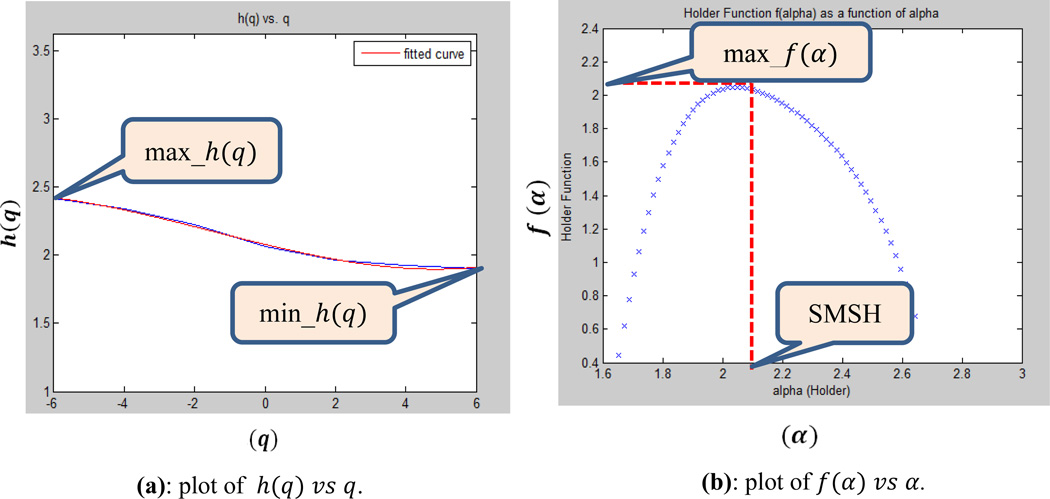
From the above MFDF analysis, four useful features are extracted and shown in Figure-2.
Figure 2.
Four useful features (max_h(q), min_h(q), max_f(α), Statistically Most Significant Holder exponent (SMSH)) from MFDFA
2.4 Classification
Since our dataset is highly unbalanced, we use Random Forest (RF) for classification. RF has methods to minimize the overall error rate due to the imbalance in class population by manipulating input parameter, class weight. Two other important parameters are, Ntree and mtry. We gradually increase Ntree and mtry each at a time and observed the overall classification performance. After extensive investigation we set Ntree =10 and mtry =3 for this work.
2.5 Evaluation
This works involves binary tumor grading such as HG and LG and hence ROC analysis for classifier performance may not be representative..Therefore different quantitative scores for example true positive rate, true negative rate, precision, F-measure and accuracy are evaluated using the confusion matrix.
3. Results and Discussion
In order to show the effectiveness of the proposed method, we perform inter-dataset cross-validation. Figure 3 shows the confusion matrices obtained by classifiers trained with one dataset while testing on the other. Summary of the quantitative scores are shown in Table1.
Figure 3.
Confusion matrix; (a) Trained with BRATS-2013 dataset and test on BRATS-2014, (b) Trained with BRATS-2014 dataset and test on BRATS-2013
Table 1.
Quantitative scores from the classifiers output.
| Scores | Classifiers | ||
|---|---|---|---|
| Trained with BRATS- 2013 dataset and test on BRATS-2014 |
Trained with BRATS- 2014 dataset and test on BRATS-2013 |
Overall | |
| True Positive rate/recall | 84 | 100 | 86 |
| False positive rate | 37.5 | 40 | 38.5 |
| Accuracy | 82.2 | 86.7 | 83 |
| Precision | 96 | 83.3 | 94.3 |
| F-measure | 89.6 | 90.9 | 90 |
Results in Figure 3 and Table 1 show, using the texture features (MFDFA and mBm) on an average around 85% true positive rate and 90% precision are obtained. However, note that the classifier performance is limited by the imbalance and imaging artifacts in the MRI as shown in Figure 4 of the dataset.
Figure 4.
Example of some problematic images (imaging artifacts) in BRATS-2014 dataset. These imaging artifacts limit the classifier’s performance in grading
4. Conclusion and Future Works
This work presents a novel brain tumor grading scheme using only the structural MR images. Effective features are derived from MFDFA and combined with texture feature to capture the multi-resolution texture characteristics of brain tumors. Experimental results obtained of 221 patients from two different datasets show the promise of the proposed scheme. In this preliminary work, we manually picked a single slice that shows the maximum size and visibility of the tumor. In future we plan to extend this work from 2D slice to 3D tumor volume that may show better performance. We also plan to incorporate features from other modalities as well as other types of features such as ratio of tumor to non-tumor, ratio of tumor core to edema volume, tumor shape [8] to develop a robust grading scheme and validate our methods on large scale data.
Acknowledgments
This work is partially supported through a grant from NCI/NIH (R15CA115464). Brain tumor image data used in this work were obtained from the NCI-MICCAI 2013 & 2014 Challenge on Multimodal Brain Tumor Segmentation organized by K. Farahani, M. Reyes, B. Menze, E. Gerstner, J. Kirby and J. Kalpathy-Cramer. The challenge database contains fully anonymized images from the following institutions: ETH Zurich, University of Bern, University of Debrecen, and University of Utah and publicly available images from the Cancer Imaging Archive (TCIA).
Contributor Information
Syed M. S. Reza, Email: sreza002@odu.edu.
Randall Mays, Email: rmays003@odu.edu.
Khan M. Iftekharuddin, Email: kiftekha@odu.edu.
References
- 1.Gu GF, Zhou WX. Detrended fluctuation analysis for fractals and multifractals in higher dimensions. Physical Review E. 2006;74:061104. doi: 10.1103/PhysRevE.74.061104. [DOI] [PubMed] [Google Scholar]
- 2.Islam A, Reza S, Iftekharuddin KM. Multi-fractal texture estimation for detection and segmentation of brain tumors. IEEE Transactions on Biomedical Engineering. 2013;60(11):3204–3215. doi: 10.1109/TBME.2013.2271383. [DOI] [PMC free article] [PubMed] [Google Scholar]
- 3.Breiman L. Berkeley, CA 94720: Statistics department, University of California; 2001. Jan, Random forest. [Google Scholar]
- 4. https://vsd.unibe.ch/WebSite/BRATS/Start2013/ [Google Scholar]
- 5. https://sites.google.com/site/miccaibrats2014/ [Google Scholar]
- 6.Weber MA, Zoubaa S, Schlieter M, Juttler E, Huttner HB, Geletneky K, Lttrich C, Lichy MP, Kroll A, Debus J, Giesel FL, Hartmann M, Essig M. Diagnostic performance of spectroscopic and perfusion MRI for distinction of brain tumors. Cancer Imaging. 2006;6(Spec no. A):S32–S41. doi: 10.1212/01.wnl.0000219767.49705.9c. [DOI] [PubMed] [Google Scholar]
- 7.Wang Q, Liacouras EK, Miranda E, Kanamalla UD, Megalooikonomou V. Classification of brain tumors using MRI and MRS data. Proc. SPIE Med. Imag. 2017;6514 [Google Scholar]
- 8.Zacharaki EI, Wang S, Chawla S, Yoo DS, Wolf R, Melhem ER, Davatzikos C. Classification of brain tumor type and grade using MRI texture and shape in a machine learning scheme. Mag. Reson. Med. 2009;62(2):1609–1618. doi: 10.1002/mrm.22147. [DOI] [PMC free article] [PubMed] [Google Scholar]
- 9.Leung T, Malik J. Representing and recognizing the visual appearance of materials using three-dimensional textons. International Journal of Computer Vision. 2001;43(1):29–44. [Google Scholar]
- 10.Kantelhardt JW, Zschiegner SA, Koscielny-Bunde E, Havlin S, Bunde A, Stanley HE. Multifractal Detrended fluctuation analysis of nonstationary time series. Physica A. 2002;316:87. [Google Scholar]
- 11.Reza SMS, Mays R, Iftekharuddin KM. Multifractal Detrended fluctuation analysis shows promise for brain tumor gradng. Imaging and Applied Optics, IW4C.5. 2014 Jul [Google Scholar]
- 12.Reza S, Iftekharuddin KM. Multi-fractal texture features for brain tumor and edema segmentation. Proc. SPIE Med. Imag. Conf. 2014;9035 [Google Scholar]


