

Abstract
The wound healing assay is used in a range of disciplines to study the coordinated movement of a cell population. In this technical review, we describe the workflow of the wound healing assay as monitored by optical microscopy. Although the assay is straightforward, a lack of standardization in its application makes it difficult to compare results and reproduce experiments among researchers. We recommend general guidelines for consistency, including: (1) sample preparation including the creation of the gap, (2) microscope equipment requirements, (3) image acquisition, and (4) the use of image analysis to measure the gap size and its rate of closure over time. We also describe parameters that are specific to the particular research question, such as seeding density and matrix coatings. All of these parameters must be carefully controlled within a given set of experiments in order to achieve accurate and reproducible results.
Keywords: wound healing assay, scratch assay, physical exclusion assay, collective cell migration, sheet migration, live-cell microscopy
Abbreviations
- DIC
differential interference contrast
- ECM
extracellular matrix
- HUVEC
human umbilical vein endothelial cells
- NA
numerical aperture
I. Introduction
The wound healing assay is a standard in vitro technique for probing collective cell migration1-6 in two dimensions. In this assay, a cell-free area is created in a confluent monolayer by physical exclusion or by removing the cells from the area through mechanical, thermal or chemical damage. The exposure to the cell-free area induces the cells to migrate into the gap. A sequence of representative images from a wound healing assay carried out on a confluent endothelial monolayer is shown in Figure 1. In this example, the monolayer was scratched with a pipette tip and the migration into the gap was imaged over several hours using a transmitted-light microscope equipped for live-cell imaging. Note that the cells remain in contact during their directed and coordinated movement into the gap.
Figure 1.

Images from a scratch assay experiment at different time points. Human umbilical vein endothelial cells (HUVEC) were plated on gelatin-coated plastic dishes, wounded with a p20 pipette tip, and then imaged overnight using a microscope equipped with point visiting and live-cell apparatus. Scale bar = 120 μm.
The type of collective cell migration probed by the wound healing assay is known as sheet migration. This migration is exhibited by epithelial and endothelial monolayers that move in two dimensions while maintaining their intercellular junctions.1-5 Sheet migration occurs in diverse processes such as cancer metastasis,7, 8, 9,10 embryonic morphogenesis,11,12 and tissue injury.12,13 Sheet migration involves a complex interplay among mechanical forces, molecular interactions and biochemical cascades that are triggered by the exposure of the cellular monolayer to free space, as when cells are exposed to the gap in the wound healing assay.14-21 Although a strict definition of sheet migration requires cells to maintain intercellular junctions, there is some evidence that cells lacking intercellular junctions such as fibroblasts exhibit some characteristics of sheet migration.22
The most common information derived from the wound healing assay is the rate of gap closure, which is a measure of the speed of the collective motion of the cells. In a typical experiment, the gap closure rate is measured under different conditions, such as by treating the cells with RNA interference (RNAi),15,16 modulating the extracellular matrix composition,23-25 or by changing other environmental variables such as substrate stiffness.26 In this way, the underlying mechanisms governing sheet migration are revealed. The wound healing assay is also easily adapted for medium to high throughput applications such as small molecule screening27 and drug discovery.28
A researcher new to the wound healing assay is presented with a plethora of choices at every step of the technique. This technical review provides researchers with an introduction to this technique while emphasizing guidelines for quantitative and reproducible results. We cover the steps in setting up the wound healing assay, from sample preparation to image analysis. Although the wound healing assay is widely applied, it lacks standardization in experimental approach. In practice, a wide variety of methods are used to create the wound or gap, and then to monitor and quantify the dynamics of the migration into the cell-free area. Without standardization of experimental variables, it is difficult to make meaningful comparisons among different reports in the literature. Furthermore, to achieve a high level of accuracy and reproducibility, a well-defined procedure for the wound healing assay is crucial. For example, a gap of consistent size facilitates quantification within a series of experiments. To streamline the analysis, the gap should have relatively smooth edges and little cellular debris within the gap. Appropriate controls and experimental conditions should be recorded in parallel to improve data quality and the assay should have an objective endpoint. It is also important to consider the influence of the extracellular matrix and the substrate on the cellular migration and interactions after creating the gap in the monolayer. Developing a standard approach for the wound healing assay promotes comparability between studies and could lead to a useful database containing collective migration data for a variety of cell lines.
II. Sample Preparation: Cell Culture
Wound healing assays use cells derived from either cell lines or primary isolations from blood or tissue. Reproducible cell culture conditions29 are required for stable phenotypes that are the foundation of successful assays. For most cell lines, culturing protocols can be obtained from central resource collections such as the American Tissue Type Collection (ATCC; http://www.atcc.org), which include information such as the recommended growth medium, sub-culturing and expected doubling time. For cells derived from primary isolations, however, the protocols are often developed in individual laboratories and are more difficult to standardize. In practical terms, it is important to keep the conditions as consistent as possible.
Typically, wound healing assays are carried out with a thin layer of cells grown on a plastic or glass substrate. For many epithelial and endothelial cells, thin layers of cells are easily obtained because the cells form confluent monolayers. A good starting point is to work out the seeding density and incubation time required to produce a confluent monolayer of cells. Other important factors include the frequency and volume of media changes as well as the passage number (if applicable). The wound healing assay should be initiated at the same time point after the cells become confluent because the results obtained may vary as the monolayer matures.
The underlying substrate and the associated extracellular matrix (ECM) are also important considerations in the wound healing assay. Some cell types can grow directly on plastic or glass substrates, while others require a coating of extracellular matrix components such as gelatin, collagen, or fibronectin in order to adhere. It is important to recognize that the ECM does more than provide an adhesive surface for the cells and can also participate in signalling involved in cell migration.30 In addition, the stiffness of the underlying substrate can also modulate the dynamics of the migration into the gap.31
The dish or chamber used to culture the cells should be carefully chosen to match the experimental approach. Multi-well cell culture dishes (6, 12, or 24 wells) are a popular choice because they are inexpensive and fabricated from plastic treated to encourage cell adhesion. The wells in these dishes are also large enough to provide clearance for manipulating the monolayer as when creating a scratch wound or working with an insert. For high-resolution imaging, as discussed below, it is necessary to use dishes with thin plastic or glass bottoms on the order of 160-190 μm (Number 1.5 coverslips). Although almost all cells will grow well on plastic, some cell types will not grow on glass unless it is specially treated and coated with serum, gelatin or other extracellular components.
During the course of the wound healing assay, the cells will migrate into the gap, and they will also proliferate. In most wound healing studies, the desired result is to suppress proliferation so that it does not interfere with the measurement of migration. Drugs such as actinomycin C13 can be used to arrest mitosis at various stages, but the dosage must be carefully controlled to avoid apoptosis or other toxic effects which may affect cell migration. Serum starving32 is the most common non-pharmaceutical method for minimizing proliferation in wound healing assays, but the degree of serum starving has to be worked out for each cell type under investigation. Primary cells do not tolerate serum starving as well as established cell lines, and often require a reduced concentration of serum rather than its complete absence within the medium. A note of caution when using serum starving: a recent report suggests that serum starving induces many complex and unpredictable responses in different cell lines.33
III. Sample Preparation: Creating the Gap
A cell-free gap can be created in a cell monolayer either by direct manipulation or by physical exclusion. These approaches have been characterized as “cell depletion” or “cell exclusion” collective cell migration assays.4 Direct manipulation destroys specific regions within the monolayer through mechanical, electrical, chemical or thermal means. Physical exclusion creates cell-free areas by placing barriers within the cell culture plate such as plastic inserts, liquids or gels. The physical exclusion methods generally cause minimal damage to the remaining cells compared to the direct damage of the monolayer. Here we limit our discussion to two techniques that rely on equipment that is readily available in laboratories equipped for cell culture: the scratch (direct manipulation) and insert (physical exclusion) approaches. Interested readers are directed towards a detailed review that discusses their relative merits and applications of the more novel gap-creation methods.34 Whatever the method used, it is important to note that recent research suggests that gap geometry affects the closure rate regardless of gap surface area uniformity.35,36
To simulate wounding, the most common approach is to create a gap by scratching a confluent monolayer with a pipette tip, needle, or other sharp tool. This is known as the scratch assay and is a good choice because it is inexpensive and easy to implement. Usually, a pipette tip is used to create a scratch one well at a time. As the scratch is created manually, it can be difficult to generate reproducible wounds. It is important to angle the pipette correctly as well as to apply consistent pressure to create a consistent gap width.37 In addition, applying too much pressure may damage the extracellular matrix, which can affect migration rates.28 While the scratch method is usually performed one well at a time, some groups have scaled up the technique to multi-well plates using devices with multiple pins.27
Alternatively, the gap can be created by physically excluding the cells using inserts. Such inserts create a linear or circular gap by adhering to the treated dish bottom and preventing cell growth in a predefined region. A linear exclusion commercial insert (www.ibidi.com) is shown in Figure 2 (examples of other insert suppliers include Cell Biolabs, and Platypus Technologies). The wound-healing assay is initiated by removing the insert. The advantages of using inserts include requiring fewer cells when seeding as well as more reproducible gap sizes compared to the scratch method. While the gap size created by the insert can be more reproducible, cells clinging to the insert can be torn out of the monolayer leaving jagged edges. This means that the gap edges are not necessarily better defined compared to a scratch assay. In addition, commercial inserts are more costly than using the scratch method. Inserts can be re-used to mitigate the cost, but over time their adhesion to the bottom of the dish may be compromised.
Figure 2.
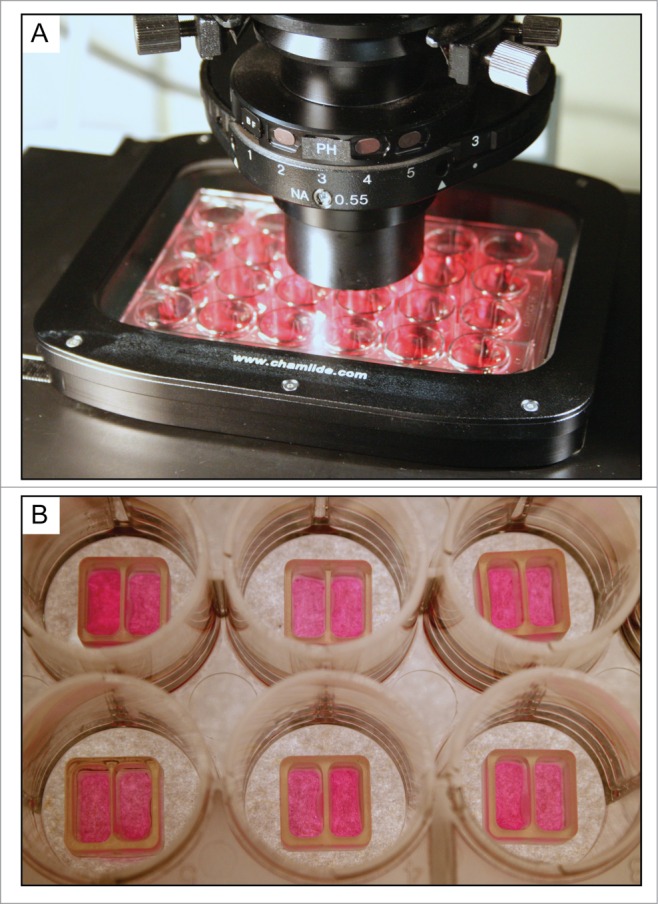
Silicone insert for gap creation via cell exclusion in a standard 24-well plate (A). Note the cells are seeded on both sides of the insert as shown in (B). Before the start of the experiment, the insert is removed and the cells are monitored as they move into the gap associated with the thin silicone strip separating the two wells.
It is a good idea to rinse twice with phosphate buffered saline or a suitable buffer before the cell culture medium is replaced and image acquisition is started. Rinsing will remove debris from damaged or dead cells, particularly after mechanical scratching. Mechanical scratching may also release more growth factors from the damaged cells compared to physical exclusion methods; replacing the growth medium with fresh medium (with or without particular growth factors as needed) after scratching helps to control the factors available to cells for migration.
IV. Microscope Configuration and Image Acquisition for the Wound Healing Assay
Fluorescence has become the most important contrast technique for optical microscopy of biological specimens. Entire cells, specific organelles within cells, or molecular species expressed in cells can be labeled with fluorescent contrast agents. These labels emit a variety of colours when they are excited with light of an appropriate wavelength, while unlabeled entities remain dark. By carefully choosing fluorophores, there is little interference between fluorophores of different colours and one can see the spatial relationship between various objects. With all of the advantages of using fluorescence for cellular imaging, it may come as a surprise that fluorescence is not always the best contrast technique for wound-healing assays. For wound healing experiments, transmitted-light techniques are usually sufficient to track the area of the gap over time.23 Long-term imaging with fluorescence leads to both photobleaching (fading of the fluorescence over time) and phototoxicity (light-induced cell death). Fluorescence labeling itself for living cells introduces potentially migration-affecting or even toxic molecules into the cells. For these reasons, transmitted-light techniques are preferred for monitoring collective cell migration unless fluorescence imaging is required for visualizing cellular processes over and beyond migration into the gap.
Most cellular monolayers are thin and almost invisible under transmitted-light (ie: brightfield) illumination; however, reasonable contrast can be achieved by adding a few special components to the light path.38,39 For example, phase contrast is available on almost all standard cell culture microscopes and often is available on more advanced imaging systems because it is straightforward to implement and compatible with plastic dishes. Differential interference contrast (DIC) is another transmitted-light technique that can provide contrast for unlabeled cells. DIC, however, requires more sophisticated optical components (prisms and polarizers) and is more expensive and more difficult to set up than phase contrast. In addition, DIC typically requires samples to be grown on glass rather than standard plastic dishes. As most wound healing assays monitor the overall gap rather than individual cellular structures, the cheaper and simpler phase contrast technique is more commonly used. Representative phase contrast images from a wound healing assay, carried out on endothelial cells, are shown in Figure 1.
Transmitted-light microscopes range in complexity from a basic cell-culture microscope shown in Figure 3A to a motorized, environmentally-controlled, automated microscope with camera as shown in Figure 3B. In the simplest approach, the researcher can score the size of the gaps by inspecting the dishes at regular time points (for example, every 2 hours) on a cell culture microscope. If the microscope is equipped with an eyepiece reticule, the researcher can go one step further and attempt to measure the gap widths directly. Visual scoring and manual measurements, while adequate for obtaining preliminary data, are tedious, imprecise and prone to user bias. For more accurate measurements, one can add a digital camera to the manual microscope and record images of the wound healing over time for subsequent analysis. However, capturing images manually quickly becomes onerous as wound healing assays can take many hours to complete, and it is difficult to keep track of the same field-of-view along each wound. For these reasons, some degree of automation is desirable for monitoring the wound healing assay.
Figure 3.

A basic cell-culture microscope (A) versus a motorized environment-controlled microscope (B).
Ideally, the microscope should be equipped with image acquisition software and a scientific-grade digital camera, environmental chamber, motorized stage for multi-position acquisition, and motorized focus with autofocus capability to minimize focal drift over time. An automated system relies on software for triggering image acquisition using a digital camera at regular time intervals as the wound recovers, for example every 15 to 30 min over a 4- to 24-hour period. The environmental chamber replicates an incubator on the microscope by controlling temperature, pH and humidity40; it allows samples to remain on the microscope rather than being repeatedly taken in and out of an incubator, thus avoiding any compromises in cell physiology arising from fluctuations in these parameters. Live-cell chambers range from integrated commercial systems, costing thousands of dollars, to inexpensive homebuilt devices that can be as effective as the commercial systems.41 Temperature control can be achieved by using an enclosure that wraps around the entire microscope, a more compact stage-top incubator, or a combination of both. Furthermore, although most cell types can be maintained in a specialized atmospheric buffer for short periods, it is advisable to carry out the wound healing in the cell culture medium. This usually requires the use of CO2 at 5% or 10%, but of course the exact concentration depends on cell type. CO2 can be delivered to the cells at the desired concentration by using a gas mixer with a 100%-CO2 cylinder, or directly from a specialty cylinder prepared with a custom gas mixture. It is important to humidify the gas before it enters the incubator to avoid evaporation. With evaporation, cell viability would be compromised by exposing the preparation to osmotic stress. A software package combined with a motorized stage and focus allows for recording images at pre-specified x, y and z stage coordinates for multiple points along each wound. Images of different conditions set up in a multi-well dish can then be acquired during the same experiment. This saves time and ensures that the various experiments are carried out under the same conditions.
Tips for optimal imaging
Here we will briefly review several parameters that are important for optimal imaging of the wound healing assay. For more detailed descriptions, the reader is directed to several excellent references that describe the elements of light microscopy.38,39
Koehler illumination
For optimal transmitted-light imaging, the microscope should be set up for Koehler illumination. This frequently-overlooked procedure is necessary to ensure even illumination across the sample and optimal contrast (note: some cell culture microscopes are preset and do not allow for these adjustments). A full Koehler alignment is described in the references.38, 42 A quick guide to setting up Koehler illumination, which assumes proper bulb alignment, is as follows: (1) Ensure the field diaphragm and condenser diaphragm (also known as irises or apertures) are fully opened. (2) Bring the sample into focus and do not touch the focus knobs again until steps 3-5 are complete. (3) Close the field diaphragm to its smallest diameter (it will not close completely). (4) Next adjust the condenser until the edges of the field diaphragm are in focus. The diaphragm image will be overlaid on the focused sample image. (5) Centre the field diaphragm using the adjustment knobs on the condenser. (6) Open the field diaphragm just to the edges of the desired field-of-view to minimize scatter and glare. In addition, the optical path should be free of dust, debris or other image clutter that may degrade the optical performance and complicate subsequent analysis.
Phase contrast
Phase contrast objectives contain a ring for creating contrast based on differences in optical path length through the sample. Phase objectives are usually denoted as PH1, PH2, etc., with the numbers denoting the size of the ring. To achieve the phase effect, choose a corresponding phase ring in the microscope's condenser, which illuminates the sample with a bright ring of light. Ensure that the bright ring from the condenser overlays the ring of the objective by using a Bertrand lens or by removing one of the eyepieces and peering into the empty ocular position – most microscopes have adjustment screws to fine-tune the alignment if necessary. The side of the well containing the cells can shift the rings so try to avoid creating wounds near the edges of the well.
Numerical aperture, contrast and resolution
The numerical aperture (NA) of the objective and condenser determines the spatial resolution when using transmitted-light techniques.38,39 The lateral spatial resolution, r, is given by r = 1.22 λ/(NAobjective + NAcondenser), where λ is the centre wavelength of the incident light.38 Objectives typically are inscribed with the NA after the magnification, such as 20x/0.75 NA. Often a range of numerical apertures is inscribed directly on the condenser as well. For maximum spatial resolution, the condenser diaphragm should be set to match the numerical aperture of the objective once the microscope has been aligned for Koehler illumination. If the condenser is not labeled with the NA, the reader is referred to detailed protocols in the references.38,42 For increased contrast, the condenser diaphragm can be closed, but this reduces the numerical aperture of the condenser, leading to a loss of spatial resolution in the image. Finally, the use of a bandpass filter (usually blue or green) can improve the contrast in both phase and DIC techniques.42 For a 10x/0.3 NA objective and a condenser with 0.3 NA, common settings used to image wound healing, the lateral spatial resolution of the microscope is about 1.1 μm if the wavelength λ illuminating the sample is about 550 nm.
Choice of objective
Choose the highest magnification objective that allows you to visualize both sides of the wound, or preferably create a wound that fits your best objective. For example, a gap of 500 μm fits in the field-of-view of a 10x objective using a standard CCD camera assuming there is no additional magnification after the objective. One can generally get a higher-quality phase-contrast image from a higher power objective (10x, as opposed to 5x or lower) while maintaining a reasonable field-of-view.
Note that it is important to choose a sample chamber that matches the working distance of the objective. The working distance is the distance from the front surface of the objective lens to where the lens focuses. In general, low NA objectives have longer working distances than high NA objectives. In practical terms, low NA (<0.5 NA) objectives must be used to image cells grown in standard multi-well dishes (6, 12, 24 wells) because these objectives can focus through the thick plastic of the wells. High NA objectives, in contrast, have shorter working distances and require sample chambers with thin plastic or glass bottoms, usually on the order of 170 μm.
Camera settings
When digital images are acquired, the camera pixels should be calibrated by recording a reference image of a stage micrometer.42 In this way, the image dimensions can be calibrated to match the actual physical dimensions of the sample. For cameras with rectangular chips, consider rotating the camera to maximize the amount of wound gap that you cover while still seeing both sides of the gap. Finally, before beginning your experiment, place a blank slide on the microscope, defocus at least a millimeter, and snap a background image for use in flat-fielding, a procedure used to correct uneven illumination (more details on flat-field correction in the next section).
V. Image Processing and Analysis of the Wound Healing Assay
1. Analysis approach and experimental endpoint
Once the digital images are recorded, the gap size can be measured as a function of time using nearly any image analysis software package (such as ImagePro Premier, Metamorph, or the open-source Fiji/ImageJ). One might consider tracking the gap width by drawing lines along the leading edges of each cell front, and then measuring the decrease in the average distances of the lines as the wound closes. However, the cells at the scratch edges often grow into the gap at different rates, leading to an ill-defined cell front as the experiment progresses. Manually tracing the leading edges is also time-consuming if a sequence of images is acquired over time. Some groups try to measure the exact time of the wound closure by direct observation. Although this method is simple, it can be difficult to pinpoint the wound-closure event because the cells often do not form a perfect monolayer in an orderly fashion; moreover, this method takes the maximum amount of observation time.
A better approach is to apply image analysis to computationally measure and plot the gap area as a function of time. From the slope of this plot a simple calculation yields the cell migration rate vmigration in μm/hr, or alternatively the time it takes for the gap to close to 50% of its original area, which we denote t1/2gap. These two values are readily measured using quantitative analysis via the simple steps outlined below, removing subjectivity from the gap closure measurement. The method is robust: even if some groups of cells along the gap close in faster than others, one can still unambiguously determine the gap area particularly during this first half of the wound healing. In addition, by plotting the gap area versus time, the cell migration rate can be readily extrapolated from the data well before the gap has fully closed in, thereby saving costly imaging time. In fact, it is generally not necessary to continue imaging beyond the point where the gap is approximately half closed. While a consistent gap size is required to compare the t1/2gap measurement, the cell migration rate vmigration is independent of the initial gap size. However, as the biological stimuli directing collective cell migration are affected by many factors including gap geometry and size, a relatively consistent gap size is anyways desirable.
Here we will describe a standard approach for analyzing the wound healing assay as imaged by transmitted-light techniques. We will illustrate the steps by using a sample data set acquired using phase contrast. The general workflow is a starting point that can be adapted and modified for use in a number of different image analysis packages. Alternatively, several analysis programs (Image-Pro Premier by Media Cybernetics,43 and TScratch44) include customized wound-healing applications to automate the rate measurements, using similar steps to the ones we describe. Furthermore, one can out-source the analysis process entirely by uploading your wound-healing datasets for processing by commercial vendors such as ibidi.45 With the automated analysis programs, the description in Step 5 below is useful for calculating the actual cell migration rate in real-world units of μm/hr.
2. Data handling: image formats and creating a time-lapse data set
Before beginning the analysis, check that the data files are in a format compatible with your image analysis program. If the image acquisition system is integrated with the image analysis software, data formats should be compatible and this step will not be necessary. If the analysis package cannot open the data sets acquired on the microscope, the data should be exported from the capture software into a standard format such as TIFF. It is important to ensure that the original data sets are saved in the custom and/or proprietary format as well, or key instrument and acquisition settings may be lost. Avoid exporting the data using image formats that degrade the image quality through compression (such as most JPEG formats). Often the image acquisition software will give the option of saving time series data within a single file, known as a multi-TIFF. Such data series are convenient for organizing data sets compared to handling the individual images for each experiment. If this option is not available, the TIFF images are typically numbered and the sequence frames can be imported into a series using the image analysis software.
3. Preprocessing: flatfield correction and edge detection
The first step in image analysis is to separate the objects of interest from the background; in a wound healing assay, the object is the gap area while the background is the area containing cells. Often, this is achieved by manipulating the image histogram, which plots the number of pixels at given intensities within one image. By choosing an intensity cut-off, the pixels can be divided into object and background pixels based on whether their intensities are higher or lower than the cut-off value, respectively. This technique is known as thresholding while the separation of the image into different populations is known as image segmentation.
Two pre-processing steps can make the image segmentation much more successful. First, it is helpful to correct the background in the image. Even if the microscope has been properly adjusted for Koehler illumination, it is common to have intensity variations of 10% or more across the camera's field-of-view. Figure 4 shows images from a typical research microscope before (A) and after correction (B). The background intensity variation is subtle in the uncorrected image, but is evident when a line profile drawn across the image is examined in Figure 4C (black, upper line). Such background intensity variations can make image segmentation difficult even after edge detection and smoothing. Fortunately, the intensity variations can be readily removed by a flat-field correction. This correction involves dividing the original image by a background image, and then scaling the resulting image back to a reasonable intensity. The most rigorous approach is to acquire a background image of a blank chamber acquired during the wound healing experiment as mentioned earlier in the tips for optimal imaging. Alternatively, software routines such as a “rolling ball” or a “flat-field” filter can be applied to the image to calculate an estimate of the background. Both methods are usually implemented simply as a “flat-field correction” menu item in 2D image analysis software. Figure 4B shows the results of flat-field correction of the image shown in (A) using a rolling ball filter. The corrected line profile shown in Figure 4C (red, lower) shows little variation in intensity across the field-of-view compared to the uncorrected line profile (black, upper).
Figure 4.
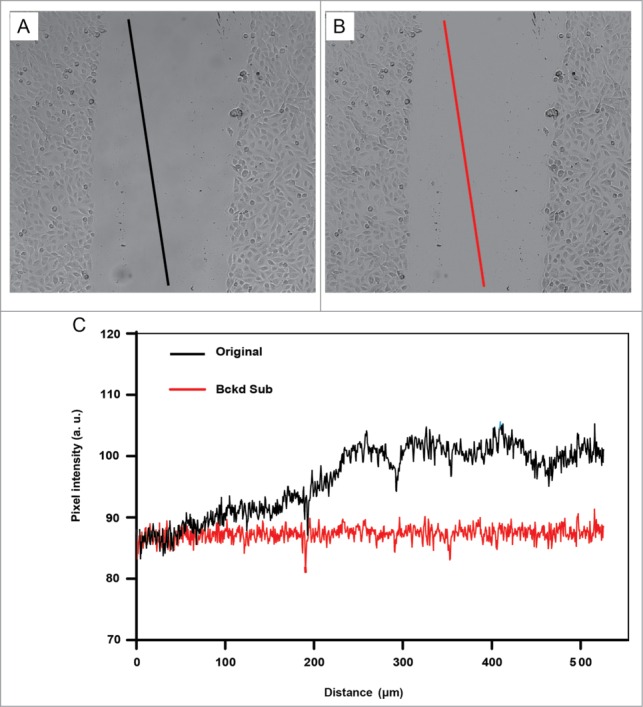
The illumination across the field-of-view is corrected by flat-fielding. Lines along the same image coordinates are drawn on original image (A) and the corrected image (B). In (C), line profiles before (black) and after (red) flat-fielding show pixel intensities along the corresponding lines shown in (A) and (B). The black line profile drawn on the original image (A) shows uneven intensities when the pixel intensities across the line are plotted in C (also shown in black). Note that the slope of the red line from the corrected image is near 0 once flat fielding has been applied, indicating a stable average intensity of the pixel intensities along this line. Cells were derived from a human bronchial epithelial cell line (BEAS-2B cells).
Second, with transmitted-light (including phase contrast) images, it is helpful to increase the contrast between the gap and the area that contains cells. Inspection of the wound healing image in Figure 5A reveals that, although the gap and cells have similar average intensity values in transmitted-light images, they differ in the local variation in pixel intensities. That is, the gap area is smooth and shows little variation in intensity, while abrupt changes in pixel intensities can be seen within the cell monolayer and near the gap-cell interfaces. Processing routines, such as edge detection or variance filters, can be used to create images that highlight the magnitude of changes in the pixel intensities among neighbouring pixels. Where there are small changes in intensity among neighbouring pixels, the pixels are assigned low values (closer to black) and where there are larger fluctuations the pixels are assigned high values (closer to white). An example of an image processed by a Sobel filter, a type of edge filter, is shown in Figure 5B. The edge detection also accentuates noise, but a Gaussian smoothing filter can help to reduce the noise (Figure 5C).
Figure 5.

The images show the workflow involved in a standard wound healing analysis protocol after the flat-fielding step shown in Figure 4. Data were processed using Image-Pro Premier (Rockville, MD). The images are derived from a time series of a sheet migration assay carried out with BEAS cells. The first image in a time series is shown (A) The original greyscale image (A) is pre-processed to make the pixel separation into the gap or cells easier. First, a standard edge detection step (Sobel filter) is applied to (B), followed by smoothing (C). (D) is the histogram of image (C). Note that a single intensity value can separate the gap from the cells (solid line showing the threshold value is shown in histogram). (E) shows the image that is created by using a single threshold intensity value to segment the image into two populations: the gap versus cells. In this way, the number of pixels in each population can be calculated and give the relative areas covered by each population. The small islands of red pixels between the cells can be excluded from the analysis based on size as shown in (F). Here the detected gap pixels are shown in blue compared to the excluded pixels shown in red.
4. Image segmentation
Having prepared and pre-processed the time-lapse image sets, we are now ready to perform “image segmentation,” which is carried out by selecting the gap area using an intensity threshold. The threshold is an intensity cut-off that separates the features of interest (gap) from the background (cells). Most analysis software packages provide a tool for interactively choosing the threshold, allowing one to subjectively slide the threshold value higher and lower until the desired features are selected. A histogram of the intensity values in the image can help to guide the intensity threshold choice. Figure 5D shows the histogram of the resulting image in Figure 5C after edge detection and smoothing. As indicated on the histogram, a single intensity value is chosen to threshold the image into two populations of pixels, corresponding to the gap and the cells, respectively. The detected gap pixels are shown overlaid on the image in Figure 5E. There are also a number of automatic thresholding routines such as Otsu or maximum entropy that may work, thereby providing an objective way of setting the threshold. More sophisticated segmentation routines, such as Image Pro's Smart Segmentation algorithm,43 use texture analysis or pattern recognition to define the features of interest more precisely, which can help to pick out the gap area from the cells more accurately.
After selecting the optimal threshold, the software can split the image up into objects, which are groups of contiguous pixels that all pass the threshold criterion, in this case, a given pixel intensity. In ImageJ, this is accomplished using the “Analyze Particles” feature, whereas Image Pro Premier refers to this as “Count Objects.” The largest object is generally the gap area, but there may still be some smaller regions in the cell area that have the same intensity as the gap area, and are therefore selected along with the gap. In most analysis software there is a method for excluding these unwanted regions by setting a minimum size limit for the objects, the result of which is shown in Figure 5F. As the gap closes, a simple size criterion may no longer be sufficient for unambiguously selecting the gap area: stopping the analysis when the gap reaches 50% closure avoids this problem as discussed in the next section.
Important note about image acquisition parameters and segmentation
It is advisable to carry out segmentation on a few sample data sets run on different days before launching into a full assay. In this way, experimental parameters can be optimized for robust image segmentation. Sometimes the image acquisition settings or other experimental factors can impede the segmentation and it is important to recognize and minimize these factors early on. For example, debris can make it difficult to segment the image into the cells and the gap. When there is debris within the gap, the image segmentation sometimes will detect a gap area containing multiple holes rather than one contiguous section. If left uncorrected, the pixels in the binary image corresponding to debris may be excluded from the gap area pixel determination, leading to a systematic underestimation of the gap area. Of course, it is better to avoid areas with debris during the acquisition but if debris within the area is unavoidable, the settings in the image analysis program can often be set to ignore holes within a contiguous area such as the gap (as for example choosing “include holes” in the Analyze>>Particles command in Fiji/ImageJ).
5. Calculating the wound-healing rate
Having measured the gap area for each frame in the wound healing experiment, we can now plot gap area as a function of time as shown to derive the cell migration rate vmigration and also the t1/2gap value. A straight-line fit is a reasonable approximation and can be readily accomplished using, for example, Excel's Linear Trendline feature. The general equation for a line is given by y = mx + b, where m is the slope of the line and b is the y-intercept, which in our case is the gap area at the start of the experiment. Setting y = b/2 (ie: the point at which the gap is half the original area) and solving for x, we find that the t1/2gap can be expressed as:
| (1) |
The cell sheet migration rate, vmigration, is the average velocity at which the cells collectively move into the gap. The slope is equal to dA/dt, where the area A is the width of the gap (w) times the length of the gap (l). Assuming that the gap is much longer than the field-of-view so that cells do not migrate in from the edges, then the length is constant, so dA/dt = l × dw/dt. Also, the width closes in at twice the rate of the cell migration, so dw/dt = 2 × vmigration. This gives the cell migration rate as:
| (2) |
If the graph is plotted with area in μm2 and time in hours, then vmigration conveniently can be expressed in units of μm/hour. Figure 6 illustrates four time points (A-D) from a scratch wound healing assay carried out using HUVEC cells with the area of the gap plotted over time in Figure 6E. Note that the graph of area over time is linear for the early time points; however, at later time points where the gap is nearly closed, the image analysis routine fails to detect and measure accurate gap areas as shown in Figure 6E. For this reason we did not fit the curve right to the gap closure. In fact, as the trendline is approximately linear, it is sufficient to end the experiment and fit the data up to the half-closure time. For the experiment shown in Figure 6, the calculated t1/2gap is 3.27 hours and the cell sheet migration rate is 8.35 μm/h. While the t1/2gap measurement can only be used to compare wound healing assay experiments for which the initial gap is the exact same width, the cell migration rate is more broadly comparable across datasets with varying wound areas, and is probably the best metric for quantifying the wound healing assay.
Figure 6.

The images in a time series are analyzed for gap area over time (A–C). The images were recorded every 15 min. The outlines show the gap area detected using Fiji.46 Note that the accuracy of the automatic gap detection declines as the gap approaches closure as shown in D, when some of the gap is missed. For this reason, the line is fitted to the points for which the area detection is accurate as determined by visual inspection.
Figure 7 illustrates how this quantitative approach can be applied to compare sheet migration rates between two different cell lines. The gap area was quantified for each frame in each sequence using Image Pro Premier's Wound Healing application module. Upon selection of an appropriate autothreshold level and spatial calibration, the module automatically runs through the sequence and outputs the gap area as a function of time. The data were exported to Microsoft Excel, plotted as an XY scatter plot, and the slope associated with each individual data point was obtained by fitting the data to a linear model. The migration rate was determined from the slope of the line and the length of the gap by using Equation 2. As shown in 7B, the average sheet migration rate for BEAS cells is a little more than double that of MCF7 cells.
Figure 7.

The wound healing assay can reveal differences in migration rates. As an illustration, the sheet migration rates of two different epithelial cell lines (BEAS and MCF7) were determined by plotting the gap area versus time. Two representative data sets for each cell line are plotted in (A). The slope of the resultant graphs yield migration rates in μm/hr. In (B), the average migration rate for both cell types is shown (6 replicates were carried out for each cell line). It can be seen that the sheet migration rate of BEAS cells is more than twice that of the MCF7 cells.
VI. Conclusions and Recommendations
Ideally, the wound healing assay would be carried out on a microscope that combines automated image capture, point visiting and incubation, so that multi-position measurements can be carried out over time under the same conditions. These systems are particularly useful for experiments that require numerous samples, such as screening with drug or RNAi libraries. The acquisition of image sets at identical positions considerably simplifies the analysis of gap closure, as the wound is sampled at multiple points and/or several replicates can be acquired in series.
Although we recommend using automated microscopes equipped for live-cell imaging, wound-healing assays of course can be accomplished using a wide variety of techniques and instrumentation. The key message of this technical review is to design the experiment to enhance the reproducibility of the results. If the wound healing assay is carried out in a standard way, it enables the comparison between researchers and ensures reproducibility. Working according to a standard method can also help researchers achieve more accurate results because they will not overlook parameters that affect their own experiment. We end this technical review by summarizing the experimental guidelines for reproducibility of the wound-healing assay.
Cell culture
Choose a cell type that allows for reproducible cell culture conditions if possible.
For growth of cells, use the same volume of cell type-specific media and always grow cells in identical chambers. Include cell type specific requirements to establish an ECM.
Always seed cells at the same density and start the wound healing assay at the same degree of confluence.
Grow cells under the conditions specified for the chosen cell type. Ensure that the CO2 concentration is correct for the cell type.
Plate cells in a plastic-bottomed 24-well dish. The plastic bottom helps cells to adhere, which is vital for migration. The 24 wells are suitable for plating control and experimental conditions in parallel to ensure experiments are all carried out in the same environment. The size of a 24-well dish is amenable to both scratching and cell culture inserts.
Gap creation
Choose a wounding approach that allows for small and reproducible wounds, thereby allowing for microscopy at higher resolution and better accuracy when measuring wound size and healing.
If a manual wound must be made, use consistent pressure and pipette tip angle to keep the wound consistent.
If using expensive cells or reagents, practice making the wounds on inexpensive cell lines first.
Rinse the wound to remove debris, and replace with fresh medium and growth factors as required.
Use an insert to make the gap a consistent width, and/or for small volumes of cells or reagents.
Aim for a gap size of 0.5 mm, which allows for observation at 4x, 5x or 10x magnification, and reasonable gap closure rates.
Recording wound healing with a microscope
Choose a microscope with environmental control, automatic acquisition over time and automated stage controls for regular sampling of wound healing at multiple positions. While motorized microscopes with built-in incubators may not be available in individual laboratories, they are likely to be available in microscopy core facilities.
Phase contrast imaging (adjusted for Koehler illumination) is generally more appropriate than fluorescence for wound healing.
Record wound healing images until the gap is approximately half closed. In most cases, there is no need to continue until full closure.
Use a 4x, 5x or 10x objective lens. Maximize the wound area in the field-of-view.
Analysis
Develop a protocol for measurement in the early stages of the project. Ensure the protocol is robust before complete recording of data sets.
Software is available for automated gap area measurements.
For manual gap measurements, use flat-field correction and edge detection to prepare the images for analysis. Set a threshold and use size criteria to select the gap area.
Plot gap area versus time, and fit a line to the data to determine t1/2gap, the time it takes for the gap to close to half the original area, and vmigration, the cell migration rate.
Experimental details for the data sets illustrated in this technical review
Two separate microscope systems equipped with stage-top incubators, temperature, CO2, and humidity were used to generate illustrative data sets for this technical review. The data sets shown in Figures 1, 5 and 6 were derived from HUVEC grown on plastic 24-well dishes to one day past confluence and then scratched with a pipette using a p20 tip. The dish containing cells was allowed to settle on the microscope for one hour before initiating image acquisition. The same points in multiple wells were imaged every 15 min with a 10x phase objective using an Olympus IX71 microscope (Olympus Canada, Richmond Hill, Ontario) equipped with an automated stage and transmitted white-light shutter (Prior Scientific, Rockland, MA). The software control of the image acquisition was through Volocity (Perkin Elmer, Waltham, MA). The data shown in Figures 4 and 7 were acquired from BEAS and MCF-7 cells seeded in ibidi inserts (Minitube Canada, Ingersoll, Ontario) in a plastic-bottomed 24-well dish that were incubated 12 hours after a confluent monolayer was formed. The inserts were then carefully removed by peeling them back from one corner as per the manufacturer's instructions, and fresh culture medium was added to fill each well to about 25% of the full volume. The dish was placed on a motorized AxioObserver microscope (Carl Zeiss Canada, North York, Ontario) equipped with an incubator, hardware autofocus and Zen software (Carl Zeiss Canada, North York, Ontario) to automate image acquisition for multiple locations across the dish. Images were acquired every 20 min for approximately 24 hours with a 10x phase objective.
Disclosure of Potential Conflicts of Interest
No potential conflicts of interest were disclosed.
Acknowledgments
The authors would like to thank Dr. Kamala Patel of the University of Calgary for valuable discussions and for experimental support. We thank Dr. Hong Zhang for preparing human umbilical vein endothelial cells for the illustrative examples. We also thank Chelsea Doktorchik and Dr. Simon Hirota of the University of Calgary for testing and critiquing standard protocols for image acquisition and analysis developed by the authors.
Funding
The Live Cell Imaging authors would also acknowledge the Snyder Institute for Chronic Diseases for financial support.
References
- 1. Ilina O, Friedl P. Mechanisms of collective cell migration at a glance. J Cell Sci 2009; 122:3203-8. [DOI] [PubMed] [Google Scholar]
- 2. Friedl P, Gilmour D. Collective cell migration in morphogenesis, regeneration and cancer. Nat Rev Mol Cell Biol 2009; 10:445-57. [DOI] [PubMed] [Google Scholar]
- 3. Friedl P, Wolf K. Plasticity of cell migration: a multiscale tuning model. J Cell Biol 2010; 188:11-9. [DOI] [PMC free article] [PubMed] [Google Scholar]
- 4. Vedula SR, Ravasio A, Lim CT, Ladoux B. Collective cell migration: a mechanistic perspective. Physiology (Bethesda) 2013; 28:370-9. [DOI] [PubMed] [Google Scholar]
- 5. Rorth P. Collective cell migration. Annu Rev Cell Dev Biol 2009; 25:407-29. [DOI] [PubMed] [Google Scholar]
- 6. Rorth P. Fellow travellers: emergent properties of collective cell migration. EMBO Rep 2012; 13:984-91. [DOI] [PMC free article] [PubMed] [Google Scholar]
- 7. Pouliot N PH, Burrows A. Investigating Metastasis Using In Vitro Platforms. Madame Curie Bioscience Database. Austin: (TX: ): Landes Bioscience, 2000. [Google Scholar]
- 8. Lecomte N, Njardarson JT, Nagorny P, Yang G, Downey R, Ouerfelli O, Moore MA, Danishefsky SJ. Emergence of potent inhibitors of metastasis in lung cancer via syntheses based on migrastatin. Proc Natl Acad Sci U S A 2011; 108:15074-8. [DOI] [PMC free article] [PubMed] [Google Scholar]
- 9. Fujisawa T, Rubin B, Suzuki A, Patel PS, Gahl WA, Joshi BH, Puri RK. Cysteamine suppresses invasion, metastasis and prolongs survival by inhibiting matrix metalloproteinases in a mouse model of human pancreatic cancer. PLoS One 2012; 7:e34437. [DOI] [PMC free article] [PubMed] [Google Scholar]
- 10. Hai J, Zhu CQ, Bandarchi B, Wang YH, Navab R, Shepherd FA, Jurisica I, Tsao MS. L1 cell adhesion molecule promotes tumorigenicity and metastatic potential in non-small cell lung cancer. Clin Cancer Res 2012; 18:1914-24. [DOI] [PubMed] [Google Scholar]
- 11. Weijer CJ. Collective cell migration in development. J Cell Sci 2009; 122:3215-23. [DOI] [PubMed] [Google Scholar]
- 12. Martin P, Parkhurst SM. Parallels between tissue repair and embryo morphogenesis. Development 2004; 131:3021-34. [DOI] [PubMed] [Google Scholar]
- 13. Reinhart-King CA. Endothelial Cell Adhesion and Migration. Methods of Enzymology: Elsevier, Inc., 2008:45-61. [DOI] [PubMed] [Google Scholar]
- 14. Kim JH, Serra-Picamal X, Tambe DT, Zhou EH, Park CY, Sadati M, Park J-A, Krishnan R, Gweon B, Millet E, et al. Propulsion and navigation within the advancing monolayer sheet. Nat Mater 2013; 12:856-63. [DOI] [PMC free article] [PubMed] [Google Scholar]
- 15. Vitorino P, Meyer T. Modular control of endothelial sheet migration. Genes Dev 2008; 22:3268-81. [DOI] [PMC free article] [PubMed] [Google Scholar]
- 16. Simpson KJ, Selfors LM, Bui J, Reynolds A, Leake D, Khvorova A, Brugge JS. Identification of genes that regulate epithelial cell migration using an siRNA screening approach. Nat Cell Biol 2008; 10:1027-38. [DOI] [PubMed] [Google Scholar]
- 17. Chapnick DA, Liu X. Leader cell positioning drives wound-directed collective migration in TGFbeta-stimulated epithelial sheets. Mol Biol Cell 2014; 25:1586-93. [DOI] [PMC free article] [PubMed] [Google Scholar]
- 18. Tsai FC, Seki A, Yang HW, Hayer A, Carrasco S, Malmersjo S, Meyer T. A polarized Ca2+, diacylglycerol and STIM1 signalling system regulates directed cell migration. Nat Cell Biol 2014; 16:133-44. [DOI] [PMC free article] [PubMed] [Google Scholar]
- 19. Trepat X, Fredberg JJ. Plithotaxis and emergent dynamics in collective cellular migration. Trends Cell Biol 2011; 21:638-46. [DOI] [PMC free article] [PubMed] [Google Scholar]
- 20. Reffay M, Parrini MC, Cochet-Escartin O, Ladoux B, Buguin A, Coscoy S, Amblard F, Camonis J, Silberzan P. Interplay of RhoA and mechanical forces in collective cell migration driven by leader cells. Nat Cell Biol 2014; 16:217-23. [DOI] [PubMed] [Google Scholar]
- 21. Khalil AA, Friedl P. Determinants of leader cells in collective cell migration. Integrative Biology 2010; 2:568-74. [DOI] [PubMed] [Google Scholar]
- 22. Bindschadler M, McGrath JL. Sheet migration by wounded monolayers as an emergent property of single-cell dynamics. J Cell Sci 2007; 120:876-84. [DOI] [PubMed] [Google Scholar]
- 23. De Rossi G, Whiteford JR. A novel role for syndecan-3 in angiogenesis. F1000Res 2013; 2:270. [DOI] [PMC free article] [PubMed] [Google Scholar]
- 24. Fong E, Tzlil S, Tirrell DA. Boundary crossing in epithelial wound healing. Proc Natl Acad Sci U S A 2010; 107:19302-7. [DOI] [PMC free article] [PubMed] [Google Scholar]
- 25. Shimizu Y, Boehm H, Yamaguchi K, Spatz JP, Nakanishi J. A photoactivatable nanopatterned substrate for analyzing collective cell migration with precisely tuned cell-extracellular matrix ligand interactions. PLoS One 2014; 9:e91875. [DOI] [PMC free article] [PubMed] [Google Scholar]
- 26. Wang Y, Wang G, Luo X, Qiu J, Tang C. Substrate stiffness regulates the proliferation, migration, and differentiation of epidermal cells. Burns : journal of the International Society for Burn Injuries 2012; 38:414-20. [DOI] [PubMed] [Google Scholar]
- 27. Yarrow JC, Totsukawa G, Charras GT, Mitchison TJ. Screening for cell migration inhibitors via automated microscopy reveals a Rho-kinase inhibitor. Chem Biol 2005; 12:385-95. [DOI] [PubMed] [Google Scholar]
- 28. Hulkower K. I., Herber R. L. Cell Migration and Invasion Assays as Tools for Drug Discovery. Pharmaceutics 2011; 3:107-24. [DOI] [PMC free article] [PubMed] [Google Scholar]
- 29. Philippeos C, Hughes RD, Dhawan A, Mitry RR. Introduction to cell culture. Methods Mol Biol 2012; 806:1-13. [DOI] [PubMed] [Google Scholar]
- 30. Clause KC, Barker TH. Extracellular matrix signaling in morphogenesis and repair. Curr Opin Biotechnol 2013; 24:830-3. [DOI] [PMC free article] [PubMed] [Google Scholar]
- 31. Mason BNJC, Joseph P., and Reinhart-King, Cynthia A. Matrix Stiffness: A Regulator of Cellular Behavior and Tissue Formation. In: Bhatia SK, ed. Engineering Biomaterials for Regenerative Medicine: Novel Technologies for Clinical Applications: Springer Science+Business Media, 2012:19-37. [Google Scholar]
- 32. Davis PK, Ho A, Dowdy SF. Biological methods for cell-cycle synchronization of mammalian cells. Biotechniques 2001; 30:1322-6, 8, 30-1. [DOI] [PubMed] [Google Scholar]
- 33. Pirkmajer S, Chibalin AV. Serum starvation: caveat emptor. Am J Physiol Cell Physiol 2011; 301:C272-9. [DOI] [PubMed] [Google Scholar]
- 34. Ashby WJ, Zijlstra A. Established and novel methods of interrogating two-dimensional cell migration. Integr Biol (Camb) 2012; 4:1338-50. [DOI] [PMC free article] [PubMed] [Google Scholar]
- 35. Arciero JC, Mi Q, Branca M, Hackam D, Swigon D. Using a continuum model to predict closure time of gaps in intestinal epithelial cell layers. Wound Repair Regen 2013; 21:256-65. [DOI] [PMC free article] [PubMed] [Google Scholar]
- 36. Vedula SR, Leong MC, Lai TL, Hersen P, Kabla AJ, Lim CT, Ladoux B. Emerging modes of collective cell migration induced by geometrical constraints. Proc Natl Acad Sci U S A 2012; 109:12974-9. [DOI] [PMC free article] [PubMed] [Google Scholar]
- 37. Straatman K. Wound Healing Assay. University of Leicester, College of Medicine, Biological Sciences and Psychology, Advanced Imaging Facilities, 2008. [Google Scholar]
- 38. Inoué S, Spring KR. Video Microscopy : the Fundamentals. New York: Plenum Press, 1997. [Google Scholar]
- 39. Murphy DB, Davidson MW. Fundamentals of Light Microscopy and Electronic Imaging. Hoboken, N.J.: Wiley-Blackwell, 2013. [Google Scholar]
- 40. Goldman RD, Spector DL. Live cell imaging : a laboratory manual. Cold Spring Harbor, N.Y.: Cold Spring Harbor Laboratory Press, 2005. [Google Scholar]
- 41. Kulesa PM, Kasemeier-Kulesa JC. Construction of a Heated Incubation Chamber around a Microscope Stage for Time-Lapse Imaging. CSH Protoc 2007; 2007:pdb prot4792. [DOI] [PubMed] [Google Scholar]
- 42. Salmon ED, Canman JC. Proper alignment and adjustment of the light microscope. Curr Protoc Immunol 2002; Chapter 21:Unit 21.1. [DOI] [PubMed] [Google Scholar]
- 43. http://www.mediacy.com. [Google Scholar]
- 44. Geback T, Schulz MM, Koumoutsakos P, Detmar M. TScratch: a novel and simple software tool for automated analysis of monolayer wound healing assays. Biotechniques 2009; 46:265-74. [DOI] [PubMed] [Google Scholar]
- 45. http://www.ibidi.com. [Google Scholar]
- 46. Schindelin J, Arganda-Carreras I, Frise E, Kaynig V, Longair M, Pietzsch T, Preibisch S, Rueden C, Saalfeld S, Schmid B, et al. Fiji: an open-source platform for biological-image analysis. Nat Methods 2012; 9:676-82. [DOI] [PMC free article] [PubMed] [Google Scholar]