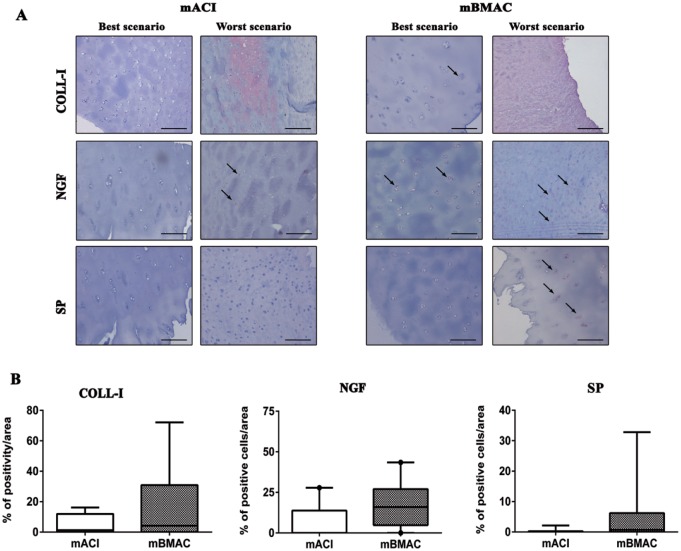
Figure 5.
(A) Representative micrographs of immunohistochemical analyses for collagen, NGF, and SP of osteochondral samples that underwent to mACI and mBMAC procedures at 24-month follow-up. Scale bar = 100 µm. Arrows indicate the presence of positive cells. (B) Graphical representation of percentages of positivity for the aforementioned markers at the cartilage level in patients treated with mACI (n = 7) and mBMAC (n = 15) treatments. Arrows report cell positivity. Data were reported as 95% confidence interval with standard deviation.

