

Abstract
We report evidence of a novel pathogenetic mechanism in which thyroid hormone dysregulation contributes to dementia in elderly persons. Two single nucleotide polymorphisms (SNPs) on chromosome 12p12 were the initial foci of our study: rs704180 and rs73069071. These SNPs were identified by separate research groups as risk alleles for non-Alzheimer’s neurodegeneration. We found that the rs73069071 risk genotype was associated with hippocampal sclerosis (HS) pathology among people with the rs704180 risk genotype (National Alzheimer’s Coordinating Center/Alzheimer’s Disease Genetic Consortium data; n=2,113, including 241 autopsy-confirmed HS cases). Further, both rs704180 and rs73069071 risk genotypes were associated with widespread brain atrophy visualized by MRI (Alzheimer’s Disease Neuroimaging Initiative data; n=1,239). In human brain samples from the Braineac database, both rs704180 and rs73069071 risk genotypes were associated with variation in expression of ABCC9, a gene which encodes a metabolic sensor protein in astrocytes. The rs73069071 risk genotype was also associated with altered expression of a nearby astrocyte-expressed gene, SLCO1C1. Analyses of human brain gene expression databases indicated that the chromosome 12p12 locus may regulate particular astrocyte-expressed genes induced by the active form of thyroid hormone, triiodothyronine (T3). This is informative biologically because the SLCO1C1 protein transports thyroid hormone into astrocytes from blood. Guided by the genomic data, we tested the hypothesis that altered thyroid hormone levels could be detected in cerebrospinal fluid (CSF) obtained from persons with HS pathology. Total T3 levels in CSF were elevated in HS cases (p<0.04 in two separately analyzed groups), but not in Alzheimer’s disease cases, relative to controls. No change was detected in the serum levels of thyroid hormone (T3 or T4) in a subsample of HS cases prior to death. We conclude that brain thyroid hormone perturbation is a potential pathogenetic factor in HS that may also provide the basis for a novel CSF-based clinical biomarker.
Keywords: KATP, SUR2, TDP-43, CARTS, HS-Aging, Braineac
Introduction
Hippocampal sclerosis (HS), characterized by cell loss and astrocytosis in the hippocampus [53, 65], is a common finding at autopsy of old persons [14, 47, 65, 100]. HS pathology is not specific to a particular disease process, so the underlying condition is diagnosed according to other clinical and pathological manifestations [25, 29]. Here we focus on individuals with amnestic dementia in advanced old age, in whom both HS and comorbid TAR DNA-binding protein 43 (TDP-43) pathology, but not advanced Alzheimer’s-type plaques and tangles, are seen at autopsy [2, 3, 45, 64, 70, 97]. Terms previously used to describe these cases include HS-Aging, HpScl, and HS dementia [1, 4, 14, 64]. However, terminology that focuses on HS is suboptimal because extensive pathology (and/or atrophy) exists outside of the hippocampus in this condition [15, 40, 43, 68, 69], and the term HS is far more commonly applied in the scientific literature to a different disease category – epilepsy. Thus a new diagnostic term was required to facilitate progress in the field.
We proposed a descriptive designation, “Cerebral age-related TDP-43 with sclerosis” (CARTS) [66]. The new terminology reflects that there is a distinct disease that preferentially affects persons in advanced old age and TDP-43 pathology is a relatively specific marker. These characterizations were based on clinical-pathologic correlation, neuroimaging, and genetic data [66].
CARTS has a large impact on public health according to studies from multiple high-quality autopsy series [65, 66, 100]. The disease affects approximately 20% of persons in advanced old age [47, 64, 69, 101], and is associated with substantial cognitive impairment [11, 58, 60]. A group-level neurocognitive profile for CARTS patients has been described [64] and replicated [11]. However, CARTS tends to be misdiagnosed in the clinical context as Alzheimer’s disease (AD) because of overlapping symptoms [11, 64, 74], so autopsy data are essential for accurate disease diagnosis. Although CARTS appears to be a brainwide disease [15, 40, 43, 68, 69, 73], retrospective analyses (including the current study) mainly recognize HS, in the appropriate context, for indicating CARTS-type pathology.
Research on CARTS is evolving rapidly, yet there is no validated therapeutic strategy or clinical biomarker. In structural neuroimaging studies, hippocampal atrophy was more severe in cases with CARTS-type pathology than in AD [19], and frontal lobe atrophy was discernible in a retrospective study [43]. In terms of pathogenesis, chronic cerebrovascular disease may contribute to CARTS, and, in addition or alternatively, pathogenetic factors may overlap with FTLD [23, 63, 65, 100, 101].
Gene variants associated with CARTS-type pathology may provide insights into the mechanisms underlying the disease. Single nucleotide polymorphisms (SNPs) associated with altered risk for CARTS-type pathology have been reported in the following four genes, in the chronological order of their discovery: granulin (GRN), transmembrane protein 106B (TMEM106B), ATP-binding cassette, sub-family C, member 9 (ABCC9), and potassium calcium-activated channel subfamily M regulatory beta subunit 2 (KCNMB2) [4, 5, 22, 24, 57, 61]. In contrast to AD, apolipoprotein E (APOE) alleles were not associated with altered risk for CARTS-type pathology [11, 47, 64, 94].
The first published genome wide association study using CARTS-type pathology as an endophenotype reported that two intronic SNPs in near-perfect linkage disequilibrium (LD) with each other (rs704178 and rs704180), in the ABCC9 gene, were associated with CARTS-type pathology [61]. For practical reasons, we refer to rs704180 hereafter. The association between rs704180 and CARTS-type pathology was confirmed in a separate group of subjects [67].
Studies from multiple research centers have implicated the region of the human genome where ABCC9 is located (chromosome 12p12; Fig. 1) in neurodegenerative conditions. Two main points have emerged: 1. Genomic markers in and near chromosome 12p12 were linked to dementia risk, particularly among APOE ε4-negative persons [16, 52, 75, 84]; and, 2. Specific SNPs near the ABCC9 gene were associated with altered risk for developing non-AD neurodegenerative disease phenotypes [27, 73]. Notably, Roostaei and colleagues [80] discovered that a SNP (rs73069071), which is ~500 kilobase-pairs (kbp) away from ABCC9, is associated with a phenotype of brain atrophy out of proportion to Aβ amyloid deposition.
Fig. 1.

Depiction of the region of human DNA that includes ABCC9, SLCO1C1, and single nucleotide polymorphisms (SNPs) that have been associated with non-Alzheimer’s neurodegenerative disease phenotypes according to research from multiple different research centers. Note that SNPs rs704180 and rs73069071 are approximately 500kb from each other on chromosome 12p12. Another SNP evaluated in the current study, rs4148651, is the SNP most strongly associated with ABCC9 expression in the Braineac website (Table 1); the location of rs4148651 is indicated with the orange arrowhead. Specific citations (Refs) are Zou et al [103], Roostaei et al [80], Nelson et al [61, 67], Furney et al [72], and Nho et al [73]. Source for this graphic is https://genome.ucsc.edu/
We hypothesized that SNPs in the ABCC9 genomic region have an impact on gene regulatory mechanism(s) relevant to CARTS. To gain insights into those mechanisms, we analyzed human subjects’ data across a variety of contexts. Genomics data from the AD Genetics Consortium (ADGC) were correlated with clinical and pathologic data from the National Alzheimer’s Coordinating Center (NACC) database [6, 7, 32, 59]. We also correlated genomics data from AD Neuroimaging Initiative (ADNI) with magnetic resonance imaging (MRI) scans to confirm that risk alleles are associated with brain atrophy. Additional databases were evaluated to query the association between the risk alleles and human brain gene expression. Finally, we assayed thyroid hormone (TH) levels in cerebrospinal fluid (CSF) and in serum samples from the University of Kentucky AD Center (UK-ADC) biobank. Collectively, these analyses and experiments implicated TH perturbations in CARTS.
Materials and Methods
Analyses were performed on data obtained from multiple sources (Table 1). Written informed consent was obtained at the time of enrollment and/or genetic sample collection, and protocols were approved by each participating study and the respective sites’ Institutional Review Boards (IRBs). For more information on the data sources and IRBs, please see Acknowledgments in Supplemental Material. The data sources were mostly public-domain data repositories that included genomics. For two of these resources – termed BrainCloud and NABEC – University of Kentucky IRB and data access applications were required through the database of Genotypes and Phenotypes (dbGaP; https://www.ncbi.nlm.nih.gov/gap). In addition to in silico analyses, new experiments were also performed using biosamples (CSF and sera) from patients followed and autopsied at the UK-ADC.
Table 1.
Data sources for the current study
| Data Source (alphabetic order) |
Samples | Primary measurement/ source |
Analytic platform(s) |
Website and source information, Ref# |
|---|---|---|---|---|
| Allen Brain Institute | 90 adults (no Braak VI) |
Parietal cortex and temporal cortex |
RNA Seq | http://aging.brain-map.org/rnaseq/ |
| Alzheimer’s Disease Genetics Consortium (ADGC) and National Alzheimer’s Coordinating Center (NACC) |
2,113 autopsied persons |
Detailed neuropathology data |
Illumina Omni SNP arrays, see methods |
https://www.alz.washington.edu/; http://www.adgenetics.org/ |
| Alzheimer’s Disease Neuroimaging Initiative (ADNI) |
1,239 live persons |
Brain surface measured with MRI |
Illumina Omni SNP arrays, see methods |
http://www.adni-info.org/ |
| Barres Lab human cerebral cortex |
466 cells from 8 human adults, 4 embryos |
Temporal neocortex |
RNA Seq after laser capture micro- dissection |
http://web.stanford.edu/group/barres_lab/cgi-bin/geneSearch.py?geneNameIn=abcc9; Ref [17] |
| Barres Lab with cell type enrichment |
Mice brain cells |
Cell types enriched from cerebrocortical brain areas |
RNA Seq after cell enrichment |
http://web.stanford.edu/group/barres_lab/brain_rnaseq.html; Ref [102] |
| BrainCloud | 148 adults (>20y.o. cutoff) |
Frontal Cortex | Affymetrix Exon 1.0 ST Array, Illumina Omni 1M Immunochip |
http://braincloud.jhmi.edu/; Ref [13]; dbGaP accession #: phs000417.v2.p1 |
| Braineac | 134 adults | 10 brain areas (see Methods) |
Affymetrix GeneChip, Exon 1.0 ST Array |
http://caprica.genetics.kcl.ac.uk/BRAINEAC/; Refs [76, 92] |
| Gil-Ibanez et al, T3 impact on astrocyte gene expression |
T3-treated primary mice cerebrocortical cells |
RNA Seq | Ref [28] | |
| LDlink | NCI/NIH site for search of linkage disequilibrium between SNPs |
http://analysistools.nci.nih.gov/LDlink/; Ref [49] |
||
| North American Brain Expression Consortium (NABEC) |
166 adults (>20y.o. cuttoff) |
Frontal Cortex | Illumina HT12v3 array |
Refs [30, 31]; dbGaP accession #: phs000249.v2.p1 |
| U. Kentucky AD Center autopsy series |
52 autopsied persons |
CSF and sera | T3 and T4 assays (ELISA) |
See methods |
Association between risk SNPs and human neurodegeneration
ADGC/NACC neuropathology data
The ADGC accrued genomics data from 29 different AD Centers (ADCs) as described in detail previously [67]. Briefly, multiple iterations of SNP data [32, 44] were analyzed together with neuropathological and clinical data gathered through NACC [6]. Genomic data from ADGC were transferred from PLINK format, with subsequent analyses performed using R 3.3.1 [91]. NACC data were obtained from the Minimum Data Set, Uniform Data Set, and Neuropathology Data Set [6, 11]. Neuropathologic evaluations were performed according to center-specific protocols -- including whether neuropathologists studied left, right, or bilateral hippocampi -- and entered into a standardized format. Details of CARTS-type pathology case/control operationalization in NACC were described previously [11, 61, 67]. Briefly, all included individuals died after 80 years of age. FTLD-TDP, other FTLD subtypes, and prion pathology cases were excluded from the analyses. For persons that died after 2013, the most recent NACC neuropathology form (v10) was used (https://www.alz.washington.edu/NONMEMBER/NP/npform10.pdf). For these subjects, HS pathology as defined previously [67] with addition of the “NPHIPSCL” parameter. More details on inclusion/exclusion numbers are reported in Supplemental Material.
ADNI neuroimaging data
Information about the research subjects, genotyping, scan methods, and statistical analyses for the correlation between genetics and neuroimaging data in ADNI were as described in detail previously [73]. Briefly, the study included non-Hispanic Caucasians in order to limit the impact of population stratification on association analysis (removing 140 participants). Genotyping was performed using the Illumina Human610-Quad BeadChip for the ADNI-1 participants, and the Illumina HumanOmni Express BeadChip and Illumina Omni2.5M BeadChip for participants initially enrolled in ADNI-GO or ADNI-2. SNPs were imputed separately in each phase as the ADNI cohort used different genotyping platforms. Before the imputation, standard sample and SNP quality control procedures were performed as described previously [71]. T1-weighted brain MRI scans were acquired using a sagittal 3D MP-RAGE sequence following the ADNI MRI protocol [35]. As detailed in previous studies [73, 78], FreeSurfer V5.1 software was utilized to extract brain-wide MRI-based imaging endophenotypes and the SurfStat software package to perform an unbiased whole brain surface-based analysis applying a general linear model (GLM) approach. GLMs were developed using age at baseline, gender, years of education, intracranial volume (ICV), diagnosis at baseline, MRI field strength, and SNP as independent variables. In the whole brain surface-based analysis, the adjustment for multiple comparisons was performed using the random field theory correction method at a 0.05 level of significance.
Testing implications of chromosome 12p12 risk genotypes
Braineac data set analyses
Data were obtained from the Braineac website, (http://caprica.genetics.kcl.ac.uk/BRAINEAC/), which used an experimental pipeline described in Refs [76, 92]. Data from the Braineac data set comprise gene expression data from 10 brain areas (hippocampus, frontal cortex, temporal cortex, occipital cortex, substantia nigra, frontal white matter, thalamus, putamen, medulla, and cerebellum) from 134 autopsied individuals, probed with 1,231 Affymetrix Exon 1.0 ST microarrays, and the same persons’ SNPs were characterized using an Illumina Omni 1M Immunochip platform. For the current study, the downloaded genomic data were analyzed using R 3.3.1 [91] using base packages and, for testing SNP/gene expression associations, the MatrixEQTL package [86] was used.
Human brain cell type specific expression of ABCC9 and SLCO1C1
Data from laser capture microdissection experiments from human temporal neocortex, followed by single cell RNA sequencing, from Ben Barres’s laboratory [17], are available online using a searchable web interface (Table 1). For this resource, no additional data were downloaded or analyzed further.
Gene expression in human brain: associations between TH sensitivity, chromosome 12p12 SNPs, and correlation with ABCC9 and SLCO1C1 expression
We tested whether astrocyte-expressed genes upregulated after exposure to triiodothyronine (T3) also showed gene expression that was correlated with SNPs that affect ABCC9 and SLCO1C1 expression. The genes upregulated after exposure to T3 in astrocytes were identified in mice cultured brain cells by Gil-Ibanez et al [28]. We hypothesized that there would be concerted expression of these genes in human brains. To test this hypothesis, genes enriched after T3 treatment among astrocyte-expressed genes were compared to astrocyte-expressed genes that were not shown to be enriched after T3 exposure. Specifically, we tested the 15 highly-expressed astrocyte genes that were the most enriched following T3 exposure (fold-change relative to controls) in the Gil-Ibanez study. Gene expression data were analyzed from four separate large data sets that contain high-quality human brain gene expression data, focusing on adult brains without end-stage AD. Those data sets were described by the terms Braineac, BrainCloud, Allen Brain Institute, and NABEC (see Table 1). All of the available specimens were included from these sources, with the following exceptions: in BrainCloud, only subjects older than 20 years of age at death were included (n=148 included from that cohort, all frontal cortex); the same 20 years of age cutoff was applied for NABEC (n=166 included from that cohort, all frontal cortex); and, for Allen Institute data, we excluded 17 cases with Braak neurofibrillary tangle (NFT) stage VI pathology, and used parietal and temporal cortex data (n=158 total samples from 90 persons included from that cohort). When more than one transcript variant could have been selected referent to a given gene, we used the transcript that showed highest mean expression across all the samples.
The control (not shown to be induced by T3) astrocyte-expressed genes used for comparison were selected based on the most astrocyte-enriched genes from mice brain experiments, since the T3-enriched genes also were identified in mice brain cells. We used the searchable website http://web.stanford.edu/group/barres_lab/brain_rnaseq.html; Ref [102]. The criteria for selecting genes: those genes that were most enriched in astrocytes relative to neurons, oligodendrocytes (all types including progenitors), and microglia and had Fragments Per Kilobase of exon per Million fragments mapped (FPKM)>50.
Testing thyroid hormone levels in CSF and sera
CSF samples were analyzed from research volunteers in the UK-ADC autopsy cohort. Details of UK-ADC recruitment criteria and clinical assessments have been described [62, 83]. The focus of the current study was subjects with short postmortem interval (PMI) autopsy (<4hrs). To obtain CSF at autopsy, an 18-gauge cannula was inserted into the body of the lateral ventricle. The CSF was centrifuged to remove blood cells and particulate matter, pipetted into 1.5-ml polypropylene tubes, and stored immediately at −80°C. Serum samples were obtained using a 23 or 21 gauge needle during life and stored, without either heparin or ethylenediaminetetraacetic acid (EDTA), at −80°C. Pathological assessment methodology at the UK-ADC has been described in detail [18, 62, 77, 98]. The criteria for HS pathology were neuronal loss and astrocytosis in hippocampal CA1 and subiculum regions, not readily ascribable to another pathology such as abundant NFTs or localizable infarction [53].
For TH assays, Total Thyroxine (T4) and Total T3 enzyme immunoassay test kits (Aviva System Biology, San Diego, CA) were used. Besides those explicitly described below, no other samples were evaluated and no other analyses performed on the included samples. All assays were performed following the manufacturer’s protocols. Briefly, undiluted specimen samples and manufacturer-supplied standard solutions were loaded in triplicate into microtiter plate wells. Samples and enzyme-linked immunosorbent assay (ELISA) plates were processed blind to clinical and pathological information. Absorbance was measured at 450 nm using the microtiter plate reader SpectraMax M3 (Molecular Devices Inc., Sunnyvale, CA). Calculation of T3 and T4 concentrations was accomplished using SoftMax Pro 5.4.1 program (Molecular Devices Inc., Sunnyvale, CA). Data were downloaded to Microsoft Excel, unblinded at that point, and GraphPad Prism 6 was used for statistical analyses.
Two groups of samples (both including controls) were designated “Cohort 1” and “Cohort 2”, and these samples were analyzed on separate ELISA plates. Both cohorts were selected such that the groups with and without HS pathology would have comparable AD-type pathology (by Braak NFT stages [10]), PMI, cognitive status (final Mini-Mental State Exam [MMSE] scores), and length of time the samples were stored in the −80°C freezer before being analyzed in the current study. These cohorts were non-overlapping and each comprised 26 different persons’ CSF, reflecting the number of samples that could be assessed in a single 96-well ELISA plate if the samples were analyzed in triplicate along with the manufacturer supplied standard samples. A third ELISA plate was analyzed to assess serum levels of both T3 and T4 from individuals in Cohort 1 (blood having been drawn prior to death), and a subset of the CSF results from the same group.
Research subjects were not included into, nor excluded from, the study based on clinical thyroid function, and selection was blind to clinical thyroid status. However, after the ELISA analyses were performed, a retrospective database search was performed to determine the status of diagnosed thyroid disease in research subjects from Cohort 1 and Cohort 2. Three different parameters were obtained: “Self-reported thyroid disease”, derived from a questionnaire that the person and/or caregiver filled out, indicating the individual had either hypothyroidism or hyperthyroidism diagnosed while being followed in the longitudinal cohort; “Hypothyroid medicine”, which indicated the person was taking either Synthroid or some other form of L-thyroxine; and, “Hyperthyroid medicine”, which indicated the person was taking methimazole, propylthiouracil, and/or Tapazole. Within each cohort, chi-square tests were used to assess equivalence between cases with and without HS pathology with regard to thyroid disease and medication use.
Results
Testing association between risk SNPs and human neurodegeneration
ADGC/NACC neuropathology results
We first tested whether rs73069071 was associated with HS pathology in a cohort of older (≥80 year old at death) individuals in the NACC neuropathology data set with ADGC genomic characterization. We had previously identified that rs704180 is associated with HS pathology in the NACC/ADGC cohort [61, 67], and here the data included information on 138 additional subjects (27 with HS pathology) who had died after 2013 and who were not included in prior analyses. In the overall cohort (n=2,113), rs73069071 risk genotypes (CC or CT) were associated with HS pathology among individuals with the rs704180 risk genotype (AA), p=0.023 (Table 2).
Table 2.
NACC/ADGC data: Percentage of individuals who died ≥80years old, lacking frontotemporal lobar degeneration, with hippocampal sclerosis (HS) pathology, stratified by SNPs (n=2,113 autopsied individuals including 241 HS cases)
| rs73069071 genotype |
Number of HS cases (%) |
p-value | |
|---|---|---|---|
| rs704180 risk genotype (AA) |
CC or CT TT |
23 (23.0) 63 (13.9) |
0.023* |
| rs704180 non-risk genotype (AG or GG) |
CC or CT TT |
36 (9.6) 119 (10.0) |
0.82 |
-With continuity correction, p=0.034
ADNI neuroimaging results
We next tested whether the SNPs rs73069071 and rs704180 (independent of rs73069071) were associated with brain surface atrophy detectable by structural MRI in older adults from the ADNI cohort (Fig. 2). In the 1,239 included participants, the average age at scan was 73.8 years, percentage of participants with APOE ε4 allele was 46.0%, and percentage of female participants was 42.7%. The risk genotypes for rs73069071 were CC and CT; minor allele frequency (MAF) was 11.8%. The risk genotype for rs704180 was AA; MAF was 48.7%. The assumed models of mode of inheritance were derived from the published literature [5, 67]. Gene variation at both rs73069071 and rs704180 SNPs was associated with widespread brain atrophy as quantified using MRI. Consistent with the pathology results from NACC/ADGC (above), the comparison of brain atrophy among individuals with rs704180 A_A genotype between those with and without the rs73069071 risk (C) allele shows that individuals with both risk genotypes have more atrophy in the medial temporal lobes (arrowheads in Fig. 2c). No associations were observed between brain atrophy and the non-risk alleles of these SNPs at the same statistical threshold (data not shown).
Fig. 2.

Regional brain atrophy that is associated with variation in chromosome 12p12 SNPs in the ADNI cohort (n=1239) as detected by brain MRIs from living subjects. This study evaluated differences in brain volumes comparing those with and without the risk alleles, using methodology as previously described [73]. The regions of the brain where atrophy was associated with the risk allele are shown in shades of blue which indicate p value. Both rs73069071 (a) and rs704180 (b) SNPs were associated with widespread brain atrophy as quantified using MRI. The minor allele frequency for rs73069071 was 11.8% in this cohort, and these cases were excluded from the analyses of rs704180 (b). Panel (c) shows that among persons with the rs704180 A_A genotype, comparing between those with and without the rs73069071 risk genotype (any C allele) shows that individuals with the rs73069071 risk genotype have more atrophy in the medial temporal lobes (red arrowheads).
Testing implications of risk SNPs on human brain gene expression
Analyzing the association between chromosome 12p12 SNPs and gene expression
The Braineac website (Table 1) identifies the SNP with the strongest associations with expression of ABCC9 transcripts across all specimens; this was rs4148651, an intronic ABCC9 SNP. The National Institutes of Health/National Cancer Institute-sponsored search engine “LDlink” (Table 1) was used to test whether any of the three SNPs (rs704180, rs73069071, and rs4148651; Fig. 1) tend to show allelic association due to linkage, i.e. are in LD. According to this database, surveyed using “All populations”, rs704180 and rs4148651 were in LD, albeit relatively weakly at D’=0.44, r2=0.14. Neither rs4148651 nor rs704180 were in LD with rs73069071.
In the Braineac data set, which had the greatest sample size with 1,231 microarrays included, all three SNPs were associated with ABCC9 gene expression (Table 3). For both rs704180 and rs73069071, there was a consistent pattern noted as shown on Fig. 3: both SNPs were associated with the expression of multiple different ABCC9 exons (associated at p<0.05 were 28 probes for rs704180, 35 probes for rs73069071). The SNP rs73069071 was associated with gene expression of two additional chromosome 12p12 genes, SLCO1C1 (Table 3) and PDE3A (data not shown). In addition, rs4148651 was associated with altered expression of SLCO1C1 (Table 3). The interactions between the three SNPs (haplotypes) in association with gene expression is a complicated bioinformatics challenge that we will address in a separate manuscript. Since SLCO1C1 expression was associated with SLCO1A2 and ABCC9 SNPs, we focused on a hypothetical gene regulatory mechanism related to SLCO1C1 function.
Table 3.
Testing the association between SNP status and gene expression, Braineac (n=1,231 gene expression microarrays, 134 SNP arrays, see Table 1): p-values
| SLCO1A2 SNP | ABCC9 SNPs | ||
|---|---|---|---|
| Gene | rs73069071 | rs704180 | rs4148651 |
| ABCC9 | 0.0067 | 0.011 | 5.3 × 10⁻⁷ |
| SLCO1C1 | 0.0060 | 0.25 | 0.0031 |
Fig. 3.

“Braineac” website (Table 1) data enabled testing of expression levels of exons across the ABCC9 transcript. The microarray enabled quantification of the expression of the individual exons using 48 different probes referent to ABCC9 (Affymetrix Exon 1.0 ST microarray Probe ID#’s 3446921–3447003). The probes consistently showed expression changes that were associated with rs704180 (red circles) and rs73069071 (green circles) SNP status. The genome assembly used for this figure is Build 34 which relates directly to the probe set reference values.
Testing human cell type specific expression of ABCC9 and SLCO1C1
A searchable web-based database indicated that both ABCC9 and SLCO1C1 were highly expressed in mature astrocytes in the human brain (Fig. 4). Further, each of the transcripts were expressed at relatively high levels (88th percentile for ABCC9, 98th percentile for SLCO1C1) in these human brain samples.
Fig. 4.

Both ABCC9 and SLCO1C1 are relatively highly expressed in mature astrocytes in the human brain. These results indicate human brain cell type specificity of ABCC9 (a) and SLCO1C1 (b) expression in this publicly available website. The study design [17] involved laser capture microdissection of cells from “temporal lobe cortex” of humans, followed by RNA-seq, from Ben Barres’s laboratory.
Source: http://web.stanford.edu/group/barres_lab/cgi-bin/geneSearch.py?geneNameIn=abcc9
Assessing astrocyte-expressed genes in public access data sources
Since SLCO1C1 encodes an astrocytic TH transporter, we hypothesized that SNPs that change expression of SLCO1C1 could alter expression of downstream TH-regulated genes:
Genes that had been identified as astrocyte-expressed and enriched after T3 treatment by Gil-Ibanez et al [28] showed gene expression that was associated with SNP status for rs4148651 and rs73069071 (Table 4). Further, those same genes showed expression that were relatively strongly correlated with both ABCC9 and SLCO1C1 in the human brain across four separate high-quality data sets. By contrast, other genes that were enriched in astrocytes, but are not known to be T3-sensitive, did not show gene expression that was strongly associated with chromosome 12p12 SNPs, and these genes also did not correlate as strongly with ABCC9 or SLOC1C1 in the human brain gene expression databases. Note that in contrast to the human brain expression data, the T3 responsiveness, and the astrocyte enrichment data, were both derived from published studies that used mice brain cells [17, 102]. Overall, these data are compatible with the hypothesis that T3 hormone regulation in the brain is sensitive to chromosome12p12 SNPs, with relatively wide-ranging impact on astrocyte gene expression, spanning many chromosomes. In summary, the chromosome 12p12 SNPs appeared capable of altering TH-mediated astrocytic gene expression.
Table 4.
Astrocyte-expressed genes in public access data sources: enrichment in cell culture after thyroid hormone (T3) treatment, association between gene expression and SNP status, and association with the gene expression of ABCC9 and SLCO1C1 in four different large human brain gene expression data sets
 |
- From Gil-Ibanez et al [28]. Shown are the 15 astrocyte-expressed genes that were most upregulated following treatment of mouse cerebrocortical cells with triiodothyronine (T3) in culture, FPKM >10
- See Table 1 for more information; each data set comprises a separate cohort with >100 human brain samples with gene expression profiling
- For comparison, the top 10 expressed astrocyte genes as determined to be expressed in mouse astrocytes (in comparison to Neuron, OPC, Newly Formed Oligodendrocyte, Myelinating Oligodendrocyte, Microglia) in http://web.stanford.edu/group/barres_lab/brain_rnaseq.htm
Testing thyroid hormone levels in CSF and sera
To follow up on the neuropathology, neuroimaging, and genomics analyses, and because CSF has previously been shown to contain quantifiable TH [38, 82, 88], we tested whether CSF TH levels were changed in cases with autopsy-confirmed CARTS/HS. Six separate ELISA plates were used, three each for T3 and T4 analyses, and each of which allowed 26 test samples to be evaluated in triplicate along with the manufacturer-supplied samples used for generating the standard curves. Two different groups of samples, designated “Cohort 1” and “Cohort 2”, were evaluated (Table 5). In both groups, HS+ cases had lower cognitive status, approximately the expected amount of global cognitive impairment (operationalized by final MMSE scores) that is directly associated with HS pathology in this cohort [60]. Although characteristics for HS+ and HS− cases were similar within each cohort, the two cohorts had differing characteristics overall -- Cohort 2 had relatively less AD pathology, higher cognitive status before death, were older, and the samples were stored longer in the freezer before the TH assays were performed.
Table 5.
Information about research subjects from Cohort 1 and Cohort 2 with CSF analyzed for T3 and T4 levels, stratified by presence or absence of hippocampal sclerosis (HS) pathology. Cohorts were matched for age, amount of Alzheimer’s-type (Braak NFT stage) pathology, postmortem interval (PMI) before autopsy, and number of years stored in a −80°C freezer
| Cohort 1 | |||||||
| n | M:F | Age | Avg MMSE | % Braak > III | PMI (Hrs) | Years in freezer | |
| HS+ | 8 | 2:6 | 90.0 | 15.0 | 62.5 | 2.3 | 4.0 |
| HS− | 18 | 10:8 | 89.6 | 22.8 | 61.1 | 2.4 | 5.5 |
| p-value* | 0.91 | 0.008 | 1.0 | 0.35 | 0.65 | ||
| Cohort 2 | |||||||
| HS+ | 12 | 3:9 | 92.9 | 21.0 | 33.3 | 2.6 | 7.4 |
| HS− | 14 | 4:10 | 92.4 | 25.3 | 21.4 | 2.4 | 7.0 |
| p-value* | 0.79 | 0.02 | 0.67 | 0.86 | 0.67 | ||
-p-values are in comparing mean values using a Student’s t-test, except the Fisher’s exact test was used for comparing % of cases with Braak NFT stage > III.
We first assessed whether the assays’ sensitivity and technical parameters (using ELISA to study banked CSF samples in this context) were acceptable (Supplemental Fig. 1). Detected levels of TH were within the dynamic range of the assay, as determined using the sample standards provided by the manufacturer. Further, there was not a substantial (at p<0.05 level of significance) variation in detected T3 or T4 levels associated with PMI, age at death, or years of storage in the freezer. There did seem to be technical variance between plate readings (change in slope of standard curve resulting in different average values) so we did not compare or combine results across different plate readings.
Results of the T3 assays of CSF are shown in Figs. 5 and 6. In both non-overlapping experimental cohorts, the levels of total T3 detected were increased in cases with HS pathology relative to controls (p=0.030 for Cohort 1, p=0.033 for Cohort 2, both using Student’s t-test, 2-tailed, assuming unequal variance). Detected total T4 levels were not different for HS+ and HS− cases (p=0.080 for Cohort 1, p=0.95 for Cohort 2). Neither T3 nor T4 levels were changed in relation to AD pathology, with the caveat that the small sample sizes did not enable sufficient statistical power to detect modest differences.
Fig. 5.

In two non-overlapping convenience samples (n=26 persons in each), T3 levels were increased in CSF obtained from cases with hippocampal sclerosis (HS) pathology (a, b show results of Cohort 1 and Cohort 2) relative to controls. Statistics were run with Student’s t-test, 2-tailed, assuming unequal variance. Bars depict standard error of the mean. Each of the comparison groups were matched for age, overall cognitive status (final MMSE score before death), the degree of AD-type pathology, length of time the CSF sample was stored at −80°C, and the post-mortem interval. The number of the samples used in each assay cohort was determined by the number of samples that could be applied in triplicate in a single ELISA assay while also including a standard curve. The data point referent to Fig. 7 is shown with a green arrow.
Fig. 6.
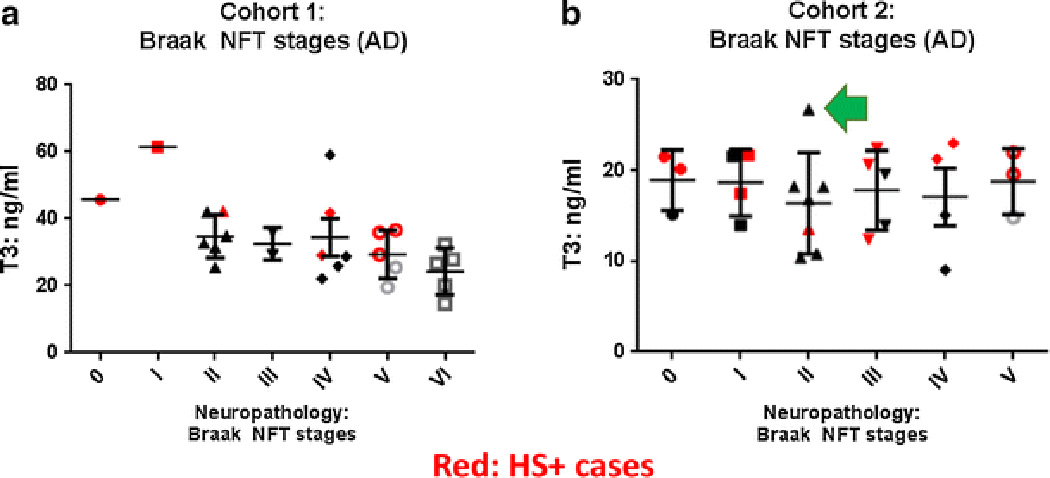
T3 levels were not increased in CSF with increasing severity of Alzheimer’s disease (AD) pathology (a, b show results of Cohorts 1 and Cohort 2). In comparison with Cohort 1, Cohort 2 cases had on average less severe AD pathology but the HS and non-HS cases were still matched for various parameters including severity of AD pathology as operationalized with Braak NFT stages. Bars depict standard error of the mean. Data points related to individuals with autopsy-confirmed HS pathology are shown in red. The data point referent to Fig. 7 is shown with a green arrow.
We also evaluated total T3 and T4 levels from serum. These were obtained from a convenience subsample of the same research volunteers (Table 6). The serum samples were stored at −80°C after having been drawn while the patients were alive, on average 40.9 (HS+) and 41.8 (HS− cases) months prior to death. In these experiments, a total of 16 serum samples (10 HS−, 6 HS+) were available, and were correlated with results for 10 CSF samples (5 HS−, 5 HS+) from Cohort 1. As expected, total T4 levels were higher in serum (~70 ng/ml) than in CSF (~30 ng/ml), whereas total T3 levels were higher in CSF (~20 ng/ml) than serum (~8 ng/ml), p<0.0001 for these comparisons. These numbers are best interpreted relative to each other since these are not laboratory tests validated for these experimental contexts. In contrast to the CSF, where the T3 levels trended higher in the HS+ cases, the T3 levels trended slightly lower in the serum samples obtained during life among individuals with eventual autopsy-proven HS. However, only 5 HS+ and 5 HS− CSF samples were included on the ELISA plates for comparison to the serum results, so the trend did not reach statistical significance.
Table 6.
Total T3 and T4 levels in a subsample of sera (n=16) that were obtained prior to death, and re-analyzed autopsy derived CSF (n=10), from among Cohort 1 subjects, stratified by hippocampal sclerosis (HS) pathology
| Analyses of sera and reanalyzed CSF (subsample of cohort 1 cases) | |||||||
|---|---|---|---|---|---|---|---|
| Sera subsample | CSF subsample | ||||||
| n | # months sera drawn premorterm |
T3 Mean ng/ml |
T4 mean ng/ml |
n | T3 Mean ng/ml |
T4 mean ng/ml |
|
| HS+ cases | 6 | 40.9 | 8.9 | 76.7 | 5 | 19.0 | 28.0 |
| HS− cases | 10 | 41.8 | 8.1 | 76.6 | 5 | 24.7 | 30.5 |
| p-value* | 0.96 | 0.57 | >0.99 | 0.17 | 0.27 | ||
-p-values are in comparing mean values using a Student’s t-test
Results of a retrospective analysis of clinically-relevant thyroid function in persons in Cohort1 and Cohort 2 are shown in Table 7. One person (HS+ case in Cohort 2) had missing data. Two subjects had remote history of thyroid disease, no longer treated. Otherwise, chi-square analyses did not indicate any differences between HS+ and HS− subjects in either cohort. Those with reported thyroid disease tended to have thyroid hypofunction in this sample since almost all were taking L-thyroxine. Although not different between persons with and without HS pathology in this relatively small sample, it is notable that overall one-third (17/51) of individuals in this series had clinically relevant thyroid disease.
Table 7.
Parameters related to self-reported thyroid disease and thyroid related medications in Cohort 1 and Cohort 2, stratified by hippocampal sclerosis (HS) pathology
| n | Self-reported thyroid disease* Y/N |
Hypothyroid medicine* Y/N |
Hyperthyroid medicine* Y/N |
|
|---|---|---|---|---|
| Cohort 1 | ||||
| HS+ | 8 | 3/5 | 3/5 | 0/8 |
| HS− | 18 | 5/13 | 5/13 | 0/18 |
| Cohort 2 | ||||
| HS+ | 11 | 4/7 | 3/8 | 0/11 |
| HS− | 14 | 5/9 | 7/7 | 0/14 |
-See Methods for explanation
We also investigated retrospectively the pathology on a single case in detail (Fig. 7). This individual was selected because ELISA results indicated high total T3 level in CSF although HS was not diagnosed at autopsy (see green arrows, Fig. 5b and Fig. 6b). The research subject was a woman who died at age 95 and who had a final MMSE score of 27, almost 17 months prior to death. At her last clinic visit she was taking L-thyroxine for clinical hypothyroidism. Autopsy found minimal AD-type pathology and the brain was negative for phospho-TDP-43 pathology in the left hippocampus and left frontal lobe (Brodmann Area 9). However, there was an area – apparently a micro-infarct – in the right hippocampus with cell loss and gliosis (Fig. 7b). We retrospectively immunostained the right hippocampus for phospho-TDP-43 (1D3 clone) and found stained structures compatible with incipient TDP-43 pathology (Fig. 7c). It is unknown how this pathology is mechanistically related to HS/CARTS but this case helps to demonstrate the complex nature of brain pathologies in advanced age.
Fig. 7.

The CSF sample that had the highest level of detected total T3 in Cohort 2 (green arrows in Figs. 5 and 6) was from the brain of a woman with clinical hypothyroidism (taking L-thyroxine at last clinic visit), who died at age 95 with final MMSE score of 27, and who lacked frank hippocampal sclerosis pathology. Alzheimer’s disease-type pathology was minimal: Braak NFT stage II, Thal Aβ stage 1, with no neuritic amyloid plaques. Phospho-TDP-43 pathology was not identified in left hippocampus or frontal lobe. However, there was an area in the right hippocampus with cell loss and astrocytosis presumed to represent a microinfarct (arrow in panel a, boxed area shown at higher magnification in panel b). In this section, small foci of phospho-TDP-43 (P-TDP-43) immunoreactive structures were seen in CA1 (c). Hippocampal CA1 and dentate granule (dg) regions are indicated for orientation. Scale bars = 2mm (a) 300 µm (b), and 50 µm (c).
In summary, T3 levels were increased in the CSF of pathologically confirmed HS+ cases relative to persons without HS pathology in samples from two separate groups. These experimental results seem specific since differences were not detected for T4 levels, nor in serum, nor in cases stratified by AD pathology. The total T3 and T4 assay results appear robust given the technical parameters that were evaluated.
Discussion
Analyses of genetic risk alleles on chromosome 12p12 led to studies that implicated TH perturbation in CARTS. Although we only performed direct experimental tests on biofluids from 52 human subjects (17 with HS pathology), our study also incorporated analyses of data in the public domain referent to thousands of other individuals. Thus, finding evidence of a novel pathogenetic mechanism in a deeply complex milieu was enabled by the efforts of innumerable research volunteers and fellow researchers.
We found that two SNPs that are within ~500kbp of each other on human chromosome 12p12 (rs73069071 and rs704180) were both associated with brain atrophy, brain pathology, and expression of ABCC9. Further, gene variants in this region, which were associated with altered gene expression for both ABCC9 and SLCO1C1, could also be correlated with a larger group of TH responsive astrocyte-expressed genes. This effect was at least somewhat specific since astrocyte-expressed genes that were not T3-responsive did not correlate with ABCC9, SLCO1C1, or the SNPs. We hypothesize that TH plays a role in CARTS pathogenesis, and consistent with that, we found that total T3 levels were increased in CSF of HS cases relative to controls. This study may help begin to explain and reconcile phenomena previously thought unrelated – chromosome 12p relationship to dementia, genomics of CARTS, a role for astrocytes in hippocampal TDP-43 pathology, and TH dysregulation in dementia.
Chromosome markers in and near human chromosome 12p12 have been implicated repeatedly in dementia risk. The marker D12S1057, located ~2.5 Mbp in the centromeric direction from ABCC9, was linked to presumed AD in multiple studies [52, 75, 79, 85]. Interestingly, the association was in some cohorts strongest among APOE ε4- individuals and was not apparent in a relatively younger cohort [99]. There are also specific SNPs in the chromosome 12p12 region that have been associated with neurodegenerative phenotypes (Fig. 1). For example, Furney et al [27] reported that rs10743430 (~50kb upstream from ABCC9) is associated with MRI-detected “entorhinal thinning”.
Within the region between ABCC9 and SLCO1C1 on human DNA are genes that are relatively highly expressed in glia and/or brain endothelial cells. The arrangement of these genes on the DNA is conserved across many species whose common ancestors lived >400 million years ago. For example, in the Coelecanth fish Latimeria chalumnae, as in humans, between ABCC9 and SLCO1C1 genes are KCNJ8, GOLT1B, LDHB, SLCO1A2, and PYROXD1. The retained order and proximity of these genes during evolution raises the possibility of adaptive brain function(s), related to orchestrated gene regulation in that region. Since SLCO1C1 is the primary transporter of TH into astrocytes [9, 95], it is a credible hypothesis that modulating SLCO1C1 expression is one of the ways that brain TH is regulated.
TH has strong biologic impact on the central nervous system. Lack of TH from birth causes a maldevelopment syndrome (“cretinism”), with severe mental retardation and extensive white matter pathology [81]. This syndrome has become rare in developed countries with neonatal screening and salt iodination. In the adult mammalian brain, TH plays important roles in metabolic regulation and astrocyte biology [21, 56]. TH dysregulation has been implicated in dementia previously -- both hyperthyroid and hypothyroid states have been linked to dementia [20, 39, 50, 54, 90]. TH has previously been evaluated in CSF [38, 82, 87, 88], with varying results, but was never previously tested in relation to CARTS-type pathology. Ultimately, although TH is a biologically powerful molecule, and dementia is a common clinical syndrome, there currently is poor understanding of how TH perturbations contribute to dementia.
Whereas much remains to be learned about the complex biology of TH in the brain, it has been established that astrocytes play important roles in brain TH function. Astrocytes help import T4 from blood, process the hormone (convert T4 into T3), and deliver T3 to neurons [8, 9, 37, 42, 55]. T3 has strong impact on the astrocytes themselves, apparently driving a more developmentally ‘mature’ phenotype via transcriptional regulation [28, 51, 93].
A topical question is: do astrocytes participate in the pathogenetic cascade in CARTS? TDP-43 pathology is a key component of the pathologic phenotype [3, 66]. Although TDP-43 pathology in CARTS is conspicuous within neurons and neurites [2, 34, 65], astrocytes may play an active role in the pathogenesis. In Alexander disease, a disorder caused by toxic upregulation of glial fibrillary acidic protein (GFAP), hippocampal TDP-43 pathology is frequently comorbid with the stereotypical astrocytic pathology and leukodystrophy [96]. Lin et al [48] described that TDP-43 pathology can be present in astrocyte foot-processes in the hippocampus. Abundant GFAP protein was also found in a urea-insoluble protein fraction isolated from HS+ subiculum—the same fraction that also contained pathologic TDP-43 protein [65].
The hypothesis that astrocytes play a pathogenetic role in CARTS is supported by the present study. A novel regulatory mechanism may involve an astrocytic “metabolic sensor”, ABCC9, and a metabolic transporter, SLCO1C1 (Fig. 7). The ABCC9 gene product detects low ATP levels, opening a K+ (“KATP”) channel which leads to altered intracellular Ca++ levels [63]. ABCC9 helps regulate vascular function [26, 89], and mutations in ABCC9 have been shown to cause “tortuous” cerebral blood vessels in a human neuroimaging series [46]. Both ABCC9 and SLCO1C1 have been cloned in separate studies from rat brain microvasculature [12, 41], and small blood vessel pathology in humans has been implicated in CARTS [33, 68, 69]. A dysregulated pathway related to metabolic signaling in small blood vessels could mediate between ischemic stress in the aged brain and downstream effects such as TDP-43 pathology.
Although the current study provides evidence for a novel pathogenetic mechanism in the human brain, there are also limitations and potential pitfalls. Biologic complexity must be factored into interpretation of our results, given how much is unknown currently about the aged brain, the relevant biochemical pathways, and the comorbid pathologies. The gathering of data and analyses from many different sources increased the possibility of false-positive discovery due to over-testing. We attempted to minimize this source of bias by focal hypothesis-testing as much as possible. A benefit of our approach is that analyses can be replicated by others since the data are in the public domain. Yet there is potential for our analytic results to be “true, true, and unrelated”. For example, the genomic risk factors may not be directly or indirectly related, in a biologic sense, to the CSF T3 perturbations seen in persons with HS pathology. Also, the T3 assay results may be explained by perturbations in TH carrier molecules (e.g., transthyretin). Despite these uncertainties, detected T3 levels in CSF represent a potential clinical test for CARTS, which is a common disease that currently lacks a valid biomarker. We did not attempt to assess TH status in clinical (lumbar puncture) CSF samples, nor from other brain diseases such as FTLD, or the important subset of brains that have minimal or no HS pathology but TDP-43 pathology is present [34, 60]. Finally, Roostaei et al [80] noted that rs73069071 is located within the IAPP gene which encodes the polypeptide amylin. Unlike the overlapping gene SLCO1A2, IAPP/amylin is not known to be expressed in the human brain, but amylin has been associated with dementia through a mechanism linked to diabetes [36]. We conclude that there are many intriguing research questions to be addressed in future work.
Supplementary Material
Fig. 8.

Cartoon depicts how ABCC9 and SLCO1C1 may participate in regulation of thyroid hormones (T3 and T4) in astrocytes. Highlighted areas of interest (black multi-point stars) that require further study include: 1. ABCC9 gene product (SUR2) may link metabolic needs and altered transcriptional signaling; 2. T4 transport into astrocytes (mediated by SLCO1C1 protein) may be affected by advanced old age, which often is attended by disrupted vasculature, increased oxidation, and various stressors; 3. T3-mediated gene expression regulation in astrocytes may change under conditions of stress or ischemia; 4. How T3 transport is regulated by SLCO1C1 and other transporters that are not astrocytic; 5. T3 transport from astrocytes into neurons and CSF, which may be altered by various stressors and/or aging itself. Increased T3 levels in CARTS cases’ CSF may have pathogenetic impact on neurons and/or synapses.
Acknowledgments
We are extremely grateful to the research volunteers, clinicians, data repositories, and researchers that contributed to this work. Funding included National Institutes of Health grants for Alzheimer’s Disease Genetics Consortium (ADGC; U01 AG032984 and RC2AG036528), National Alzheimer’s Disease Coordinating Center (NACC; U01 AG016976), the National Cell Repository for Alzheimer’s Disease (NCRAD, which received support through a cooperative agreement grant, U24 AG21886), and additional grants K25 AG043546, R21 AG050146, UL1TR000117, and the UK-ADC P30 AG028383. Phospho-TDP-43 clone 1D3 antibody was graciously provided by Dr. Manuela Neumann. Special thanks to Ms. Ela Patel and Ms. Sonya Anderson for technical assistance. For additional acknowledgments including funding support information, please see Supplemental Material.
References
- 1.Amador-Ortiz C, Ahmed Z, Zehr C, Dickson DW. Hippocampal sclerosis dementia differs from hippocampal sclerosis in frontal lobe degeneration. Acta neuropathologica. 2007;113:245–252. doi: 10.1007/s00401-006-0183-4. [DOI] [PMC free article] [PubMed] [Google Scholar]
- 2.Amador-Ortiz C, Dickson DW. Neuropathology of hippocampal sclerosis. Handb Clin Neurol. 2008;89:569–572. doi: 10.1016/S0072-9752(07)01253-5. [DOI] [PubMed] [Google Scholar]
- 3.Amador-Ortiz C, Lin WL, Ahmed Z, et al. TDP-43 immunoreactivity in hippocampal sclerosis and Alzheimer's disease. Annals of neurology. 2007;61:435–445. doi: 10.1002/ana.21154. [DOI] [PMC free article] [PubMed] [Google Scholar]
- 4.Aoki N, Murray ME, Ogaki K, et al. Hippocampal sclerosis in Lewy body disease is a TDP-43 proteinopathy similar to FTLD-TDP Type A. Acta Neuropathol. 2015;129:53–64. doi: 10.1007/s00401-014-1358-z. [DOI] [PMC free article] [PubMed] [Google Scholar]
- 5.Beecham GW, Hamilton K, Naj AC, et al. Genome-wide association meta-analysis of neuropathologic features of Alzheimer's disease and related dementias. PLoS Genet. 2014;10:e1004606. doi: 10.1371/journal.pgen.1004606. [DOI] [PMC free article] [PubMed] [Google Scholar]
- 6.Beekly DL, Ramos EM, Lee WW, et al. The National Alzheimer's Coordinating Center (NACC) database: the Uniform Data Set. Alzheimer disease and associated disorders. 2007;21:249–258. doi: 10.1097/WAD.0b013e318142774e. [DOI] [PubMed] [Google Scholar]
- 7.Beekly DL, Ramos EM, van Belle G, et al. The National Alzheimer's Coordinating Center (NACC) Database: an Alzheimer disease database. Alzheimer disease and associated disorders. 2004;18:270–277. [PubMed] [Google Scholar]
- 8.Bernal J. Thyroid hormones and brain development. Vitam Horm. 2005;71:95–122. doi: 10.1016/S0083-6729(05)71004-9. [DOI] [PubMed] [Google Scholar]
- 9.Bernal J, Guadano-Ferraz A, Morte B. Thyroid hormone transporters--functions and clinical implications. Nat Rev Endocrinol. 2015;11:406–417. doi: 10.1038/nrendo.2015.66. [DOI] [PubMed] [Google Scholar]
- 10.Braak H, Braak E, Bohl J. Staging of Alzheimer-related cortical destruction. European neurology. 1993;33:403–408. doi: 10.1159/000116984. [DOI] [PubMed] [Google Scholar]
- 11.Brenowitz WD, Monsell SE, Schmitt FA, Kukull WA, Nelson PT. Hippocampal sclerosis of aging is a key Alzheimer's disease mimic: clinical-pathologic correlations and comparisons with both alzheimer's disease and non-tauopathic frontotemporal lobar degeneration. J Alzheimers Dis. 2014;39:691–702. doi: 10.3233/JAD-131880. [DOI] [PMC free article] [PubMed] [Google Scholar]
- 12.Chu C, Li JY, Boado RJ, Pardridge WM. Blood-brain barrier genomics and cloning of a novel organic anion transporter. J Cereb Blood Flow Metab. 2008;28:291–301. doi: 10.1038/sj.jcbfm.9600538. [DOI] [PMC free article] [PubMed] [Google Scholar]
- 13.Colantuoni C, Lipska BK, Ye T, et al. Temporal dynamics and genetic control of transcription in the human prefrontal cortex. Nature. 2011;478:519–523. doi: 10.1038/nature10524. [DOI] [PMC free article] [PubMed] [Google Scholar]
- 14.Corey-Bloom J, Sabbagh MN, Bondi MW, et al. Hippocampal sclerosis contributes to dementia in the elderly. Neurology. 1997;48:154–160. doi: 10.1212/wnl.48.1.154. [DOI] [PubMed] [Google Scholar]
- 15.Cykowski MD, Takei H, Van Eldik LJ, et al. Hippocampal Sclerosis but Not Normal Aging or Alzheimer Disease Is Associated With TDP-43 Pathology in the Basal Forebrain of Aged Persons. Journal of neuropathology and experimental neurology. 2016;75:397–407. doi: 10.1093/jnen/nlw014. [DOI] [PMC free article] [PubMed] [Google Scholar]
- 16.D'Introno A, Solfrizzi V, Colacicco AM, et al. Current knowledge of chromosome 12 susceptibility genes for late-onset Alzheimer's disease. Neurobiology of aging. 2006;27:1537–1553. doi: 10.1016/j.neurobiolaging.2005.09.020. [DOI] [PubMed] [Google Scholar]
- 17.Darmanis S, Sloan SA, Zhang Y, et al. A survey of human brain transcriptome diversity at the single cell level. Proceedings of the National Academy of Sciences of the United States of America. 2015;112:7285–7290. doi: 10.1073/pnas.1507125112. [DOI] [PMC free article] [PubMed] [Google Scholar]
- 18.Davis DG, Schmitt FA, Wekstein DR, Markesbery WR. Alzheimer neuropathologic alterations in aged cognitively normal subjects. Journal of neuropathology and experimental neurology. 1999;58:376–388. doi: 10.1097/00005072-199904000-00008. [DOI] [PubMed] [Google Scholar]
- 19.Dawe RJ, Bennett DA, Schneider JA, Arfanakis K. Neuropathologic correlates of hippocampal atrophy in the elderly: a clinical, pathologic, postmortem MRI study. PLoS ONE. 2011;6:e26286. doi: 10.1371/journal.pone.0026286. [DOI] [PMC free article] [PubMed] [Google Scholar]
- 20.de Jong FJ, Masaki K, Chen H, et al. Thyroid function, the risk of dementia and neuropathologic changes: the Honolulu-Asia aging study. Neurobiology of aging. 2009;30:600–606. doi: 10.1016/j.neurobiolaging.2007.07.019. [DOI] [PMC free article] [PubMed] [Google Scholar]
- 21.Dezonne RS, Lima FR, Trentin AG, Gomes FC. Thyroid hormone and astroglia: endocrine control of the neural environment. J Neuroendocrinol. 2015;27:435–445. doi: 10.1111/jne.12283. [DOI] [PubMed] [Google Scholar]
- 22.Dickson DW, Baker M, Rademakers R. Common variant in GRN is a genetic risk factor for hippocampal sclerosis in the elderly. Neurodegener Dis. 2010;7:170–174. doi: 10.1159/000289231. [DOI] [PMC free article] [PubMed] [Google Scholar]
- 23.Dickson DW, Davies P, Bevona C, et al. Hippocampal sclerosis: a common pathological feature of dementia in very old (>or = 80 years of age) humans. Acta Neuropathol. 1994;88:212–221. doi: 10.1007/BF00293396. [DOI] [PubMed] [Google Scholar]
- 24.Dickson DW, Rademakers R, Nicholson AM, et al. The TMEM106B locus and TDP-43 pathology in older persons without FTLD. Neurology. 2015;85:1354–1355. doi: 10.1212/01.wnl.0000472918.79256.a9. [DOI] [PMC free article] [PubMed] [Google Scholar]
- 25.Dutra JR, Cortes EP, Vonsattel JP. Update on Hippocampal Sclerosis. Curr Neurol Neurosci Rep. 2015;15 doi: 10.1007/s11910-015-0592-7. Epub online. [DOI] [PubMed] [Google Scholar]
- 26.Fujita A, Kurachi Y. Molecular aspects of ATP-sensitive K+ channels in the cardiovascular system and K+ channel openers. Pharmacol Ther. 2000;85:39–53. doi: 10.1016/s0163-7258(99)00050-9. [DOI] [PubMed] [Google Scholar]
- 27.Furney SJ, Simmons A, Breen G, et al. Genome-wide association with MRI atrophy measures as a quantitative trait locus for Alzheimer's disease. Mol Psychiatry. 2011;16:1130–1138. doi: 10.1038/mp.2010.123. [DOI] [PMC free article] [PubMed] [Google Scholar]
- 28.Gil-Ibanez P, Garcia-Garcia F, Dopazo J, Bernal J, Morte B. Global Transcriptome Analysis of Primary Cerebrocortical Cells: Identification of Genes Regulated by Triiodothyronine in Specific Cell Types. Cereb Cortex. 2015 doi: 10.1093/cercor/bhv273. EPub ahead of print. [DOI] [PubMed] [Google Scholar]
- 29.Hatanpaa KJ, Raisanen JM, Herndon E, et al. Hippocampal sclerosis in dementia, epilepsy, and ischemic injury: differential vulnerability of hippocampal subfields. J Neuropath Exp Neurol. 2014;73:136–142. doi: 10.1097/OPX.0000000000000170. [DOI] [PMC free article] [PubMed] [Google Scholar]
- 30.Hernandez DG, Nalls MA, Moore M, et al. Integration of GWAS SNPs and tissue specific expression profiling reveal discrete eQTLs for human traits in blood and brain. Neurobiol Dis. 2012;47:20–28. doi: 10.1016/j.nbd.2012.03.020. [DOI] [PMC free article] [PubMed] [Google Scholar]
- 31.Hibar DP, Stein JL, Renteria ME, et al. Common genetic variants influence human subcortical brain structures. Nature. 2015;520:224–229. doi: 10.1038/nature14101. [DOI] [PMC free article] [PubMed] [Google Scholar]
- 32.Hollingworth P, Harold D, Sims R, et al. Common variants at ABCA7, MS4A6A/MS4A4E, EPHA1, CD33 and CD2AP are associated with Alzheimer's disease. Nat Genet. 2011;43:429–435. doi: 10.1038/ng.803. [DOI] [PMC free article] [PubMed] [Google Scholar]
- 33.Ighodaro ET, Abner EL, Fardo DW, et al. Risk factors and global cognitive status related to brain arteriolosclerosis in elderly individuals. J Cereb Blood Flow Metab. 2016 doi: 10.1177/0271678X15621574. Now E-published; available on PubMed. [DOI] [PMC free article] [PubMed] [Google Scholar]
- 34.Ighodaro ET, Jicha GA, Schmitt FA, et al. Hippocampal Sclerosis of Aging Can Be Segmental: Two Cases and Review of the Literature. Journal of neuropathology and experimental neurology. 2015;74:642–652. doi: 10.1097/NEN.0000000000000204. [DOI] [PMC free article] [PubMed] [Google Scholar]
- 35.Jack CR, Jr, Bernstein MA, Fox NC, et al. The Alzheimer's Disease Neuroimaging Initiative (ADNI): MRI methods. Journal of magnetic resonance imaging : JMRI. 2008;27:685–691. doi: 10.1002/jmri.21049. [DOI] [PMC free article] [PubMed] [Google Scholar]
- 36.Jackson K, Barisone GA, Diaz E, et al. Amylin deposition in the brain: A second amyloid in Alzheimer disease? Annals of neurology. 2013;74:517–526. doi: 10.1002/ana.23956. [DOI] [PMC free article] [PubMed] [Google Scholar]
- 37.Jansen J, Friesema EC, Milici C, Visser TJ. Thyroid hormone transporters in health and disease. Thyroid. 2005;15:757–768. doi: 10.1089/thy.2005.15.757. [DOI] [PubMed] [Google Scholar]
- 38.Johansson P, Almqvist EG, Johansson JO, et al. Reduced cerebrospinal fluid level of thyroxine in patients with Alzheimer's disease. Psychoneuroendocrinology. 2013;38:1058–1066. doi: 10.1016/j.psyneuen.2012.10.012. [DOI] [PubMed] [Google Scholar]
- 39.Kalmijn S, Mehta KM, Pols HA, et al. Subclinical hyperthyroidism and the risk of dementia. The Rotterdam study. Clin Endocrinol (Oxf) 2000;53:733–737. doi: 10.1046/j.1365-2265.2000.01146.x. [DOI] [PubMed] [Google Scholar]
- 40.Keage HA, Hunter S, Matthews FE, et al. TDP-43 pathology in the population: prevalence and associations with dementia and age. J Alzheimers Dis. 2014;42:641–650. doi: 10.3233/JAD-132351. [DOI] [PubMed] [Google Scholar]
- 41.Kirsch T, Wellner M, Luft FC, Haller H, Lippoldt A. Altered gene expression in cerebral capillaries of stroke-prone spontaneously hypertensive rats. Brain research. 2001;910:106–115. doi: 10.1016/s0006-8993(01)02670-1. [DOI] [PubMed] [Google Scholar]
- 42.Koibuchi N. The role of thyroid hormone on functional organization in the cerebellum. Cerebellum. 2013;12:304–306. doi: 10.1007/s12311-012-0437-8. [DOI] [PubMed] [Google Scholar]
- 43.Kotrotsou A, Schneider JA, Bennett DA, et al. Neuropathologic correlates of regional brain volumes in a community cohort of older adults. Neurobiology of aging. 2015;36:2798–2805. doi: 10.1016/j.neurobiolaging.2015.06.025. [DOI] [PMC free article] [PubMed] [Google Scholar]
- 44.Lambert JC, Ibrahim-Verbaas CA, Harold D, et al. Meta-analysis of 74,046 individuals identifies 11 new susceptibility loci for Alzheimer's disease. Nat Genet. 2013;45:1452–1458. doi: 10.1038/ng.2802. [DOI] [PMC free article] [PubMed] [Google Scholar]
- 45.Lee EB, Lee VM, Trojanowski JQ, Neumann M. TDP-43 immunoreactivity in anoxic, ischemic and neoplastic lesions of the central nervous system. Acta Neuropathol. 2008;115:305–311. doi: 10.1007/s00401-007-0331-5. [DOI] [PubMed] [Google Scholar]
- 46.Leon Guerrero CR, Pathak S, Grange DK, et al. Neurologic and neuroimaging manifestations of Cantu syndrome: A case series. Neurology. 2016;87:270–276. doi: 10.1212/WNL.0000000000002861. [DOI] [PMC free article] [PubMed] [Google Scholar]
- 47.Leverenz JB, Agustin CM, Tsuang D, et al. Clinical and neuropathological characteristics of hippocampal sclerosis: a community-based study. Archives of neurology. 2002;59:1099–1106. doi: 10.1001/archneur.59.7.1099. [DOI] [PubMed] [Google Scholar]
- 48.Lin WL, Castanedes-Casey M, Dickson DW. Transactivation response DNA-binding protein 43 microvasculopathy in frontotemporal degeneration and familial Lewy body disease. Journal of neuropathology and experimental neurology. 2009;68:1167–1176. doi: 10.1097/NEN.0b013e3181baacec. [DOI] [PMC free article] [PubMed] [Google Scholar]
- 49.Machiela MJ, Chanock SJ. LDlink: a web-based application for exploring population-specific haplotype structure and linking correlated alleles of possible functional variants. Bioinformatics. 2015;31:3555–3557. doi: 10.1093/bioinformatics/btv402. [DOI] [PMC free article] [PubMed] [Google Scholar]
- 50.Mafrica F, Fodale V. Thyroid function, Alzheimer's disease and postoperative cognitive dysfunction: a tale of dangerous liaisons? J Alzheimers Dis. 2008;14:95–105. doi: 10.3233/jad-2008-14109. [DOI] [PubMed] [Google Scholar]
- 51.Manzano J, Bernal J, Morte B. Influence of thyroid hormones on maturation of rat cerebellar astrocytes. Int J Dev Neurosci. 2007;25:171–179. doi: 10.1016/j.ijdevneu.2007.01.003. [DOI] [PubMed] [Google Scholar]
- 52.Mayeux R, Lee JH, Romas SN, et al. Chromosome-12 mapping of late-onset Alzheimer disease among Caribbean Hispanics. Am J Hum Genet. 2002;70:237–243. doi: 10.1086/324773. [DOI] [PMC free article] [PubMed] [Google Scholar]
- 53.Montine TJ, Phelps CH, Beach TG, et al. National Institute on Aging-Alzheimer's Association guidelines for the neuropathologic assessment of Alzheimer's disease: a practical approach. Acta Neuropathol. 2012;123:1–11. doi: 10.1007/s00401-011-0910-3. [DOI] [PMC free article] [PubMed] [Google Scholar]
- 54.Moon JH. Endocrine Risk Factors for Cognitive Impairment. Endocrinol Metab (Seoul) 2016;31:185–192. doi: 10.3803/EnM.2016.31.2.185. [DOI] [PMC free article] [PubMed] [Google Scholar]
- 55.Morte B, Bernal J. Thyroid hormone action: astrocyte-neuron communication. Front Endocrinol (Lausanne) 2014;5:1–5. doi: 10.3389/fendo.2014.00082. [DOI] [PMC free article] [PubMed] [Google Scholar]
- 56.Mullur R, Liu YY, Brent GA. Thyroid hormone regulation of metabolism. Physiol Rev. 2014;94:355–382. doi: 10.1152/physrev.00030.2013. [DOI] [PMC free article] [PubMed] [Google Scholar]
- 57.Murray ME, Cannon A, Graff-Radford NR, et al. Differential clinicopathologic and genetic features of late-onset amnestic dementias. Acta Neuropathol. 2014;128:411–421. doi: 10.1007/s00401-014-1302-2. [DOI] [PMC free article] [PubMed] [Google Scholar]
- 58.Nag S, Yu L, Capuano AW, et al. Hippocampal sclerosis and TDP-43 pathology in aging and Alzheimer disease. Annals of neurology. 2015;77:942–952. doi: 10.1002/ana.24388. [DOI] [PMC free article] [PubMed] [Google Scholar]
- 59.Naj AC, Jun G, Beecham GW, et al. Common variants at MS4A4/MS4A6E, CD2AP, CD33 and EPHA1 are associated with late-onset Alzheimer's disease. Nat Genet. 2011;43:436–441. doi: 10.1038/ng.801. [DOI] [PMC free article] [PubMed] [Google Scholar]
- 60.Nelson PT, Abner EL, Schmitt FA, et al. Modeling the association between 43 different clinical and pathological variables and the severity of cognitive impairment in a large autopsy cohort of elderly persons. Brain Pathol. 2010;20:66–79. doi: 10.1111/j.1750-3639.2008.00244.x. [DOI] [PMC free article] [PubMed] [Google Scholar]
- 61.Nelson PT, Estus S, Abner EL, et al. ABCC9 gene polymorphism is associated with hippocampal sclerosis of aging pathology. Acta Neuropathol. 2014;127:825–843. doi: 10.1007/s00401-014-1282-2. [DOI] [PMC free article] [PubMed] [Google Scholar]
- 62.Nelson PT, Jicha GA, Schmitt FA, et al. Clinicopathologic correlations in a large Alzheimer disease center autopsy cohort: neuritic plaques and neurofibrillary tangles "do count" when staging disease severity. Journal of neuropathology and experimental neurology. 2007;66:1136–1146. doi: 10.1097/nen.0b013e31815c5efb. [DOI] [PMC free article] [PubMed] [Google Scholar]
- 63.Nelson PT, Jicha GA, Wang WX, et al. ABCC9/SUR2 in the brain: Implications for hippocampal sclerosis of aging and a potential therapeutic target. Ageing Res Rev. 2015;24:111–125. doi: 10.1016/j.arr.2015.07.007. [DOI] [PMC free article] [PubMed] [Google Scholar]
- 64.Nelson PT, Schmitt FA, Lin Y, et al. Hippocampal sclerosis in advanced age: clinical and pathological features. Brain. 2011;134:1506–1518. doi: 10.1093/brain/awr053. [DOI] [PMC free article] [PubMed] [Google Scholar]
- 65.Nelson PT, Smith CD, Abner EL, et al. Hippocampal sclerosis of aging, a prevalent and high-morbidity brain disease. Acta Neuropathol. 2013;126:161–177. doi: 10.1007/s00401-013-1154-1. [DOI] [PMC free article] [PubMed] [Google Scholar]
- 66.Nelson PT, Trojanowski JQ, Abner EL, et al. "New Old Pathologies": AD, PART, and Cerebral Age-Related TDP-43 With Sclerosis (CARTS) Journal of neuropathology and experimental neurology. 2016;75:482–498. doi: 10.1093/jnen/nlw033. [DOI] [PMC free article] [PubMed] [Google Scholar]
- 67.Nelson PT, Wang WX, Partch AB, et al. Reassessment of risk genotypes (GRN, TMEM106B, and ABCC9 variants) associated with hippocampal sclerosis of aging pathology. Journal of neuropathology and experimental neurology. 2015;74:75–84. doi: 10.1097/NEN.0000000000000151. [DOI] [PMC free article] [PubMed] [Google Scholar]
- 68.Neltner JH, Abner EL, Baker S, et al. Arteriolosclerosis that affects multiple brain regions is linked to hippocampal sclerosis of ageing. Brain. 2014;137:255–267. doi: 10.1093/brain/awt318. [DOI] [PMC free article] [PubMed] [Google Scholar]
- 69.Neltner JH, Abner EL, Jicha GA, et al. Brain pathologies in extreme old age. Neurobiology of aging. 2016;37:1–11. doi: 10.1016/j.neurobiolaging.2015.10.009. [DOI] [PMC free article] [PubMed] [Google Scholar]
- 70.Neumann M, Sampathu DM, Kwong LK, et al. Ubiquitinated TDP-43 in frontotemporal lobar degeneration and amyotrophic lateral sclerosis. Science. 2006;314:130–133. doi: 10.1126/science.1134108. [DOI] [PubMed] [Google Scholar]
- 71.Nho K, Corneveaux JJ, Kim S, et al. Whole-exome sequencing and imaging genetics identify functional variants for rate of change in hippocampal volume in mild cognitive impairment. Mol Psychiatry. 2013;18:781–787. doi: 10.1038/mp.2013.24. [DOI] [PMC free article] [PubMed] [Google Scholar]
- 72.Nho K, Kim S, Risacher SL, et al. Protective variant for hippocampal atrophy identified by whole exome sequencing. Annals of neurology. 2015;77:547–552. doi: 10.1002/ana.24349. [DOI] [PMC free article] [PubMed] [Google Scholar]
- 73.Nho K, Saykin AJ, Nelson PT Disease Neuroimaging Initiative As. Hippocampal Sclerosis of Aging, a Common Alzheimer's Disease 'Mimic': Risk Genotypes are Associated with Brain Atrophy Outside the Temporal Lobe. J Alzheimers Dis. 2016;52:373–383. doi: 10.3233/JAD-160077. [DOI] [PMC free article] [PubMed] [Google Scholar]
- 74.Pao WC, Dickson DW, Crook JE, et al. Hippocampal sclerosis in the elderly: genetic and pathologic findings, some mimicking Alzheimer disease clinically. Alzheimer disease and associated disorders. 2011;25:364–368. doi: 10.1097/WAD.0b013e31820f8f50. [DOI] [PMC free article] [PubMed] [Google Scholar]
- 75.Pericak-Vance MA, Bass MP, Yamaoka LH, et al. Complete genomic screen in late-onset familial Alzheimer disease. Evidence for a new locus on chromosome 12. JAMA. 1997;278:1237–1241. [PubMed] [Google Scholar]
- 76.Ramasamy A, Trabzuni D, Guelfi S, et al. Genetic variability in the regulation of gene expression in ten regions of the human brain. Nat Neurosci. 2014;17:1418–1428. doi: 10.1038/nn.3801. [DOI] [PMC free article] [PubMed] [Google Scholar]
- 77.Riley KP, Snowdon DA, Markesbery WR. Alzheimer's neurofibrillary pathology and the spectrum of cognitive function: findings from the Nun Study. Annals of neurology. 2002;51:567–577. doi: 10.1002/ana.10161. [DOI] [PubMed] [Google Scholar]
- 78.Risacher SL, Shen L, West JD, et al. Longitudinal MRI atrophy biomarkers: relationship to conversion in the ADNI cohort. Neurobiology of aging. 2010;31:1401–1418. doi: 10.1016/j.neurobiolaging.2010.04.029. [DOI] [PMC free article] [PubMed] [Google Scholar]
- 79.Rogaeva E, Premkumar S, Song Y, et al. Evidence for an Alzheimer disease susceptibility locus on chromosome 12 and for further locus heterogeneity. JAMA. 1998;280:614–618. doi: 10.1001/jama.280.7.614. [DOI] [PubMed] [Google Scholar]
- 80.Roostaei T, Nazeri A, Felsky D, et al. Genome-wide interaction study of brain beta-amyloid burden and cognitive impairment in Alzheimer's disease. Mol Psychiatry. 2016 doi: 10.1038/mp.2016.35. Epub. [DOI] [PMC free article] [PubMed] [Google Scholar]
- 81.Rosman NP. The neuropathology of congenital hypothyroidism. Adv Exp Med Biol. 1972;30:337–366. [PubMed] [Google Scholar]
- 82.Sampaolo S, Campos-Barros A, Mazziotti G, et al. Increased cerebrospinal fluid levels of 3,3',5'-triiodothyronine in patients with Alzheimer's disease. J Clin Endocrinol Metab. 2005;90:198–202. doi: 10.1210/jc.2004-1083. [DOI] [PubMed] [Google Scholar]
- 83.Schmitt FA, Nelson PT, Abner E, et al. University of Kentucky Sanders-Brown Healthy Brain Aging Volunteers: Donor Characteristics, Procedures, and Neuropathology. Curr Alzheimer Res. 2012;9:724–733. doi: 10.2174/156720512801322591. [DOI] [PMC free article] [PubMed] [Google Scholar]
- 84.Scott WK, Grubber JM, Abou-Donia SM, et al. Further evidence linking late-onset Alzheimer disease with chromosome 12. JAMA. 1999;281:513–514. doi: 10.1001/jama.281.6.513. [DOI] [PubMed] [Google Scholar]
- 85.Scott WK, Grubber JM, Conneally PM, et al. Fine mapping of the chromosome 12 late-onset Alzheimer disease locus: potential genetic and phenotypic heterogeneity. Am J Hum Genet. 2000;66:922–932. doi: 10.1086/302828. [DOI] [PMC free article] [PubMed] [Google Scholar]
- 86.Shabalin AA. Matrix eQTL: ultra fast eQTL analysis via large matrix operations. Bioinformatics. 2012;28:1353–1358. doi: 10.1093/bioinformatics/bts163. [DOI] [PMC free article] [PubMed] [Google Scholar]
- 87.Sjoberg S, Eriksson M, Nordin C. L-thyroxine treatment and neurotransmitter levels in the cerebrospinal fluid of hypothyroid patients: a pilot study. Eur J Endocrinol. 1998;139:493–497. doi: 10.1530/eje.0.1390493. [DOI] [PubMed] [Google Scholar]
- 88.Sjoberg S, Eriksson M, Werner S, Bjellerup P, Nordin C. L-thyroxine treatment in primary hypothyroidism does not increase the content of free triiodothyronine in cerebrospinal fluid: a pilot study. Scand J Clin Lab Invest. 2011;71:63–67. doi: 10.3109/00365513.2010.541931. [DOI] [PubMed] [Google Scholar]
- 89.Tajada S, Cidad P, Moreno-Dominguez A, Perez-Garcia MT, Lopez-Lopez JR. High blood pressure associates with the remodelling of inward rectifier K+ channels in mice mesenteric vascular smooth muscle cells. J Physiol. 2012;590:6075–6091. doi: 10.1113/jphysiol.2012.236190. [DOI] [PMC free article] [PubMed] [Google Scholar]
- 90.Tan ZS, Vasan RS. Thyroid function and Alzheimer's disease. J Alzheimers Dis. 2009;16:503–507. doi: 10.3233/JAD-2009-0991. [DOI] [PubMed] [Google Scholar]
- 91.Team RC. V. Foundation for Statistical Computing. Austria: 2016. R: A language and environment for statistical computing. (Ed.) [Google Scholar]
- 92.Trabzuni D, Ryten M, Walker R, et al. Quality control parameters on a large dataset of regionally dissected human control brains for whole genome expression studies. Journal of neurochemistry. 2011;119:275–282. doi: 10.1111/j.1471-4159.2011.07432.x. [DOI] [PMC free article] [PubMed] [Google Scholar]
- 93.Trentin AG. Thyroid hormone and astrocyte morphogenesis. J Endocrinol. 2006;189:189–197. doi: 10.1677/joe.1.06680. [DOI] [PubMed] [Google Scholar]
- 94.Troncoso JC, Kawas CH, Chang CK, Folstein MF, Hedreen JC. Lack of association of the apoE4 allele with hippocampal sclerosis dementia. Neuroscience letters. 1996;204:138–140. doi: 10.1016/0304-3940(96)12331-4. [DOI] [PubMed] [Google Scholar]
- 95.Visser WE, Friesema EC, Jansen J, Visser TJ. Thyroid hormone transport in and out of cells. Trends Endocrinol Metab. 2008;19:50–56. doi: 10.1016/j.tem.2007.11.003. [DOI] [PubMed] [Google Scholar]
- 96.Walker AK, Daniels CM, Goldman JE, et al. Astrocytic TDP-43 pathology in Alexander disease. J Neurosci. 2014;34:6448–6458. doi: 10.1523/JNEUROSCI.0248-14.2014. [DOI] [PMC free article] [PubMed] [Google Scholar]
- 97.Wilson RS, Yu L, Trojanowski JQ, et al. TDP-43 pathology, cognitive decline, and dementia in old age. JAMA neurology. 2013;70:1418–1424. doi: 10.1001/jamaneurol.2013.3961. [DOI] [PMC free article] [PubMed] [Google Scholar]
- 98.Wolf DS, Gearing M, Snowdon DA, et al. Progression of regional neuropathology in Alzheimer disease and normal elderly: findings from the Nun study. Alzheimer disease and associated disorders. 1999;13:226–231. doi: 10.1097/00002093-199910000-00009. [DOI] [PubMed] [Google Scholar]
- 99.Wu WS, Holmans P, Wavrant-DeVrieze F, et al. Genetic studies on chromosome 12. JAMA. 1998;280:619–622. doi: 10.1001/jama.280.7.619. [DOI] [PubMed] [Google Scholar]
- 100.Zarow C, Sitzer TE, Chui HC. Understanding hippocampal sclerosis in the elderly: epidemiology, characterization, and diagnostic issues. Curr Neurol Neurosci Rep. 2008;8:363–370. doi: 10.1007/s11910-008-0057-3. [DOI] [PubMed] [Google Scholar]
- 101.Zarow C, Weiner MW, Ellis WG, Chui HC. Prevalence, laterality, and comorbidity of hippocampal sclerosis in an autopsy sample. Brain Behav. 2012;2:435–442. doi: 10.1002/brb3.66. [DOI] [PMC free article] [PubMed] [Google Scholar]
- 102.Zhang Y, Chen K, Sloan SA, et al. An RNA-sequencing transcriptome and splicing database of glia, neurons, and vascular cells of the cerebral cortex. J Neurosci. 2014;34:11929–11947. doi: 10.1523/JNEUROSCI.1860-14.2014. [DOI] [PMC free article] [PubMed] [Google Scholar]
- 103.Zou F, Chai HS, Younkin CS, et al. Brain expression genome-wide association study (eGWAS) identifies human disease-associated variants. PLoS Genet. 2012;8:e1002707. doi: 10.1371/journal.pgen.1002707. (Epub) [DOI] [PMC free article] [PubMed] [Google Scholar]
Associated Data
This section collects any data citations, data availability statements, or supplementary materials included in this article.