

Abstract
Upon activation, T cells require energy for growth, proliferation and function. Effector T cells (Teff), such as Th1 and Th17, utilize high levels of glucose uptake and glycolysis to fuel proliferation and function. In contrast, Treg instead require oxidative metabolism to fuel suppressive function. It remains unknown how Teff/Treg metabolism is altered in settings of malnutrition, when nutrients are limited and circulating leptin levels are low. We therefore examined the role of malnutrition and associated hypoleptinemia on Teff versus Treg. We found that both malnutrition-associated hypoleptinemia and T cell-specific leptin receptor knockout suppressed Teff number, function, and glucose metabolism, but did not alter Treg metabolism or suppressive function. Using the autoimmune model EAE, we confirmed that fasting-induced hypoleptinemia altered Teff, but not Treg, glucose metabolism and function in vivo, leading to decreased disease severity. To explore potential mechanisms, we examined HIF-1α, a key regulator of Th17 differentiation and Teff glucose metabolism, and found HIF-1α expression was decreased in T cell-specific leptin receptor knockout Th17 cells, and in Teff cells from fasted EAE mice, but was unchanged in Treg. Altogether, these data demonstrate a selective, cell-intrinsic requirement for leptin to upregulate glucose metabolism and maintain function in Teff, but not Treg.
Keywords: leptin, malnutrition, Th17, Treg, glucose metabolism, HIF-1α, experimental autoimmune encephalomyelitis (EAE)
Introduction
Upon activation, CD4+ T cells need to rapidly grow, divide, and produce cytokines to mount an immune response. CD4+ T cells also differentiate into distinct subtypes that have unique roles in immunity. Effector CD4+ T cells (Teff), such as Th1 and Th17, drive the immune response through secretion of inflammatory cytokines, while regulatory T cells (Treg) suppress effector responses to inhibit autoimmunity [1]. The balance between Teff and Treg is critical to provide normal immunity without excessive inflammation and autoimmunity. Th17, in particular, are highly pro-inflammatory and contribute to many autoimmune diseases including multiple sclerosis (MS) in humans and the mouse model of experimental autoimmune encephalomyelitis (EAE) [2, 3]. Additionally, non-classic Th17-derived Th1 cells play a key role in chronic inflammatory disorders and autoimmunity [4]. A proper balance between Th1, Th17 and Treg subsets is crucial to prevent these and other autoimmune diseases [5].
It is now appreciated that T cell metabolism is directly linked to T cell function [6–12]. Teff, including Th1 and Th17, require large amounts of glucose for aerobic glycolysis, which fuels T cell function, and produces biosynthetic precursors for cell growth and division [10, 11, 13]. Activated Teff primarily take up glucose via the glucose transporter Glut1. Glut1 expression has been shown to be critical for Teff glucose metabolism, proliferation, and inflammatory cytokine production [7]. Interestingly, Treg do not require Glut1 and instead utilize oxidative metabolism for energy and suppressive function [7, 10, 12, 14, 15]. While these findings clarify the metabolic needs of distinct CD4+ T helper subsets, it remains unclear how CD4+ T cell differentiation and subset metabolism are affected in malnutrition when nutrients are limited.
The adipocyte-secreted hormone leptin provides a link between nutritional status and immunity [16–18]. Leptin is secreted in proportion to adipocyte mass and is therefore decreased in malnutrition [16]. While leptin is well-described to regulate food intake, energy expenditure and body weight, leptin has also been shown to play a critical role in regulating immunity and functions as a pro-inflammatory cytokine [18, 19]. Low levels of leptin are associated with high rates of death from infectious diseases [16]. In a recent study of childhood malnutrition, low circulating leptin levels were found to be the single most important biomarker to predict mortality in malnourished Ugandan infants [20]. We and others have demonstrated that leptin deficiency and fasting-induced hypoleptinemia have dramatic effects on T cells, including reduced T cell numbers, decreased Teff, increased Treg responses, and protection against certain forms of autoimmune disease [17, 18, 21–25]. With a few key exceptions [22, 26], most of the previous studies were limited because they described T cell subset alterations in whole body leptin and leptin receptor mutant animals. Since leptin is a pleiotropic hormone which can alter many different cells in addition to T cells, it is possible that some of the previously observed effects of leptin on T cell differentiation and function were mediated through indirect, cell-extrinsic mechanisms.
In our previous work, we found that leptin is required to upregulate CD4+ T cell glucose metabolism upon activation, but did not have any effect on naïve cells [17]. However, it remains unclear if leptin can differentially alter Teff versus Treg metabolism and thereby selectively alter cellular function upon activation. Because leptin is a pleiotropic hormone, we generated a T cell-specific leptin receptor knockout mouse to examine the direct effect of leptin on Teff/Treg differentiation and metabolism. We found that both fasting-induced hypoleptinemia and T cell-specific leptin receptor knockout led to decreased Teff number, glucose metabolism, and function. In contrast, Treg were preserved in the context of fasting and were unaffected by the presence of additional leptin or by T cell-specific leptin receptor knockout. To study the role of leptin and nutrition on Teff versus Treg metabolism and function in vivo, we used a mouse model of MS, experimental autoimmune encephalomyelitis (EAE). We found fasting-induced hypoleptinemia decreased IFN-γ and IL-17 production and expression of a key glycolytic enzyme in Th17 cells, but not Treg, from EAE mice; these findings correlated with protection against autoimmune disease, and were reversed with leptin injections. Lastly, to explore potential mechanisms of hypoleptinemia-induced Teff dysfunction, we examined HIF-1α, a key regulator of Th17 differentiation and Teff glucose metabolism [9]. We found leptin signaling increased expression of the glycolysis-promoting transcription factor HIF-1α in Th17 cells, but not in Treg. Moreover, HIF-1α expression was decreased in Th1 and Th17 cells, but not Treg, from fasted EAE mice. These findings suggest that leptin signaling to promote glucose metabolism may be mediated, in part, by HIF-1α. Thus, leptin provides a key link between nutritional status and immunity by playing a selective cell-intrinsic role to promote glucose metabolism in Teff cells and drive inflammatory T cell responses.
Results
Fasting-induced hypoleptinemia suppresses Th17 viability and metabolism
Previous studies have shown that T cells express the full-length leptin receptor (ObR) and can respond to leptin [27]. While leptin has been implicated to promote effector Th1 and Th17 cells and suppress Foxp3-expressing Treg proliferation [21, 24, 28] the mechanism by which leptin exerts an effect on T cells has been uncertain. Here, we examined the role of leptin in Teff and Treg metabolism and differentiation. C57BL/6J mice were either fed ad libitum (control) or fasted for two days with or without twice daily leptin injections. The number of CD4+Foxp3− effector T cells (Teff) and CD4+Foxp3+ regulatory T cells (Treg) was examined ex vivo and Treg cells were found to be selectively preserved following fasting compared to non-Treg CD4+ T cells (Fig. 1A and B). This was largely due to reduced leptin levels, as leptin administration to fasted mice restored T cell numbers. Fasting also led to an increased percentage of CD4+Foxp3+ natural Treg in the T cell compartment and this increased percentage of Treg cells in fasted animals was unaffected by leptin administration (Fig. 1C).
Figure 1. Fasting-induced hypoleptinemia suppresses Teff, but not Treg, number.
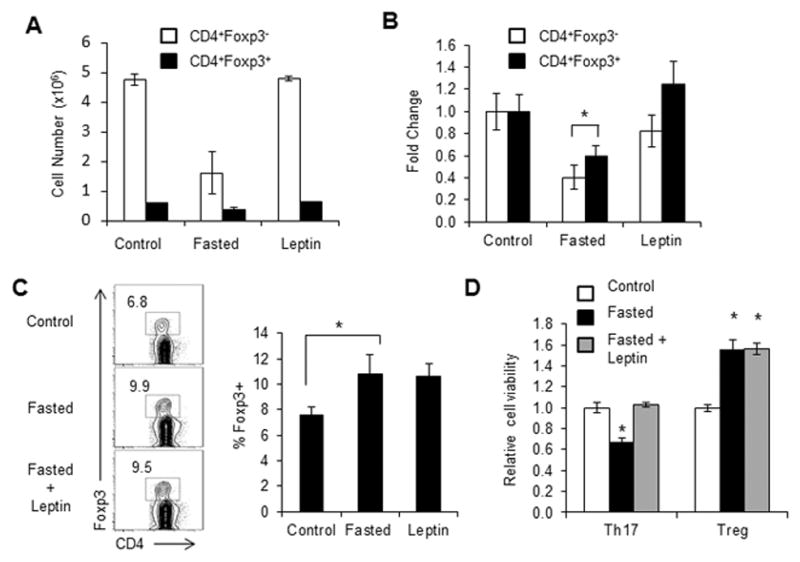
Wildtype C57BL/6J mice were fed ad libitum (control) or fasted for 48 hours (fasted). Fasted mice received twice daily injections of leptin or PBS. Control fed mice also received PBS injections. (A–B) The numbers of CD4+Foxp3+ and CD4+Foxp3− T cells from control or fasted mice or fasted mice given leptin injections were assessed by intracellular transcription factor staining using anti-Foxp3-PE. (A) Cell number and (B) relative fold change were compared. (C) Representative FACS plot of live CD4+ T cells stained for intracellular Foxp3. Quantified Foxp3 percentages are shown. (D) CD4+ T cells from control or fasted mice or fasted mice given leptin injections were polarized in vitro for 5 days to generate Th17 or Treg cells. Cell survival was determined by propidium iodide exclusion relative to T cells from fed controls. (A, B, D) Data are shown as mean ± SD of triplicate samples and are representative of 3 independent experiments. * indicates p < 0.05 by Student’s t-test.
We next examined Th17 and Treg differentiation following fasting. CD4+ T cells were isolated from fed control mice, or mice that had been fasted for 48 hours with or without leptin administration, and differentiated into Th17 or Treg in vitro, after which cell viability was measured. Th17 viability was reduced following fasting, but was restored in fasted mice receiving leptin injections (Fig. 1D). In contrast, in vitro differentiated Treg from fasted animals showed increased viability compared to Treg from fed control mice, and this increased viability of Treg in fasted animals was unchanged by the addition of leptin. Together, these data suggest that while Th17 cell numbers are altered by leptin levels, Treg remain unaffected.
Teff and Treg are known to have different metabolic profiles, which may alter Th17 and Treg survival following fasting [10, 11]. Teff rely on high levels of glucose uptake and glycolysis to drive Teff function, while Treg have been shown to instead rely on mitochondrial oxidation. We have previously shown that leptin promotes glucose metabolism in activated CD4+ T cells but does not affect naïve T cell metabolism [17]. Here, we examined the effects of leptin on effector versus regulatory T cell metabolism. Glucose metabolism was examined in Th17 and Treg cells from fasted mice versus ad libitum fed controls. Th17 cells from fed mice had a higher rate of glucose uptake and glycolysis compared to Treg, as described [12]. However, Th17 cells from fasted mice had significantly decreased levels of both glucose uptake and glycolytic rate compared to Th17 cells from fed controls (Fig. 2A and B). This defect in glucose metabolism seen in Th17 cells from fasted animals was reversed when fasted mice received leptin injections. In contrast, leptin administration had a modest effect to increase glucose uptake in Treg from fasted animals, but overall had little effect on Treg glycolytic rate and glucose metabolism.
Figure 2. Fasting-induced hypoleptinemia suppresses Th17, but not Treg, metabolism.

Wildtype C57BL/6J mice were fed ad libitum (control) or fasted for 48 hours (fasted). Fasted mice received twice daily injections of leptin or PBS. Control fed mice also received PBS injections. CD4+ T cells from control or fasted mice or fasted mice given leptin injections were polarized in vitro for 5 days to generate Th17 or Treg cells. (A) Glucose uptake and (B) glycolytic rate were assessed in Th17 and Treg. Data are shown as mean ± SD of triplicate samples and are representative of 3 independent experiments. (C–D) Extracellular acidification rates and basal oxygen consumption rates were measured using a Seahorse Extracellular Flux Analyzer in Th17 and Treg cells. Data are representative of two independent experiments. (E) Oxygen consumption rates were measured in Th17 cells in the presence or absence of glutamine. (F) Oxygen consumption rates coupled to ATP production were calculated in Th17 cells by measuring oxygen consumption before and after oligomycin treatment. Data are representative of two independent experiments. * indicates p < 0.05 by Student’s t-test.
Downstream of glucose uptake and glycolysis (conversion of glucose to pyruvate), glucose-derived pyruvate can either be converted to lactate and secreted or oxidized in the TCA cycle in the mitochondria. We therefore performed extracellular flux analysis in both Th17 and Treg from fed versus fasted animals and in fasting animals receiving leptin injections. We found a decrease in both extracellular acidification rate (ECAR; a surrogate marker of lactate production) and oxygen consumption (OCR; a surrogate marker of mitochondrial respiration) in Th17 cells from fasted animals compared to Th17 cells from fed controls (Fig. 2C and D). Treatment of fasted animals with twice daily leptin injections rescued the decreased ECAR and OCR levels observed in Th17 cells following fasting. Treg, however, showed equivalent levels of ECAR and OCR in cells from fed mice, fasted mice, and fasted mice treated with leptin (Fig. 2C and D).
As effector T cells are also known to increase glutamine oxidation upon activation, we examined OCR levels in Th17 cells from fed mice, fasted mice, and fasted mice treated with leptin following culture in the presence or absence of glutamine. We found that glutamine depletion led to reduced OCR in Th17 cells from fed control mice and in fasted mice treated with leptin, whereas reduced glutamine did not further alter the already lower OCR levels in Th17 cells from fasted animals (Fig. 2E). Lastly, we measured OCR levels in Th17 cells before and after treatment with the ATP synthase inhibitor oligomycin, in order to calculate the ATP production from mitochondrial oxidation of fuels, in fed versus fasted animals and in fasted animals treated with leptin. As suspected, mitochondrial ATP production was reduced in Th17 cells from fasted animals, and this reduction was reversed when fasted animals were treated with leptin (Fig. 2F). Altogether, these data demonstrate that Th17 cells from fasted animals have decreased viability, glycolytic metabolism, and mitochondrial respiration, which can be reversed with leptin injections, whereas Treg cell viability, glucose metabolism, and mitochondrial oxidation are not significantly altered by fasting or leptin.
Fasting-induced hypoleptinemia suppresses Th17, but not Treg, proliferation and function
Since fasting-induced hypoleptinemia led to selective alterations in Th17, but not Treg, viability and metabolism, we next sought to examine the effects of fasting and altered leptin levels on CD4+ T cell proliferation and differentiation. Previous studies have shown that whole body leptin-deficient and leptin receptor-deficient mouse mutants have decreased T cell proliferation [17]. We found that Th17 from fasted mice also had decreased cell proliferation, and this decrease was partially rescued by in vivo leptin administration (Fig. 3A). In contrast, Treg from fasted mice had similar or slightly elevated proliferation compared to Treg from fed animals, and proliferation did not significantly change in Treg from fasted mice receiving leptin injections.
Figure 3. Fasting-induced hypoleptinemia suppresses Th17, but not Treg, proliferation and function.

CD4+ T cells from control fed C57BL/6J mice, fasted mice, or fasted mice receiving twice daily leptin injections were isolated from spleen and polarized in vitro to generate Th17 or Treg cells. (A) Representative histograms of Th17 (CD4+IL-17+) and Treg (CD4+Foxp3+) cells that were labeled with CFSE on day 0 of polarization. Proliferation was measured by CFSE dilution after 3 days. (B) IL-17 production was measured in Th17 cells gated on live CD4+ T cells by intracellular flow cytometry using anti-IL-17-PE. (C and D) Treg differentiation and function was measured by (C) intracellular transcription factor staining for Foxp3 gated on live CD4+ T cells and (D) Representative histograms showing proliferation data from in vitro Treg suppression assay where CD8+ T cells were labeled with CFSE, cultured at a 1:1 ratio with Treg and then proliferation of live CD8+ T cells was measured by CFSE dilution after 3 days. All data are representative of 3 independent experiments.
We next examined Th17 and Treg function in fed versus fasted mice and in fasted mice receiving leptin injections. CD4+ T cells were isolated from these experimental groups and differentiated into Th17 and Treg in vitro. Th17 function, as measured by IL-17 production, was reduced following fasting and restored if the fasted animals received leptin injections in vivo, suggesting that hypoleptinemia suppresses Th17 (Fig. 3B). We also compared in vitro differentiated Th17 cells that were grown in culture in the presence of IL-2 versus IL-23 following in vitro differentiation, and found similar behavior in Th17 number, function, and metabolism from fed versus fasted animals and from fasted animals receiving leptin injections cultured with IL-2 or IL-23 (Supporting Information Fig. 1A and B). Treg differentiation and suppressive function were similar in both control fed and fasted conditions, with or without leptin administration (Fig. 3C and D). These data suggest that leptin promotes Th17 proliferation and differentiation or function, but has a smaller and less significant effect on Treg.
Because starvation represents a severe phenotype of malnutrition, which is associated with multiple systemic changes in hormone levels, we confirmed our findings on T cell metabolism and function in a model of chronic calorie restriction. Here, mice were either fed ad libitum or calorie-restricted to 50% of their usual daily intake for 2 weeks. The calorie-restricted mice lost approximately the same amount of weight as 48 hour fasting, and had decreased circulating leptin levels (Supporting Information Fig. 2A) [17]. IL-17 production in induced Th17 cells was decreased upon calorie-restriction whereas Treg differentiation was unaffected (Supporting Information Fig. 2B). These results were similar to those obtained following 48 hour fasting. Likewise, glucose uptake and the rate of glycolysis were suppressed in Th17 cells from calorie-restricted animals, but unchanged in Treg (Supporting Information Fig. 2C and D). Altogether, these data show that hypoleptinemia due to malnutrition through both short and long-term calorie restriction alters Th17 metabolism and function, whereas Treg, which are less glycolytic than Th17, are less susceptible to changes in nutritional status, as seen in both fasting and calorie restriction mouse models.
Leptin signaling specifically regulates Teff differentiation and function
Given the importance of leptin in rescuing Th17 metabolism and function in fasting, we next sought to examine the intrinsic role of leptin signaling in Th17 and Treg differentiation. A recent report demonstrated that Th17 cells from a T cell-specific leptin receptor knockout mouse showed reduced capacity for differentiation and decreased STAT3 activation [22]. Other previous reports have examined the role of leptin on T cell differentiation and function in the context of whole body leptin or leptin receptor deficiency [24, 29–31]. Since leptin is a pleiotropic hormone that may influence T cell development and function indirectly, we examined CD4+ T helper cell metabolism and function using a T cell-specific leptin receptor knockout mouse (CD4CreLepRF/F). CD4CreLepRF/F animals showed no developmental abnormalities, with similar CD4+ and CD8+ levels in the thymus and spleen (Supporting Information Fig. 3A). CD4+ T cells isolated from CD4CreLepRF/F mice also activated normally and expressed similar levels of the surface markers CD44, CD25 and CD69, compared to T cells from control mice (Supporting Information Fig. 3B).
To examine the effect of T cell-intrinsic leptin receptor deficiency on Teff function, T cells were isolated from CD4CreLepRF/F mice and in vitro differentiated into Th17 cells. In agreement with a recent study, differentiated Th17 cells from CD4CreLepRF/F mice produced a lower percentage of IL-17-producing cells compared to Th17 cells from control animals (Fig. 4A) [22]. The absolute number of IL-17 producing cells was also decreased in the CD4CreLepRF/F knockout animals (Fig. 4B). Th17 cells from CD4CreLepRF/F mice also expressed decreased levels of the Th17-associated transcription factor RORγt (Fig. 4C). These results confirm that T cell-intrinsic leptin receptor signaling directly regulates Th17 differentiation and function. Similar to Th17 cells, we also found that differentiated Th1 cells from CD4CreLepRF/F mice produced a lower percentage of IFN-γ-producing cells compared to Th1 cells from control animals (Supporting Information Fig. 3C).
Figure 4. T cell-specific leptin receptor knockout inhibits Th17, but not Treg, differentiation and function.

CD4+ T cells from CD4CreLepRF/F or littermate control mice were isolated from spleen and polarized in vitro for 5 days to generate Th17 or Treg cells. (A–C) Th17 differentiation and function were assessed by intracellular cytokine staining for (A) IL-17 production gated on live CD4+ T cells. (B) The number of IL-17 producing live CD4+ T cells was quantified. (C) Representative histogram of live CD4+ T cells stained for intracellular RORγt. (D–F) Treg differentiation and function were measured by (D) intracellular transcription factor staining for Foxp3 gated on live CD4+ T cells. (E) number of live CD4+Foxp3+ T cells was quantified. (F) Representative histograms showing proliferation data from in vitro Treg suppression assay where CD8 T cells were labeled with CFSE, cultured at a 1:1 ratio with Treg and then proliferation of live CD8+ T cells was measured by CFSE dilution after 3 days. All data are representative of 3 independent experiments. (B and E) Data are shown as mean ± SD of triplicate samples. * indicates p < 0.05 by Student’s t-test.
Next, we examined Treg differentiation and found that CD4CreLepRF/F T cells skewed in vitro with TGFβ had a higher percentage of Foxp3-expressing cells as compared to in vitro differentiated Treg cells from control mice (Fig. 4D). However, there was no difference in the absolute number of Foxp3-expressing Treg from CD4CreLepRF/F versus control mice (Fig. 4E). Treg from CD4CreLepRF/F mice also had similar suppressive capacity as Treg from control animals, as measured by an in vitro suppression assay (Fig. 4F). These findings suggest that non-Treg CD4+ T cells are selected against in leptin deficiency, and that leptin deficiency does not directly promote Treg number. Together, these data show that T cell-intrinsic leptin receptor signaling specifically promotes Teff differentiation and function whereas absolute Treg number and Treg function remained largely unaffected.
Leptin signaling regulates Teff glucose metabolism in a cell-intrinsic manner
To determine if fasting-induced changes in T cell glucose metabolism were due to T cell-intrinsic effects of leptin, CD4+ T cells from CD4CreLepRF/F or control mice were in vitro differentiated to Th17 or Treg and glucose metabolism was examined. RNA expression of both Glut1 and hexokinase 2 (HK2; the first enzyme in the glycolytic pathway) was decreased in Th17 from CD4CreLepRF/F mice compared to Th17 from control animals (Fig. 5A and B). RNA levels of Glut1 and HK2 were generally lower in Treg cells compared to Th17. Additionally, Glut1 and HK2 expression was unchanged in Treg from CD4CreLepRF/F mice compared to Treg from control animals. Similarly, protein levels of Glut1 were decreased in Th17 cells from CD4CreLepRF/F mice compared to Th17 cells from control animals and remained low in Treg (Fig. 5C), and glucose uptake was decreased in Th1 and Th17 cells from CD4CreLepRF/F mice (Fig. 5D and Supporting Information Fig. 3D). While glucose uptake was lower in Treg compared to Th17 from control animals, it was unchanged in Treg in the absence of T cell-specific leptin signal. We have previously shown that glycolysis is also decreased in Th17 cells from CD4CreLepRF/F mice, but unchanged in Treg cells from CD4CreLepRF/F mice [17], and did not repeat that here. Once glucose is taken up by the T cell and converted into pyruvate, it can be either converted into lactate or oxidized in the mitochondria. We therefore examined lactate production in Th17 and Treg cells from CD4CreLepRF/F and control mice, and found that Th17 cells lacking leptin receptor expression had slightly, albeit significantly, decreased production of lactate compared to Th17 cells from control mice (Fig. 5E). Treg produced lower lactate than Th17 cells, and Treg lactate production was unaffected by leptin receptor deficiency. These data suggest that leptin signaling directly regulates T cell metabolism through increased Glut1 expression, glucose uptake, and glucose metabolism in Th1 and Th17, but not Treg cells.
Figure 5. T cell-specific leptin receptor knockout inhibits Th17, but not Treg, glucose metabolism.

CD4+ T cells from CD4CreLepRF/F or littermate control mice were isolated from spleen and polarized in vitro for 5 days to generate Th17 or Treg cells. (A and B) RNA was isolated from Th17 and Treg to measure (A) Glut1 and (B) Hexokinase 2 (HK2) RNA levels relative to actin using the delta-delta Ct method. (C) Glut1 protein levels were measured by immunoblot. Glut1 is heavily glycosylated and appears as a smear. Bands were quantified relative to actin using ImageJ software and were normalized to the levels of control Th17 cells. Relative Glut1 protein expression, as normalized to actin, was averaged from three independent experiments. (D) Glucose uptake and (E) lactate production were measured in Th17 and Treg. All data are representative of 3 independent experiments. Data are shown as mean ± SD of triplicate samples. * indicates p < 0.05 by Student’s t-test.
Fasting-induced hypoleptinemia inhibits Th1 and Th17 function to alleviate EAE
It has been previously observed that fasting or calorie-restriction can inhibit autoimmune disease in EAE [32]. One possible mechanism for this is through lower levels of leptin. Indeed, leptin has been shown to increase EAE symptoms in both wildtype and leptin mutant ob/ob mice [33, 34], whereas leptin-neutralization can inhibit EAE [35]. The immune response observed in EAE is at least partly Th17-dependent, as RORγt and IL-17 knockout mice are resistant to EAE [36, 37]. Here, we examined the effect of fasting-induced hypoleptinemia on Th1, Th17, and Treg number, function, and metabolism in vivo, using an EAE mouse model. Mice were fed or fasted with or without leptin injections for 48 hours at the onset of EAE initiation and then remained fed ad libitum for the remainder of the experiment. Control mice received PBS injections of similar volume. Fasted mice had lower EAE clinical scores (less severe disease) and decreased CD4+ numbers compared to control fed animals (Fig. 6A and B). Additionally, mice that were fasted but received leptin injections during the fast had more severe disease than fasted mice that received PBS injections, demonstrating that leptin alone is able to reverse the protection against autoimmunity seen in fasting.
Figure 6. Fasting-induced hypoleptinemia protects against EAE by inhibiting Th17 metabolism and function.

EAE was induced in wildtype C57BL/6J mice that were fed ad libitum (control), fasted for 48 hours, or fasted while receiving twice daily leptin injections (13 mice per group). (A) Starting at day 9 post EAE-induction, mice were given thrice-weekly clinical disease scores, with higher numbers reflecting more severe disease as detailed in Materials and methods. (B) The number of live CD4+ T cells in the draining lymph nodes on day 9 was determined using flow cytometry. (C –E) The percentages of live (C) CD4+IFN-γ+, (D) CD4+IL-17+, and (E) CD4+Foxp3+ T cells in spleen and the draining lymph nodes (iLN) were determined by intracellular flow cytometry. (F) Intracellular staining for hexokinase 2 (HK2) in Th17 (CD4+IL-17+) and Treg (CD4+Foxp3+) from draining lymph nodes. The experiment was repeated 4 independent times. (A) Data was analyzed by two-way ANOVA. Data are shown as mean ± SD of 8 (B–E) or 5 (F) mice. * indicates p < 0.05 by Student’s t-test.
We also examined T cell function and metabolism in vivo in the EAE mouse model. T cells isolated from the spleen and draining lymph nodes of fasted mice on day 9 (during EAE onset) showed decreased levels of IL-17 production compared to T cells isolated from fed control mice, whereas T cells isolated from the draining lymph nodes (but not from spleen) of fasted mice showed decreased levels of IFN-γ production (Fig. 6C and D). Treatment of fasted mice with leptin was sufficient to rescue IL-17 and IFN-γ production, similar to what was seen in our in vitro studies. In contrast, there was an increase in the percentage of Foxp3-expressing Treg in splenic T cells from fasted mice, compared to fed mice in our EAE studies (Fig. 6E), and this was reversed when fasted mice received leptin injections. In the inguinal lymph nodes, the percentage of T cells expressing Foxp3 remained elevated in fasted mice treated with leptin. These data suggest that hypoleptinemia can inhibit Th1 and Th17 function in vivo while fasting itself leads to an increase in percentage of Treg.
To evaluate T cell glycolytic metabolism in EAE, T cells from mice undergoing EAE induction were examined for the expression of HK2, a critical enzyme in glucose metabolism that correlates to glucose uptake and glycolytic rates [10]. We examined Th17 (CD4+IL-17+) and Treg (CD4+Foxp3+) cells from fed mice, fasted mice, and fasted mice receiving leptin injections, in the EAE model. HK2 levels were generally higher in Th17 compared to Treg in control fed mice undergoing EAE induction, similar to what we noted previously in vitro (Fig. 6F). HK2 levels decreased in Th17 cells from fasted EAE mice compared to fed control EAE mice, and this decrease in HK2 expression in Th17 cells in fasting was reversed by leptin administration. In contrast, there was no statistical difference between HK2 levels in Treg cells from EAE mice that were fed, fasted, or fasted while receiving leptin injections. Altogether, these data suggest that fasting and associated hypoleptinemia inhibit Teff glucose metabolism, differentiation, and effector function, without affecting Treg metabolism and function in vivo.
Leptin signal regulates HIF-1α expression in Th17 cells, but not Treg
Leptin is known to promote PI3K/Akt/mTOR signaling in both T cells and other cell types [38]. We examined activated CD4+ T cells from fed versus fasted animals and from fasted animals receiving leptin injections, and found no difference in T cell activation of Akt, mTOR, or AMPK under these conditions (Supporting Information Fig. 4A). However, it is not known if the effects of leptin on signaling pathways are due to direct or indirect effects of leptin on T cells. We therefore examined the effect of T cell-intrinsic leptin signaling on PI3K/Akt/mTOR and AMP kinase (AMPK) activation in Th17 and Treg cells. Surprisingly, there was no change in phospho-Akt, phospho-mTOR, phospho-S6K, or phospho-AMPK in either Th17 or Treg from CD4CreLepRF/F mice compared to control littermates (Supporting Information Fig. 4B). Another signaling pathway important for Th17 metabolism and function is through the protein HIF-1α, which has been described as a critical regulator of RORγt expression and Th17 differentiation [39–42]. HIF-1α is also known to promote T cell glycolytic metabolism [9]. We therefore examined HIF-1α expression in the T cell-specific leptin receptor knockout. Compared to Th17 cells from control mice, and in agreement with previous studies [22], HIF-1α mRNA and protein expression were decreased in Th17 from CD4CreLepRF/F mice (Fig. 7A–C). The expression of HIF-1α was lower in Treg compared to Th17 cells from control animals, but was unaffected by the absence of leptin signal in Treg. We also examined HIF-1α levels in Th1, Th17, and Treg cells from fed mice, fasted mice, and fasted mice receiving leptin injections, in the EAE model. HIF-1α levels were significantly decreased in both Th1 and Th17 cells isolated from spleens from fasted EAE mice compared to fed control EAE mice, and this decrease in HIF-1α expression in Teff cells from fasted animals in EAE was reversed by leptin administration (Fig. 7D). In Treg, the expression of HIF-1α was about 3-fold lower than in Th1 and Th17 cells. In addition, there was a small but significant decrease in HIF-1α expression in Treg from fasted animals, but no change in HIF-1α expression in Treg when fasted animals were treated with leptin (Fig. 7D). In Th1 and Th17 cells isolated from draining lymph nodes, there were small changes in HIF-1α expression that did not reach statistical significance, and may therefore represent a timing issue (Supporting Information Fig. 4C). Altogether, these findings suggest that a key role of leptin in CD4+ T cells may be to regulate HIF-1α expression and thereby influence T cell glucose metabolism and Teff differentiation and function.
Figure 7. T cell-specific leptin receptor knockout Th17 cells have decreased HIF-1α expression.

CD4+ T cells from CD4CreLepRF/F or littermate control mice were isolated from spleen and polarized in vitro for 5 days to generate Th17 or Treg cells. (A) HIF-1α RNA levels were assessed by qPCR relative to actin using the delta-delta Ct method. (B and C) HIF-1α protein levels were assessed by immunoblotting. Bands were quantified relative to actin using ImageJ software and were normalized to the levels of control Th17 cells. All data are representative of 3 independent experiments. (D) EAE was induced in wildtype C57BL/6J mice that were fed ad libitum (control), fasted for 48 hours, or fasted while receiving twice daily leptin injections (leptin). Intracellular staining for HIF-1α was determined in Th1 (CD4+IFN-γ+), Th17 (CD4+IL-17+), and Treg (CD4+Foxp3+) cells (5 mice per group). (A, C, D) Data are shown as mean ± SD of triplicate samples. * indicates p < 0.05 by Student’s t-test.
Discussion
Whole body nutritional status can alter immune responses. Malnutrition is associated with immunosuppression and increased mortality from infection. In addition, malnutrition through fasting or calorie restriction has been found to protect against several forms of autoimmunity, including EAE [32, 43]. The adipocyte-secreted hormone leptin plays a key role in communicating nutrient status to the immune system and may therefore be a critical regulator of immunity during malnutrition. We and others have demonstrated previously that leptin is required for normal T cell function [17, 18, 24]. We show here that leptin augments Th1 and Th17, but not Treg, number and function directly through its ability to upregulate T cell glycolytic metabolism and thereby fuel Teff activation in the fed state.
In these studies, we examined the role of fasting induced-hypoleptinemia on Teff versus Treg function and metabolism in vivo in the context of EAE. Leptin deficiency induced by fasting led to a decrease in EAE disease severity, along with decreased IFN-γ and IL-17 production as well as decreased Teff glycolytic enzyme expression. These Teff defects were rescued when leptin was administered in vivo during the fast. In contrast, Treg numbers increased during the fast and remained elevated despite leptin injections, and Treg metabolic enzyme expression was unchanged. These data are in agreement with our in vitro findings in both fasting-induced hypoleptinemia and T cell-specific leptin receptor knockout mice.
While a role for leptin in T cells have been observed previously, it is important to note that many of those studies have been in the context of whole body leptin or leptin receptor deficiency, and given the pleiotropic effects of leptin, the cell-intrinsic role of leptin on differentiated CD4+ T cells has remained unclear. However, one recent study did show that T cell-specific leptin deficiency altered Th17 differentiation and inhibited STAT3 signaling [22], while another interesting study reported leptin can directly cooperate with IL-6 to promote Th17 differentiation in the context of a T cell-specific MAP4K4 deficiency, thereby altering insulin sensitivity [26]. Our study adds to those findings to show that leptin acts directly on effector Teff cells to promote glucose metabolism and thereby fuel effector function. But whereas T cell-specific leptin deficiency inhibits Teff differentiation, metabolism, and function, it has little effect on Treg. Previous studies that examined the role of leptin signaling on Treg using whole-body leptin and leptin receptor mutant animals have demonstrated increased Treg proliferation and function [28]. Using our T cell-specific leptin receptor knockout animal, we show that Treg metabolism and function are not significantly affected by intrinsic leptin deficiency. Although the percentage of Treg increases in this context, it is likely due to inhibition of the non-Treg compartment, as we observed that the absolute number of Treg remained constant in both fasting-induced hypoleptinemia and the T cell-specific leptin receptor knockout model.
We believe that the mechanism by which leptin intrinsically alters Teff versus Treg differentially is through its ability to alter T cell glucose metabolism. Our previous study suggests that leptin-mediated upregulation of glucose metabolism is critical during T cell activation, in part through upregulation of the glucose transporter Glut1. Moreover, transgenic expression of Glut1 rescued glucose metabolism and function in activated T cells from fasted mice [17]. Similarly, Teff cells express high levels of Glut1 and high rates of glucose uptake and glycolysis [7, 10, 12]. We show here that leptin plays a role in Teff to increase glucose metabolism and effector function. This role of leptin is cell-intrinsic, as specific deletion of leptin receptor in CD4+ T cells led to decreased Teff metabolism and function. We were also able to measure hexokinase 2 (HK2) levels as an in vivo measurement of glucose metabolism in the context of EAE. We found that Th17 cells had 4–5 fold higher levels of HK2 compared to Treg in fed control animals undergoing EAE induction. Moreover, HK2 levels were decreased in Th17 cells from fasted mice, but rescued when fasted mice received leptin injections. HK2 levels, however, remained low and largely unchanged in Treg cells from fed or fasted animals.
Recent studies have demonstrated that Treg do not utilize a glycolytic metabolic program [10–12]. Instead, Treg rely on an oxidative metabolism utilizing lipids and glucose through mitochondrial oxidation and have low levels of Glut1 and glucose uptake. In this way, Treg are metabolically more similar to naïve CD4+ T cells than inflammatory effector T cells. We observed here that Treg from fasted mice or from T cell-specific leptin receptor-deficient mice are metabolically and functionally similar to those of control mice. This is similar to what we have observed previously in naïve T cells [17], and suggests that leptin is not required for either resting T cell or Treg metabolism or function.
Leptin receptor expression is induced upon T cell activation [44] and signals through a variety of intracellular pathways including PI3K/Akt/mTOR, Jak/STAT and MAPK signaling [45]. The PI3K/Akt/mTOR pathway is also involved in T cell metabolism [9, 46]. Teff cells, including Th17, express mTOR complex 1 (mTORC1) while Treg have low levels of mTOR signaling [14]. In fact, PTEN-knockout Treg that are forced to utilize the PI3K/Akt/mTOR pathway are not functional in vitro or in vivo [47]. We examined members of this pathway, including Akt, mTOR, S6, 4EBP, and AMPK, and surprisingly did not find significant changes with T cell-specific leptin receptor deficiency in the conditions we examined. Therefore, the changes to the Akt/mTOR pathway seen in T cells from whole body leptin or leptin receptor knockout studies may have been due to indirect and cell-extrinsic influences.
Another signaling pathway critical for Th17 metabolism and function is the HIF-1α pathway [11, 48]. In T cells, HIF-1α has been found to promote Th17 differentiation. Although not important in early T cell activation, HIF-1α is selectively expressed in the Th17 subset and critical to upregulate glucose metabolism [11]. HIF-1α also modulates the balance between Th17 and Treg, as a T cell-specific HIF-1α knockout promoted Treg generation and inhibited IL-17 production, protecting against EAE in vivo [11], and recent studies support the important role for HIF-1α regulation in Th17 differentiation in inflammatory disorders [49]. HIF-1α can act directly to increase RORγt activity, bind to and degrade Foxp3, and also upregulate a variety of glucose metabolism genes [11, 48]. We found that cell-intrinsic leptin receptor deficiency led to an inhibition of HIF-1α expression at both the mRNA and protein level in Th17, but not Treg. In addition, HIF-1α levels were decreased in Th1 and Th17 cells isolated from mice undergoing EAE induction. The role of HIF-1α in Th1 in EAE is less clear than its role in Th17, but may be explained by the observation that non-classic Th17-derived Th1 cells play a key role in chronic inflammatory disorders and autoimmunity [4]. Altogether, HIF-1α signaling may contribute to the metabolic and functional defects seen in leptin-deficient Teff cells, and represents a mechanism by which leptin regulates Teff glucose metabolism, differentiation and function.
Materials and Methods
Mice
C57BL/6J mice (8–10 wks.) were purchased from The Jackson Laboratory (Bar Harbor, ME) and used for experiments unless otherwise specified. CD4CreLepR knockout mice were generated by crossing CD4-Cre transgenic mice with LepR floxed mice (Jackson Laboratory). For fasting studies, mice were deprived of food for 48 hours but allowed full access to water. Where specified, 1 μg/gram body weight recombinant leptin (R&D Systems, Minneapolis, MN) was injected intraperitoneally twice daily during the 48 hour fast. Control mice received PBS injections. All animal studies were approved by the Institutional Animal Care and Use Committee of Duke University, an institution accredited by the Association for Assessment and Accreditation of Laboratory Animal Care (AAALAC), International.
T cell differentiation
Splenic CD4+ T cells were purified by negative selection (Miltenyi Biotec, Auburn, CA) and differentiated into Th17 and Treg as previously described [12]. Briefly, T cells were cultured for 3 days in the presence of irradiated splenic feeder cells (3000 rad) with 2.5 μg/mL soluble anti-CD3. The following cytokines were added to each subset: Th17, 20 ng/mL IL-6 (R&D Systems), 2.5 ng/mL TGFβ (R&D Systems), 10 μg/mL anti-IFN-γ; Treg, 3 ng/mL TGFβ. Three days after stimulation, cells were split 1:2 and re-plated with IL-2 alone for an additional 2 days.
Flow cytometry
Proliferation was determined by staining T cells with CFSE (Invitrogen, Chicago, IL) before culture and analyzed by dilution of fluorescent dye flow cytometrically. Viability was determined by propidium iodide exclusion (PI; Invitrogen). Intracellular cytokines and transcription factors were measured as described previously [10]. Intracellular staining for hexokinase 2 (HK2; Abcam, ab131196, Cambridge, MA), Glut1 (Abcam, ab652), and HIF1-α (R&D Systems, MAB1536) required an additional 30 min incubation for secondary PE antibody (eBioscience, San Diego, CA). All flow cytometry was performed on a MACSQuant Analyzer (Miltenyi) and analyzed with FlowJo software (Tree Star, Ashland, OR).
Metabolic assays
The glycolytic flux and glucose uptake assays using 3H-glucose or 3H-deoxyglucose were performed as described previously [17]. Oxygen consumption rates (OCR) and extracellular acidification rates (ECAR) were measured with an extracellular flux analyzer (Seahorse Bioscience, North Billerica, MA).
Quantitative real-time PCR and Immunoblotting
mRNA was isolated from Th17 or Treg using the Qiagen kit and cDNA was synthesized using the iScript cDNA synthesis kit (BioRad, Hercules, CA). All samples were normalized to actin mRNA levels. For immunoblotting, cells were lysed as previously described [17]. The following antibodies were used: Glut1 (Abcam, ab652), HIF-1α (Cayman Chemical, Ann Arbor, MI), phospho-Akt, total Akt, phospho-mTOR, total mTOR, phospho-S6, total S6, phospho-AMPK, and total AMPK (Cell Signaling, Beverly, MA).
Treg suppression assay
Treg cells were differentiated as described above and cultured at a ratio of 1:1 with CFSE-labeled CD8+ T cells with irradiated splenic feeder cells (1:5 ratio) and 1 μg/mL soluble anti-CD3. Treg suppression of CD8+ T cell proliferation was determined 72 hours post-stimulation by CFSE dilution using flow cytometry.
Experimental Autoimmune Encephalomyelitis
EAE was induced as previously described [10, 50]. Briefly, wildtype C57BL/6J mice were injected s.c. with 100 ng MOG peptide (New England Peptide, Gardner, MA) mixed with Complete Freund’s Adjuvant (Sigma, St. Louis, MO) with 2 mg/mL heat-killed Mycobacterium tuberculosis followed by pertussis toxin (200 ng per mouse) administrated by i.p. injection on day 0 and 2. Where indicated, on day 0, mice were fasted for 48 hours and received twice daily leptin or PBS i.p injections. After 48 hours fasting, mice were allowed to feed ad libitum for the remainder of the experiment. Clinical signs of EAE were assessed according to the following disease scoring parameters: 0, no signs of disease; 1, loss of tone in the tail; 2, impaired righting reflex; 3, hindlimb paralysis; 4, tetraplegia/death. For T cell functional data, cells were isolated from the draining inguinal lymph nodes on day 9 post immunization.
Statistical Analysis
The data are presented as mean ± SD and were analyzed using a two-tailed student t test. Statistically significant results are indicated (* p < 0.05). For the EAE experiment, data was analyzed by two-way ANOVA with Prism software (GraphPad).
Supplementary Material
Acknowledgments
We thank Jeffrey Rathmell and members of the Rathmell laboratory for helpful discussion and review of data. This work was supported by the National Institutes of Health Grants K08-DK087944 (NJM) and R01-DK106090 (NJM), the Children’s Miracle Network (NJM), the American Association of Immunologists (VAG), and the National Multiple Sclerosis Society Research Grants RG-5333 (NJM) and RG-4536 (MLS).
Footnotes
Author Contributions
VAG and KD participated in the study design, carried out experiments, and drafted the manuscript. DCS, RK, AN, and WE performed several experiments. MLS participated in study design and reviewed the manuscript. NJM conceived of the study, coordinated the study design and drafted the manuscript. All authors have read and approved the final manuscript.
Conflict of Interest Statement
The authors declare no commercial or financial conflict of interest.
References
- 1.Zhu J, Yamane H, Paul WE. Differentiation of effector CD4 T cell populations (*) Annu Rev Immunol. 2010;28:445–489. doi: 10.1146/annurev-immunol-030409-101212. [DOI] [PMC free article] [PubMed] [Google Scholar]
- 2.Cua DJ, Sherlock J, Chen Y, Murphy CA, Joyce B, Seymour B, Lucian L, To W, Kwan S, Churakova T, Zurawski S, Wiekowski M, Lira SA, Gorman D, Kastelein RA, Sedgwick JD. Interleukin-23 rather than interleukin-12 is the critical cytokine for autoimmune inflammation of the brain. Nature. 2003;421:744–748. doi: 10.1038/nature01355. [DOI] [PubMed] [Google Scholar]
- 3.Korn T, Bettelli E, Oukka M, Kuchroo VK. IL-17 and Th17 Cells. Annu Rev Immunol. 2009;27:485–517. doi: 10.1146/annurev.immunol.021908.132710. [DOI] [PubMed] [Google Scholar]
- 4.Cosmi L, Liotta F, Maggi E, Romagnani S, Annunziato F. Th17 and non-classic Th1 cells in chronic inflammatory disorders: two sides of the same coin. Int Arch Allergy Immunol. 2014;164:171–177. doi: 10.1159/000363502. [DOI] [PubMed] [Google Scholar]
- 5.Eisenstein EM, Williams CB. The T(reg)/Th17 cell balance: a new paradigm for autoimmunity. Pediatr Res. 2009;65:26R–31R. doi: 10.1203/PDR.0b013e31819e76c7. [DOI] [PubMed] [Google Scholar]
- 6.Maciver NJ, Jacobs SR, Wieman HL, Wofford JA, Coloff JL, Rathmell JC. Glucose metabolism in lymphocytes is a regulated process with significant effects on immune cell function and survival. J Leukoc Biol. 2008;84:949–957. doi: 10.1189/jlb.0108024. [DOI] [PMC free article] [PubMed] [Google Scholar]
- 7.Macintyre AN, Gerriets VA, Nichols AG, Michalek RD, Rudolph MC, Deoliveira D, Anderson SM, Abel ED, Chen BJ, Hale LP, Rathmell JC. The glucose transporter Glut1 is selectively essential for CD4 T cell activation and effector function. Cell Metab. 2014;20:61–72. doi: 10.1016/j.cmet.2014.05.004. [DOI] [PMC free article] [PubMed] [Google Scholar]
- 8.Cham CM, Gajewski TF. Glucose availability regulates IFN-gamma production and p70S6 kinase activation in CD8+ effector T cells. J Immunol. 2005;174:4670–4677. doi: 10.4049/jimmunol.174.8.4670. [DOI] [PubMed] [Google Scholar]
- 9.MacIver NJ, Michalek RD, Rathmell JC. Metabolic regulation of T lymphocytes. Annu Rev Immunol. 2013;31:259–283. doi: 10.1146/annurev-immunol-032712-095956. [DOI] [PMC free article] [PubMed] [Google Scholar]
- 10.Gerriets VA, Kishton RJ, Nichols AG, Macintyre AN, Inoue M, Ilkayeva O, Winter PS, Liu X, Priyadharshini B, Slawinska ME, Haeberli L, Huck C, Turka LA, Wood KC, Hale LP, Smith PA, Schneider MA, MacIver NJ, Locasale JW, Newgard CB, Shinohara ML, Rathmell JC. Metabolic programming and PDHK1 control CD4+ T cell subsets and inflammation. J Clin Invest. 2014 doi: 10.1172/JCI76012. [DOI] [PMC free article] [PubMed] [Google Scholar]
- 11.Shi LZ, Wang R, Huang G, Vogel P, Neale G, Green DR, Chi H. HIF1alpha-dependent glycolytic pathway orchestrates a metabolic checkpoint for the differentiation of TH17 and Treg cells. J Exp Med. 2011;208:1367–1376. doi: 10.1084/jem.20110278. [DOI] [PMC free article] [PubMed] [Google Scholar]
- 12.Michalek RD, Gerriets VA, Jacobs SR, Macintyre AN, MacIver NJ, Mason EF, Sullivan SA, Nichols AG, Rathmell JC. Cutting edge: distinct glycolytic and lipid oxidative metabolic programs are essential for effector and regulatory CD4+ T cell subsets. J Immunol. 2011;186:3299–3303. doi: 10.4049/jimmunol.1003613. [DOI] [PMC free article] [PubMed] [Google Scholar]
- 13.Wang R, Dillon CP, Shi LZ, Milasta S, Carter R, Finkelstein D, McCormick LL, Fitzgerald P, Chi H, Munger J, Green DR. The transcription factor Myc controls metabolic reprogramming upon T lymphocyte activation. Immunity. 2011;35:871–882. doi: 10.1016/j.immuni.2011.09.021. [DOI] [PMC free article] [PubMed] [Google Scholar]
- 14.Delgoffe GM, Kole TP, Zheng Y, Zarek PE, Matthews KL, Xiao B, Worley PF, Kozma SC, Powell JD. The mTOR kinase differentially regulates effector and regulatory T cell lineage commitment. Immunity. 2009;30:832–844. doi: 10.1016/j.immuni.2009.04.014. [DOI] [PMC free article] [PubMed] [Google Scholar]
- 15.Michalek RD, Gerriets VA, Nichols AG, Inoue M, Kazmin D, Chang CY, Dwyer MA, Nelson ER, Pollizzi KN, Ilkayeva O, Giguere V, Zuercher WJ, Powell JD, Shinohara ML, McDonnell DP, Rathmell JC. Estrogen-related receptor-alpha is a metabolic regulator of effector T-cell activation and differentiation. Proc Natl Acad Sci U S A. 2011;108:18348–18353. doi: 10.1073/pnas.1108856108. [DOI] [PMC free article] [PubMed] [Google Scholar]
- 16.Gerriets VA, MacIver NJ. Role of T cells in malnutrition and obesity. Front Immunol. 2014;5:379. doi: 10.3389/fimmu.2014.00379. [DOI] [PMC free article] [PubMed] [Google Scholar]
- 17.Saucillo DC, Gerriets VA, Sheng J, Rathmell JC, Maciver NJ. Leptin metabolically licenses T cells for activation to link nutrition and immunity. J Immunol. 2014;192:136–144. doi: 10.4049/jimmunol.1301158. [DOI] [PMC free article] [PubMed] [Google Scholar]
- 18.Lord GM, Matarese G, Howard JK, Baker RJ, Bloom SR, Lechler RI. Leptin modulates the T-cell immune response and reverses starvation-induced immunosuppression. Nature. 1998;394:897–901. doi: 10.1038/29795. [DOI] [PubMed] [Google Scholar]
- 19.Lord GM, Matarese G, Howard JK, Bloom SR, Lechler RI. Leptin inhibits the anti-CD3-driven proliferation of peripheral blood T cells but enhances the production of proinflammatory cytokines. J Leukoc Biol. 2002;72:330–338. [PubMed] [Google Scholar]
- 20.Bartz S, Mody A, Hornik C, Bain J, Muehlbauer M, Kiyimba T, Kiboneka E, Stevens R, Bartlett J, St Peter JV, Newgard CB, Freemark M. Severe acute malnutrition in childhood: hormonal and metabolic status at presentation, response to treatment, and predictors of mortality. J Clin Endocrinol Metab. 2014;99:2128–2137. doi: 10.1210/jc.2013-4018. [DOI] [PMC free article] [PubMed] [Google Scholar]
- 21.Liu Y, Yu Y, Matarese G, La Cava A. Cutting edge: fasting-induced hypoleptinemia expands functional regulatory T cells in systemic lupus erythematosus. J Immunol. 2012;188:2070–2073. doi: 10.4049/jimmunol.1102835. [DOI] [PMC free article] [PubMed] [Google Scholar]
- 22.Reis BS, Lee K, Fanok MH, Mascaraque C, Amoury M, Cohn LB, Rogoz A, Dallner OS, Moraes-Vieira PM, Domingos AI, Mucida D. Leptin receptor signaling in T cells is required for Th17 differentiation. J Immunol. 2015;194:5253–5260. doi: 10.4049/jimmunol.1402996. [DOI] [PMC free article] [PubMed] [Google Scholar]
- 23.Procaccini C, De Rosa V, Galgani M, Carbone F, Cassano S, Greco D, Qian K, Auvinen P, Cali G, Stallone G, Formisano L, La Cava A, Matarese G. Leptin-induced mTOR activation defines a specific molecular and transcriptional signature controlling CD4+ effector T cell responses. J Immunol. 2012;189:2941–2953. doi: 10.4049/jimmunol.1200935. [DOI] [PubMed] [Google Scholar]
- 24.Yu Y, Liu Y, Shi FD, Zou H, Matarese G, La Cava A. Cutting edge: Leptin-induced RORgammat expression in CD4+ T cells promotes Th17 responses in systemic lupus erythematosus. J Immunol. 2013;190:3054–3058. doi: 10.4049/jimmunol.1203275. [DOI] [PMC free article] [PubMed] [Google Scholar]
- 25.Amarilyo G, Iikuni N, Shi FD, Liu A, Matarese G, La Cava A. Leptin promotes lupus T-cell autoimmunity. Clin Immunol. 2013;149:530–533. doi: 10.1016/j.clim.2013.09.002. [DOI] [PubMed] [Google Scholar]
- 26.Chuang HC, Sheu WH, Lin YT, Tsai CY, Yang CY, Cheng YJ, Huang PY, Li JP, Chiu LL, Wang X, Xie M, Schneider MD, Tan TH. HGK/MAP4K4 deficiency induces TRAF2 stabilization and Th17 differentiation leading to insulin resistance. Nat Commun. 2014;5:4602. doi: 10.1038/ncomms5602. [DOI] [PMC free article] [PubMed] [Google Scholar]
- 27.Lam QL, Lu L. Role of leptin in immunity. Cell Mol Immunol. 2007;4:1–13. [PubMed] [Google Scholar]
- 28.De Rosa V, Procaccini C, Cali G, Pirozzi G, Fontana S, Zappacosta S, La Cava A, Matarese G. A key role of leptin in the control of regulatory T cell proliferation. Immunity. 2007;26:241–255. doi: 10.1016/j.immuni.2007.01.011. [DOI] [PubMed] [Google Scholar]
- 29.Fujita Y, Fujii T, Mimori T, Sato T, Nakamura T, Iwao H, Nakajima A, Miki M, Sakai T, Kawanami T, Tanaka M, Masaki Y, Fukushima T, Okazaki T, Umehara H. Deficient leptin signaling ameliorates systemic lupus erythematosus lesions in MRL/Mp-Fas lpr mice. J Immunol. 2014;192:979–984. doi: 10.4049/jimmunol.1301685. [DOI] [PMC free article] [PubMed] [Google Scholar]
- 30.Moraes-Vieira PM, Larocca RA, Bassi EJ, Peron JP, Andrade-Oliveira V, Wasinski F, Araujo R, Thornley T, Quintana FJ, Basso AS, Strom TB, Camara NO. Leptin deficiency impairs maturation of dendritic cells and enhances induction of regulatory T and Th17 cells. Eur J Immunol. 2014;44:794–806. doi: 10.1002/eji.201343592. [DOI] [PMC free article] [PubMed] [Google Scholar]
- 31.Galgani M, Procaccini C, De Rosa V, Carbone F, Chieffi P, La Cava A, Matarese G. Leptin modulates the survival of autoreactive CD4+ T cells through the nutrient/energy-sensing mammalian target of rapamycin signaling pathway. J Immunol. 2010;185:7474–7479. doi: 10.4049/jimmunol.1001674. [DOI] [PubMed] [Google Scholar]
- 32.Piccio L, Stark JL, Cross AH. Chronic calorie restriction attenuates experimental autoimmune encephalomyelitis. J Leukoc Biol. 2008;84:940–948. doi: 10.1189/jlb.0208133. [DOI] [PMC free article] [PubMed] [Google Scholar]
- 33.Matarese G, Sanna V, Di Giacomo A, Lord GM, Howard JK, Bloom SR, Lechler RI, Fontana S, Zappacosta S. Leptin potentiates experimental autoimmune encephalomyelitis in SJL female mice and confers susceptibility to males. Eur J Immunol. 2001;31:1324–1332. doi: 10.1002/1521-4141(200105)31:5<1324::AID-IMMU1324>3.0.CO;2-Y. [DOI] [PubMed] [Google Scholar]
- 34.Matarese G, Di Giacomo A, Sanna V, Lord GM, Howard JK, Di Tuoro A, Bloom SR, Lechler RI, Zappacosta S, Fontana S. Requirement for leptin in the induction and progression of autoimmune encephalomyelitis. J Immunol. 2001;166:5909–5916. doi: 10.4049/jimmunol.166.10.5909. [DOI] [PubMed] [Google Scholar]
- 35.De Rosa V, Procaccini C, La Cava A, Chieffi P, Nicoletti GF, Fontana S, Zappacosta S, Matarese G. Leptin neutralization interferes with pathogenic T cell autoreactivity in autoimmune encephalomyelitis. J Clin Invest. 2006;116:447–455. doi: 10.1172/JCI26523. [DOI] [PMC free article] [PubMed] [Google Scholar]
- 36.Komiyama Y, Nakae S, Matsuki T, Nambu A, Ishigame H, Kakuta S, Sudo K, Iwakura Y. IL-17 plays an important role in the development of experimental autoimmune encephalomyelitis. J Immunol. 2006;177:566–573. doi: 10.4049/jimmunol.177.1.566. [DOI] [PubMed] [Google Scholar]
- 37.Ivanov II, McKenzie BS, Zhou L, Tadokoro CE, Lepelley A, Lafaille JJ, Cua DJ, Littman DR. The orphan nuclear receptor RORgammat directs the differentiation program of proinflammatory IL-17+ T helper cells. Cell. 2006;126:1121–1133. doi: 10.1016/j.cell.2006.07.035. [DOI] [PubMed] [Google Scholar]
- 38.Procaccini C, De Rosa V, Galgani M, Abanni L, Cali G, Porcellini A, Carbone F, Fontana S, Horvath TL, La Cava A, Matarese G. An oscillatory switch in mTOR kinase activity sets regulatory T cell responsiveness. Immunity. 2010;33:929–941. doi: 10.1016/j.immuni.2010.11.024. [DOI] [PMC free article] [PubMed] [Google Scholar]
- 39.Niu G, Briggs J, Deng J, Ma Y, Lee H, Kortylewski M, Kujawski M, Kay H, Cress WD, Jove R, Yu H. Signal transducer and activator of transcription 3 is required for hypoxia-inducible factor-1alpha RNA expression in both tumor cells and tumor-associated myeloid cells. Mol Cancer Res. 2008;6:1099–1105. doi: 10.1158/1541-7786.MCR-07-2177. [DOI] [PMC free article] [PubMed] [Google Scholar]
- 40.Jung JE, Lee HG, Cho IH, Chung DH, Yoon SH, Yang YM, Lee JW, Choi S, Park JW, Ye SK, Chung MH. STAT3 is a potential modulator of HIF-1-mediated VEGF expression in human renal carcinoma cells. FASEB J. 2005;19:1296–1298. doi: 10.1096/fj.04-3099fje. [DOI] [PubMed] [Google Scholar]
- 41.Pawlus MR, Wang L, Hu CJ. STAT3 and HIF1alpha cooperatively activate HIF1 target genes in MDA-MB-231 and RCC4 cells. Oncogene. 2014;33:1670–1679. doi: 10.1038/onc.2013.115. [DOI] [PMC free article] [PubMed] [Google Scholar]
- 42.Xu Q, Briggs J, Park S, Niu G, Kortylewski M, Zhang S, Gritsko T, Turkson J, Kay H, Semenza GL, Cheng JQ, Jove R, Yu H. Targeting Stat3 blocks both HIF-1 and VEGF expression induced by multiple oncogenic growth signaling pathways. Oncogene. 2005;24:5552–5560. doi: 10.1038/sj.onc.1208719. [DOI] [PubMed] [Google Scholar]
- 43.Esquifino AI, Cano P, Jimenez V, Cutrera RA, Cardinali DP. Experimental allergic encephalomyelitis in male Lewis rats subjected to calorie restriction. J Physiol Biochem. 2004;60:245–252. doi: 10.1007/BF03167069. [DOI] [PubMed] [Google Scholar]
- 44.Papathanassoglou E, El-Haschimi K, Li XC, Matarese G, Strom T, Mantzoros C. Leptin receptor expression and signaling in lymphocytes: kinetics during lymphocyte activation, role in lymphocyte survival, and response to high fat diet in mice. J Immunol. 2006;176:7745–7752. doi: 10.4049/jimmunol.176.12.7745. [DOI] [PubMed] [Google Scholar]
- 45.Procaccini C, De Rosa V, Galgani M, Carbone F, La Rocca C, Formisano L, Matarese G. Role of adipokines signaling in the modulation of T cells function. Front Immunol. 2013;4:332. doi: 10.3389/fimmu.2013.00332. [DOI] [PMC free article] [PubMed] [Google Scholar]
- 46.Waickman AT, Powell JD. mTOR, metabolism, and the regulation of T-cell differentiation and function. Immunol Rev. 2012;249:43–58. doi: 10.1111/j.1600-065X.2012.01152.x. [DOI] [PMC free article] [PubMed] [Google Scholar]
- 47.Huynh A, DuPage M, Priyadharshini B, Sage PT, Quiros J, Borges CM, Townamchai N, Gerriets VA, Rathmell JC, Sharpe AH, Bluestone JA, Turka LA. Control of PI(3) kinase in T cells maintains homeostasis and lineage stability. Nat Immunol. 2015 doi: 10.1038/ni.3077. [DOI] [PMC free article] [PubMed] [Google Scholar]
- 48.Dang EV, Barbi J, Yang HY, Jinasena D, Yu H, Zheng Y, Bordman Z, Fu J, Kim Y, Yen HR, Luo W, Zeller K, Shimoda L, Topalian SL, Semenza GL, Dang CV, Pardoll DM, Pan F. Control of T(H)17/T(reg) balance by hypoxia-inducible factor 1. Cell. 2011;146:772–784. doi: 10.1016/j.cell.2011.07.033. [DOI] [PMC free article] [PubMed] [Google Scholar]
- 49.Wang H, Flach H, Onizawa M, Wei L, McManus MT, Weiss A. Negative regulation of Hif1a expression and TH17 differentiation by the hypoxia-regulated microRNA miR-210. Nat Immunol. 2014;15:393–401. doi: 10.1038/ni.2846. [DOI] [PMC free article] [PubMed] [Google Scholar]
- 50.Inoue M, Williams KL, Gunn MD, Shinohara ML. NLRP3 inflammasome induces chemotactic immune cell migration to the CNS in experimental autoimmune encephalomyelitis. Proc Natl Acad Sci U S A. 2012;109:10480–10485. doi: 10.1073/pnas.1201836109. [DOI] [PMC free article] [PubMed] [Google Scholar]
Associated Data
This section collects any data citations, data availability statements, or supplementary materials included in this article.