Abstract
AIM
To characterize whether a glaucoma model with chronic elevation of the intraocular pressure (IOP) was able to be induced by anterior chamber injection of microbeads in rabbits.
METHODS
In order to screen the optimal dose of microbead injection, IOP was measured every 3d for 4wk using handheld applanation tonometer after a single intracameral injection of 10 µL, 25 µL, 50 µL or 100 µL microbeads (5×10⁶ beads/mL; n=6/group) in New Zealand White rabbits. To prolong IOP elevation, two intracameral injections of 50 µL microbeads or phosphate buffer saline (PBS) were made respectively at days 0 and 21 (n=24/group). The fellow eye was not treated. At 5wk after the second injection of microbeads or PBS, bright-field microscopy and transmission electron microscopy (TEM) were used to assess the changes in the retina. The expression of glial fibrillary acidic protein (GFAP) in the retina was evaluated by immunofluorescence, quantitative real-time polymerase chain reaction and Western blot at 5wk after the second injection of microbeads.
RESULTS
Following a single intracameral injection of 10 µL, 25 µL, 50 µL or 100 µL microbead, IOP levels showed a gradual increase and a later decrease over a 4wk period after a single injection of microbead into the anterior chamber of rabbits. A peak IOP was observed at day 15 after injection. No significant difference in peak value of IOP was found between 10 µL and 25 µL groups (17.13±1.25 mm Hg vs 17.63±0.74 mm Hg; P=0.346). The peak value of IOP from 50 µL group (23.25±1.16 mm Hg) was significantly higher than 10 µL and 25 µL groups (all P<0.05). Administration of 100 µL microbead solution (23.00±0.93 mm Hg) did not lead to a significant increase in IOP compared to the 50 µL group (P=0.64). A prolonged elevated IOP duration up to 8wk was achieved by administering two injections of 50 µL microbeads (20.48±1.21 mm Hg vs 13.60±0.90 mm Hg in PBS-injected group; P<0.05). The bright-field and TEM were used to assess the changes of retinal ganglion cells (RGCs). Compared with PBS-injected group, the extended IOP elevation was associated with the degeneration of optic nerve, the reduction of RGC axons (47.16%, P<0.05) and the increased GFAP expression in the retina (4.74±1.10 vs 1.00±0.46, P<0.05).
CONCLUSION
Two injections of microbeads into the ocular anterior chamber of rabbits lead to a prolonged IOP elevation which results in structural abnormality as well as loss in RGCs and their axons without observable ocular structural damage or inflammatory response. We have therefore established a novel and practical model of experimental glaucoma in rabbits.
Keywords: microbead, ocular hypertension, optic neuropathy, glial fibrillary acidic protein, rabbit
INTRODUCTION
Glaucoma is a relatively common neurodegenerative disease, estimated to affect over 80-million people worldwide[1]–[2]. The disease is characterized by optic nerve damage and retinal ganglion cell (RGC) degeneration leading to visual field defect or even blindness[3]–[4]. This study aims at constructing a reliable glaucoma model in rabbits in order to further clarify molecular processes leading to the development of glaucoma as well as a suitable model for the pharmacokinetic or pharmacodynamics study.
Mice, rats, rabbits and monkeys are the animals most commonly used to construct artificial models of glaucoma[5]–[8]. The bigger size of rabbit eyeball poses significant convenience to operate on and manipulate while rabbit care remains relatively cost-effective [9]. The leporine glaucoma model has been receiving dramatic attention in past few years[10]. Momentarily two validated methods for inducing glaucoma in rabbits are being employed. The first one causes intraocular pressure (IOP) elevation by intracameral injection with carbomer[11], subconjunctival injection of betamethasone[12]–[13] and posterior chamber injection of α-chymotrypsin[14]–[15]. Another technique to obstruct humorous outflow is the destruction of the angular meshwork with a laser[16]–[18]. However, both methods result in severe inflammatory responses in the anterior segment, and will result in many complications. Thus, a safe, reliable, and cost-effective method to induce elevated IOP is yet to be developed.
Previous studies have shown that IOP elevation can be induced by injection of fluorescent polystyrene microbeads into the ocular anterior chamber in mice and rats[19]–[23]. Therefore we sought to investigate whether fluorescent polystyrene microbead could be used to induce chronic IOP elevation in rabbits for the establishment of a reliable leporine model of glaucoma. Furthermore, the glial fibrillary acidic protein (GFAP), a marker for astrocytes and Müller cell activation[24], was used for monitoring the progression of glaucomatous neurodegeneration in the rabbit model with ocular hypertension (OHT).
MATERIALS AND METHODS
All experimental procedures were in accordance with the ARVO Statement for the Use of Animals in Ophthalmic and Vision Research. Animal ethics approval was obtained from the Animal Ethics Committee at the Shenzhen Eye Hospital Affiliated to Jinan University.
Animal Use
Male New Zealand White rabbits (aged 8 to 12wk and weighed 1.8 to 2.0 kg) were purchased from Guangdong Province Experimental Animal Center (China). All rabbits were housed in a 12h light (50 lux illumination) and 12h dark (<10 lux illumination) cycle (light was turned on at 7 a.m.), with ad libitum access to food and water. No rabbit became ill prior to the experimental endpoint. The health and well-being of the rabbits were monitored. Minor stress induced by operation was looked for daily by observing the motility, grooming and feeding behavior after injections. Typical behaviors that indicate discomfort include agitation and excessive rubbing of the eye[25].
A Single Injection of Microbeads and Intraocular Pressure Measurement for Dose Screening
In order to assess the optimal amount of microbeads to induce stable IOP elevation, a total of 24 New Zealand White rabbits were randomized into 4 groups and received a single intracameral injection of 10 µL, 25 µL, 50 µL or 100 µL microbeads (a diameter of 15 µm; FluoSpheres; Invitrogen, Carlsbad, CA, USA) reformulated in phosphate buffered saline (PBS) at a concentration of 5×10⁶ beads/mL. Rabbits were anesthetized with an intramuscular injection of xylazine hydrochloride (4 mg/kg, DunhuaKuta Animal Pharmaceutical Co., Ltd., China) supplemented with a topical anesthetic agent on the operated eye (0.5% cocaine hydrochloride ophthalmic solution, Zhongshan Ophthalmic Centre, Sun Yat-Sen University, China). The corneal limbus was gently punctured using a 30-gauge needle to generate easy tunnel entry for microsyringe injection. A certain amount of aqueous humor (150 µL) was discharged to avoid the acute IOP spike immediately after injection, and an air bubble (50 µL) was subsequently injected for sustaining the anterior chamber via the entry. A various volume (10-100 µL) of microbead solution was injected through this preformed tunnel hole into the anterior chamber by a Hamilton syringe. Antibiotic drops (0.3% ofloxacin ophthalmic solution; Hangzhou Minsheng Pharmaceutical Co., Ltd., China) were placed on the operated eye to prevent infection after injection. No treatment was administered to the left eye in order to provide an internal control.
The IOP measurements were performed and recorded in conscious rabbits with the topical anesthesia placed on each eye (0.5% cocaine hydrochloride ophthalmic solution). IOP was measured every 3d for 4wk on a total of 10 occasions after injection. A handheld applanation tonometer (Accutome Inc., Malvern, PA, USA) was used to measure IOP. The average of three consecutive measurements was used as final IOP value. All IOP measurements were performed at a similar time during the day (7 to 9 p.m.) to exclude circadian variations.
Two Injections of Microbeads to Induce a Prolonged Intraocular Pressure Elevation
After examining the screening data, it was decided to use 50 µL microbead (5×10⁶ beads/mL) to induce an IOP elevation. A total of 48 rabbits were randomly assigned to receive two intracameral injections of either 50 µL of microbeads or PBS in the right eye as OHT or control group at days 0 and 21, while no treatment in the left eye was administered. The IOP was measured at day 1 and following every 3d for 8wk using a handheld applanation tonometer as described in the single injection experiment.
The morphology of anterior segment of the eye was checked by a slit-lamp equipped camera (SLM-8; Kanghua Science & Technology Co., Ltd., China) every 3d throughout the experiment and corneal endothelial microscopy (SP-3000P; TOPCON, Japan) at 1wk after the first injection.
Anterior Chamber Angle and Retinal Observations with Fluorescence Microscope
The rabbits were sacrificed at 5wk after the second injection. The tissues of chamber angle and the retina were obtained and embedded in optimal cutting temperature compound (OCT; Shanghai solarbio Bioscience & Technology Co., Ltd., China) for further sectioning and staining. Ten µm frozen sections were fixed with 4% paraformaldehyde (Beijing solarbio science & technology Co., Ltd., China) at room temperature for 15min and then subjected to the counterstained with DAPI. The sections were observed and photographed under a fluorescence microscope (AXIO Vert.A1; Carl Zeiss).
Retinal Ganglion Cell and Optic Nerve Visualization
Five weeks after the second injection, the retina and optic nerve were obtained immediately and fixed in 4% paraformaldehyde for 24h. The optic nerve was excised 1.5 mm posterior to the eyeball and cross sectional slices were constructed. The retina was excised at the 6 and 12 o'clock sectors relative to the optic disc. The prepared optic nerve and retina segments were then embedded in paraffin and sectioned (10 µm). Sections were stained with hematoxylin and eosin (H&E) and photographed with a microscope system (N-STORM; Nikon, Japan) at 40× magnification.
Transmission Electron Microscope Assessment of Optic Nerve Sections
The optic nerve were isolated immediately after rabbit sacrifice and fixed in 2.5% glutaraldehyde phosphate buffer (Beijing solarbio science & technology Co., Ltd., China) for 2h. With light microscopic localization, ultrathin 100 nm sections were constructed from the 1 µm section. The ultrathin sections were stained with uranyl acetate and lead citrate, and scanned with transmission electron microscope (TEM; JEM-100S; FEI, USA). At 5800× magnification twelve rectangular images measuring 246 µm2 each were randomly selected from each optic nerve section. Axonal densities were calculated by averaging the sum of the number of axons from each of the TEM images and dividing that number by the area. The ultrastructure of optic nerve was visualized with the TEM at 40 000× magnification. Images were processed with Image-Pro Plus 6.0 image analysis software (Media Cybernetics, Inc. Silver Spring, MD, USA)[26]. The loss of percentual axons was calculated by dividing the number of axons in the optic nerve of microbead-injected eye by the PBS-injected eye.
Identification of Astrocytes and Müller Cell Activation by Glial Fibrillary Acidic Protein
For the purpose of immunofluorescence staining, the retina was embedded in OCT and sectioned into 10 µm by using a freezing microtome (Leica CM1860, Germany). The retinal tissue was incubated with a primary antibody against a GFAP-specific marker (1:1000 dilution, Sigma-Aldrich, USA), followed by an Alexa Fluor 488 conjugated secondary antibody (Invitrogen, USA). Expression of GFAP was examined under a fluorescent microscope (AXIO Vert.A1; Carl Zeiss).
TRIZOL reagent (Invitrogen) was used to extract retinal mRNA for quantitative real-time polymerase chain reaction (qPCR) analysis. One µg mRNA was reversely transcribed into cDNA and thereafter amplified by qPCR. Relative expression of GFAP mRNA was analyzed using the 2−ΔΔCT method[27]. β-actin gene served as an internal reference to exclude sampling error. The sequences of the primers are as follows: GFAP, forward 5′-ACCTGCTCAACGTGAAGCTG-3′, reverse 5′-GGTCTTCACCACGATGTTCC-3′; β-actin, forward 5′-ACGACATGGAGAAGATCTG-3′, reverse 5′-TGTTGAACGTCTCGAACATG-3′.
Retinal protein was extracted for the quantification of intracellular GFAP by Western blot analysis[28]. Protein extracts were electrophoresed on sodium dodecyl sulfate-polyacrylamide gel and incubated with primary anti-GFAP (1:1000 dilution, Sigma-Aldrich) or anti-β-actin antibodies (1:1000 dilution, Sigma-Aldrich) for 12h at 4°C. Then a goat anti-rabbit secondary antibody-IgG (1:1000 dilution, Invitrogen) was added at room temperature for 1h. Following X-ray exposure, optical density of GFAP and β-actin was measured (Bio-Rad, ChemiDoc MP System, CA, USA).
Statistical Analysis
Data are expressed as mean±standard deviation. Mean data were analyzed with unpaired t-tests or two-way analysis of variance (ANOVA) followed by post-hoc Tukey analysis (SPSS software, version 18.0, SPSS Inc., Chicago, IL, USA). A P value <0.05 was considered statistically significant.
RESULTS
Distribution of Microbeads after an Intracameral Injection
Scattering microbeads (orange) were observed in the anterior chamber immediately after a single intracameral injection of 50 µL microbeads (Figure 1A). No overt corneal or iris injury was found after injection and no opaque cornea, edema or exudation in the anterior chamber throughout the experiments was found in the rabbits (Data not shown). Corneal endothelial microscopy showed the normal features of corneal endothelium with regular hexagon cell morphology and clear boundaries at 1wk after injection of 50 µL microbeads (Figure 1B). The accumulation of microbeads was observed in the anterior chamber angle at 8wk after injection (Figure 1C, 1D).
Figure 1. Distribution of microbeads in the anterior chamber following an intracameral injection.
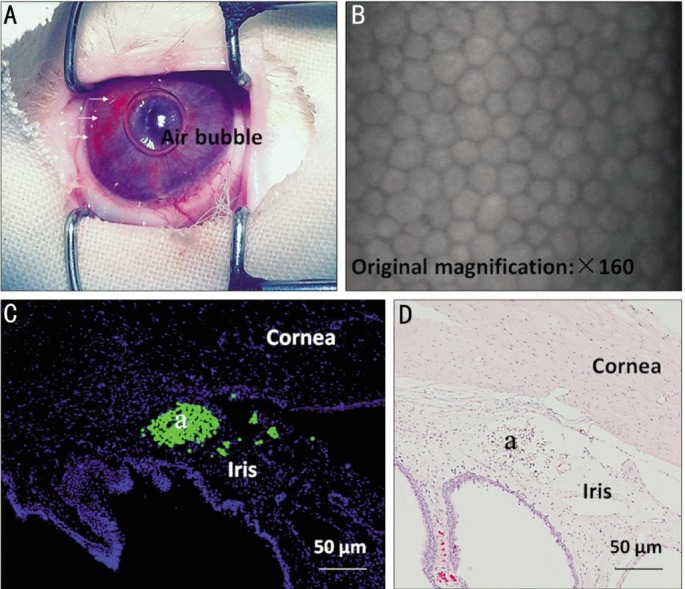
A: The representative image on scattering microbeads taken immediately after injection of 50 µL microbeads (orange). White arrowheads indicate microbeads; B: The representative image of corneal endothelium was taken at 1wk after injection of 50 µL microbeads; C, D: Accumulation and localization of FITC-labelled microbeads (a) in the anterior chamber angle at 8wk after the first injection. Scale bars: 50 µm.
Elevation of Intraocular Pressure Following a Single Injection of Microbeads
IOP levels showed a gradual increase and a later decrease over a 4wk period after a single injection of microbead (10 µL, 25 µL, 50 µL or 100 µL) into the anterior chamber of rabbits (n=6/group). A peak IOP was observed at day 15 after injection. The peak values of IOP in each group were at day 15 as following: 17.13±1.25 mm Hg in the 10 µL group, 17.63±0.74 mm Hg in the 25 µL group, 23.25±1.16 mm Hg in the 50 µL group and 23.00±0.93 mm Hg in the 100 µL group (Figure 2). There is no significant difference in peak value of IOP demonstrated between 10 µL and 25 µL groups (P=0.346). The peak value of IOP from 50 µL group was significantly higher than the 10 µL and 25 µL groups (all P<0.05). Administration of 100 µL microbead solution did not lead to a significant increase in IOP compared with the 50 µL group (P=0.64). The IOP levels of all control (Ctrl) eyes (13.60±0.90 mm Hg) remained stable throughout the experiments.
Figure 2. Effect of the IOP levels after the intracameral injection of microbeads.
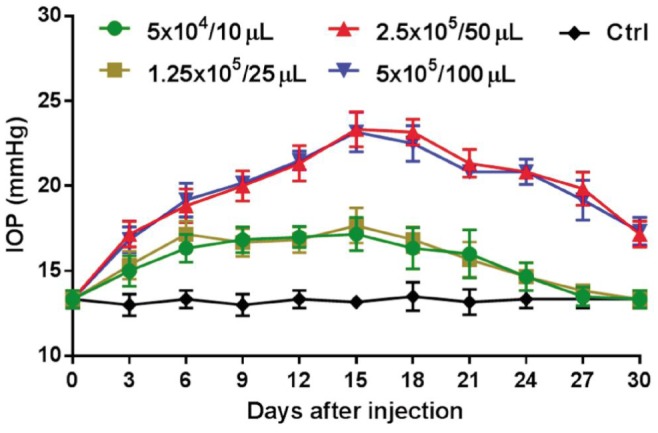
The elevation of IOP was assessed after a single injection of microbeads with different volumes (10 µL, 25 µL, 50 µL or 100 µL) into the ocular anterior chamber of rabbit (n=6/group).
Extension of Intraocular Pressure Following Two Injections of Microbeads
Following the results of the above screening, an amount of 50 µL microbeads was used to research extended IOP elevation. The anterior chamber of the right eye was injected with either 50 µL microbeads or PBS (n=24/group) at days 0 and 21 (Figure 3). A first peak IOP value (23.83±1.14 mm Hg) was reached 15d after the first injection. A second peak (23.26±1.03 mm Hg) appeared at day 30 and then gradual decrease of the IOP to baseline level was observed up to 8wk after the first injection. The IOP did not alter in the PBS-injected (control) group (13.61±0.90 mm Hg) and significantly lower compared with the two-injection group (20.48±1.21 mm Hg, P<0.05).
Figure 3. Assessment of IOP elevation following two injections of microbeads.
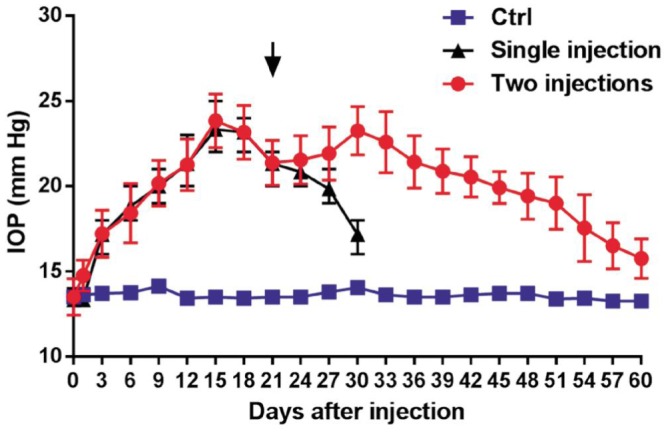
The elevation of IOP was assessed after two injections of microbeads (circle) or PBS (square) into the ocular anterior chamber of rabbit (n=24/group). Arrowhead indicates the repeat injection. The IOP levels after the single injection of 50 µL microbeads (triangle).
Pathological Changes in the Optic Nerve and Retina Associated with Microbead-induced Ocular Hypertension
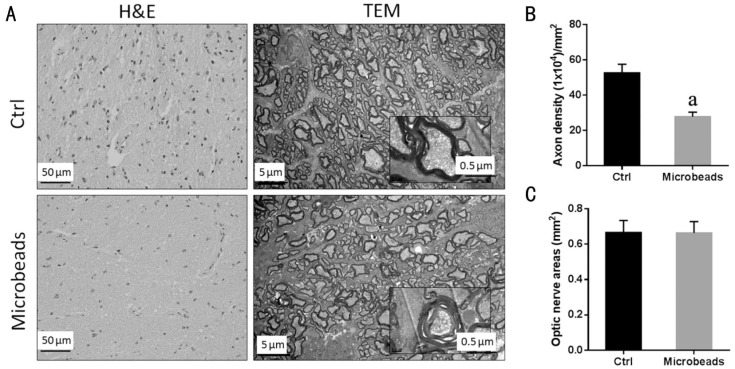
The H&E staining optic nerve sections from OHT (microbead-injected) group showed an apparent decrease on the density of nerve fibers, and the TEM images exhibited signs of degeneration with axon swelling, disruption of axon fascicles, increases in connective tissue septa and lower axon numbers (Figure 4A). There was a statistically significant difference in the axon density between the control group (52.65±4.83×10⁴ axons/mm2) and OHT group (27.82±2.54×10⁴ axons/mm2) (P<0.05; Figure 4B). The extent of axonal loss was determined to be 47.16%±2.35% in the OHT group compared to control group. There was no statistically significant difference in the cross-sectional area of optic nerve between control group (0.68 mm2) and OHT group (0.67 mm2) (P=0.72; Figure 4C).
Figure 4. Optic nerve abnormality associated with microbead-induced OHT.
A: The H&E staining and the TEM images of cross-sections through the optic nerve after two intracameral injections of PBS or microbeads; B: Mean axon density; C: Cross-sectional area of optic nerve from rabbits receiving two intracameral injections of PBS or microbeads (n=6/group; aP<0.05 vs PBS-injected group).
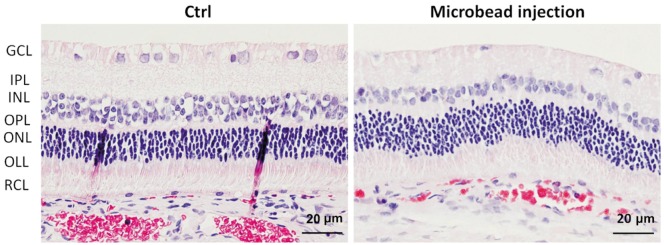
The histology of retinal layers in control eyes appeared to be normal and exhibited relatively dense and orderly RGCs in ganglion cell layer. In contrast, sparse RGCs were observed in the microbead-injected eyes (Figure 5).
Figure 5. Retinal degeneration associated with microbead-induced OHT.
The cross-sections of retina obtained from the rabbits receiving two intracameral injections of PBS or microbeads with H&E staining. GCL: Ganglion cell layer; IPL: Inner plexiform layer; INL: Inner nuclear layer; OPL: Outer plexiform layer; ONL: Outer nuclear layer; OLL: Outer limiting membrane layer; RCL: Rods and cones layer. Scale bars: 20 µm.
Upregulation of Glial Fibrillary Acidic Protein Associated with Microbead-induced Ocular Hypertension
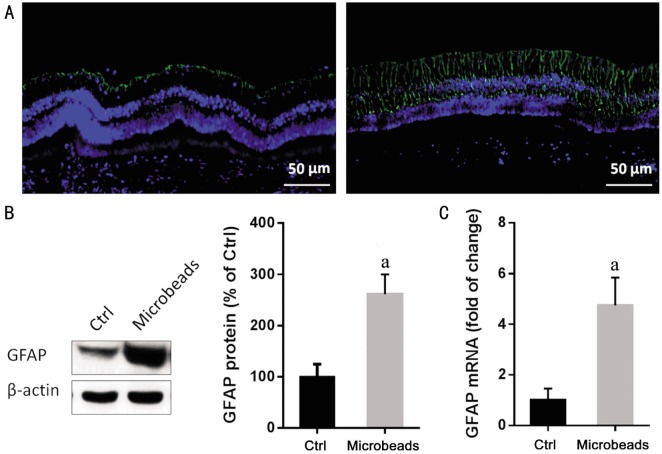
Immunofloureoscent staining of retina showed a background GFAP expression on astrocytes in the control eyes. In contrast, a greater proportion of microbead-injected eyes showed strong activation, which is evident GFAP immunoreactivity on astrocytes and Müller cell processes, spanning throughout the whole retinal layers (Figure 6A).The mRNA and protein expression of GFAP were detected by qPCR and Western blot respectively. Both protein (Figure 6B; P<0.05) and mRNA (Figure 6C; Table 1; P<0.05) of GFAP were significantly higher in the OHT group compared to control group.
Figure 6. Increased expression of GFAP following the repeated injection of microbeads.
A: Immunofluorescence image illustrated the expression of GFAP (green) in the retina from the rabbits receiving two injections of PBS or microbeads. Sections counter stained with DAPI (blue). Scale bars: 50 µm; B: The representative blot shows Western blot analysis from retina. The protein level of GFAP evaluated by western blot (n=6/group); C: The mRNA level of GFAP evaluated by qPCR (n=6/group). aP<0.05.
Table 1. The expression of GFAP mRNA in the retina of rabbit receiving the microbead injection.
| Injected group | Average CT | ΔCT | ΔΔCT | RQ |
| PBS | 16.84±0.31 | 3.40±0.46 | 0.00±0.46 | 1.00±0.46 |
| Microbead | 13.82±0.27 | 1.21±0.39 | -2.15±0.29 | 4.74±1.10a |
CT value represents the number of qPCR cycles when the fluorescence reaches the threshold; ΔCT= CT value of GFAP-CT value of β-actin; ΔΔCT=ΔCT (microbead-injected)-ΔCT (PBS-injected); RQ: Relative quantification=2−ΔΔCT.
DISCUSSION
The aim of this study was to develop a rabbit model of open angle glaucoma applying an effective and reproducible method modified from recent studies of microbead injection to induce IOP elevation in rodents[19]–[21]. A single injection of 50 µL microbeads to the rabbit anterior chamber induced IOP elevation up to 4wk, while a second injection of microbeads at day 21 extended the period to 8wk, resulting in RGC degeneration and up to 47% axon loss that mimic glaucomatous changes, without causing obvious ocular structure damage or inflammatory responses. Up-regulation of GFAP was observed in microbead-induced OHT eyes at week 8, which was also found in previous studies such as rodent models of acute[29]–[30] and chronic IOP elevation[31] as well as in human glaucoma[32].
A previous study verified that a single 2 µL injection of either 10 or 15 µm microbeads into the anterior chamber of mice could successfully induce IOP elevation 50% above baseline in 2d[19]. Since the different sizes of the eyeball in rabbits, it was hypothesized that a larger amount and bigger size of microbeads is needed to induce OHT. We have explored the IOP changes after injection of various volumes (10-100 µL) of 15 µm microbeads into the anterior chamber of rabbits, and have found that 50 µL of microbeads is the optimized volume to induce a significant increase in mean IOP value, and the significant IOP elevation was observed at day 3, which is consistent with the previous study[19].
The angular meshwork and the aqueous plexus in the angular region of rabbits respectively correspond to the trabecular meshwork and the Schlemm's canal in that of humans. Therefore, the outflow pathway for aqueous humor in rabbits is similar to that in humans. That is, the aqueous humor in rabbits flows through the angular meshwork into the aqueous plexus and through the trabecular meshwork into Schlemm's canal in humans[33]–[34]. Meanwhile, it is much more convenient to operate on the bigger size of rabbit eyeball compared to rats or mice and rabbits are low cost compared to primates, but current validated methods for inducing glaucoma in rabbits have some drawbacks. The longest IOP elevation was reported in injection of α-chymotrypsin into the posterior chamber, lasting for one year[15], and injection of betamethasone subconjunctivally also achieved the consistency and robustness of the IOP response[12]. However, the prolonged topical corticosteroid treatment required to achieve glaucoma leaded to cataracts and corneal ulcers[13], while the α-chymotrypsin model caused significant adverse effects such as bullous keratopathy, iris and ciliary body atrophy[15]. In the laser-induced glaucoma models, the IOP elevation lasted for a few weeks but it was difficult to create a successful model due to the unique structure of narrow iridocorneal angle, which prevented access of the laser beam to angular trabecular meshwork, resulting in damage to ciliary body and severe inflammation[35]. Compared with these methods, the microbead-injected model induced consistent and robust IOP elevation up to 8wk, which is easy to create without obvious ocular structure damage or inflammatory responses.
In this rabbit model, it has been demonstrated that optic nerve degeneration and axon loss have emerged similarly in rat or mice model[19]. The optic nerve degeneration exhibited as axon swelling, disruption of axon fascicles, increases in connective tissue septa and lower axon numbers by IOP elevation. There was a statistically significant difference in the axon density between the PBS-injected group (52.65±4.83×10⁴ axons/mm2) and OHT group (27.82±2.54×10⁴ axons/mm2) (P<0.05). The extent of axonal loss was determined to be 47.16%±2.35% in the OHT group compared with control group.
Glial cells activation, which is characterized by cellular hypertrophy and increased expression of GFAP, is a universal response in retinal pathologic states, including glaucoma[24]. The previous study in different animal models[29]–[31] and glaucomatous human donor eyes[32] indicated that glial cell activation was a prominent feature of glaucomatous retina, and this microbead-injected model showed the hypertrophic morphology and increased GFAP immunostaining in retinal astrocytes and Müller cells in OHT eyes compared with PBS-injected eyes, providing a significant evidence for simulating glaucomatous changes successfully.
In summary, we have established a simple strategy to induce an IOP elevation, which is accompanied with the glaucomaous changes in both the optic nerve and retina by performing two separate intracameral injections of microbeads in rabbits. GFAP was identified in this research as a suitable and practical index for assessing of neuronal injury associated with IOP elevation, though the precise mechanism and role of GFAP in glaucoma requires a further attention. Development of this method offers a novel rabbit model of glaucoma employed as a powerful model system for the preclinical testing of drug therapeutics for the managing of glaucoma. However microbeads are required for repeated injection into the anterior chamber of rabbits for the purpose of consistent IOP elevation, and a further improvement is still necessary for this model in the future.
Acknowledgments
The authors appreciate Jeroen van Suylichem, Lei-Lei Tu and Xiao-Li Shen for critical review of the manuscript.
Foundations: Supported by Shenzhen Science and Technology Innovation Committee in China (No. JCYJ20120831154554508; No. JCYJ20140415174819509; No. GJHZ20160229170608241); Medical Science and Technology Research Fund Project in Guangdong Province (No. A2015315).
Conflicts of Interest: Zhao J, None; Zhu TH, None; Chen WC, None; Peng SM, None; Huang XS, None; Cho KS, None; Chen DF, None; Liu GS, None.
REFERENCES
- 1.Zhao Y, Fu JL, Li YL, Li P, Lou FL. Epidemiology and clinical characteristics of patients with glaucoma: An analysis of hospital data between 2003 and 2012. Indian J Ophthalmol. 2015;63(11):825–831. doi: 10.4103/0301-4738.171963. [DOI] [PMC free article] [PubMed] [Google Scholar]
- 2.Kim KE, Jeoung JW, Kim DM, Ahn SJ, Park KH, Kim SH. Long-term follow-up in preperimetric open-angle glaucoma: progression rates and associated factors. Am J Ophthalmol. 2015;159(1):160–168.e1-2. doi: 10.1016/j.ajo.2014.10.010. [DOI] [PubMed] [Google Scholar]
- 3.Singh K, Shrivastava A. Intraocular pressure fluctuations: how much do they matter? Curr Opin Ophthalmol. 2009;20(2):84–87. doi: 10.1097/icu.0b013e328324e6c4. [DOI] [PubMed] [Google Scholar]
- 4.Coleman AL, Miglior S. Risk factors for glaucoma onset and progression. Surv Ophthalmol. 2008;53 Suppl1:S3–10. doi: 10.1016/j.survophthal.2008.08.006. [DOI] [PubMed] [Google Scholar]
- 5.Carter-Dawson L, Crawford ML, Harwerth RS, Smith EL, Feldman R, Shen FF, Mitchell CK, Whitetree A. Vitreal glutamate concentration in monkeys with experimental glaucoma. Invest Ophthalmol Vis Sci. 2002;43(8):2633–2637. [PubMed] [Google Scholar]
- 6.Yan Z, Tian Z, Chen H, Deng S, Lin J, Liao H, Yang X, Ge J, Zhuo Y. Analysis of a method for establishing a model with more stable chronic glaucoma in rhesus monkeys. Exp Eye Res. 2015;131:56–62. doi: 10.1016/j.exer.2014.12.012. [DOI] [PubMed] [Google Scholar]
- 7.Ngumah QC, Buchthal SD, Dacheux RF. Longitudinal non-invasive proton NMR spectroscopy measurement of vitreous lactate in a rabbit model of ocular hypertension. Exp Eye Res. 2006;83(2):390–400. doi: 10.1016/j.exer.2006.01.015. [DOI] [PubMed] [Google Scholar]
- 8.Lu W, Hu H, Sévigny J, Gabelt BT, Kaufman PL, Johnson EC, Morrison JC, Zode GS, Sheffield VC, Zhang X, Laties AM, Mitchell CH. Rat, mouse, and primate models of chronic glaucoma show sustained elevation of extracellular ATP and altered purinergic signaling in the posterior eye. Invest Ophthalmol Vis Sci. 2015;56(5):3075–3083. doi: 10.1167/iovs.14-15891. [DOI] [PMC free article] [PubMed] [Google Scholar]
- 9.Biermann J, van Oterendorp C, Stoykow C, Volz C, Jehle T, Boehringer D, Lagrèze WA. Evaluation of intraocular pressure elevation in a modified laser-induced glaucoma rat model. Exp Eye Res. 2012;104:7–14. doi: 10.1016/j.exer.2012.08.011. [DOI] [PubMed] [Google Scholar]
- 10.Aihara M, Lindsey JD, Weinreb RN. Experimental mouse ocular hypertension: establishment of the model. Invest Ophthalmol Vis Sci. 2003;44(10):4314–4320. doi: 10.1167/iovs.03-0137. [DOI] [PubMed] [Google Scholar]
- 11.Xu Y, Chen Z, Song J. A study of experimental carbomer glaucoma and other experimental glaucoma in rabbits. Zhonghua Yan Ke Za Zhi. 2002;38(3):172–175. [PubMed] [Google Scholar]
- 12.EIGohary AA, Elshazly LH. Photopic negative response in diagnosis of glaucoma: an experimental study in glaucomatous rabbit model. Int J Ophthalmol. 2015;8(3):459–464. doi: 10.3980/j.issn.2222-3959.2015.03.05. [DOI] [PMC free article] [PubMed] [Google Scholar]
- 13.Ameeduzzafar, Ali J, Bhatnagar A, Kumar N, Ali A. Chitosan nanoparticles amplify the ocular hypotensive effect of cateolol in rabbits. Int J Biol Macromol. 2014;65:479–491. doi: 10.1016/j.ijbiomac.2014.02.002. [DOI] [PubMed] [Google Scholar]
- 14.Bhagav P, Trivedi V, Shah D, Chandran S. Sustained release ocular inserts of brimonidine tartrate for better treatment in open-angle glaucoma. Drug Deliv Transl Res. 2011;1(2):161–174. doi: 10.1007/s13346-011-0018-2. [DOI] [PubMed] [Google Scholar]
- 15.Best M, Rabinovitz AZ, Masket S. Experimental alphachymotrypsin glaucoma. Ann Ophthalmol. 1975;7(6):803–810. [PubMed] [Google Scholar]
- 16.Khuri CH. Argon laser induced glaucoma in rabbits. J Med Liban. 1974;27(5):567–574. [PubMed] [Google Scholar]
- 17.Johnson B, House P, Morgan W, Sun X, Yu DY. Developing laser-induced glaucoma in rabbits. Aust N Z J Ophthalmol. 1999;27(3–4):180–183. doi: 10.1046/j.1440-1606.1999.00183.x. [DOI] [PubMed] [Google Scholar]
- 18.Gherezghiher T, March WF, Nordquist RE, Koss MC. Laser-induced glaucoma in rabbits. Exp Eye Res. 1986;43(6):885–894. doi: 10.1016/0014-4835(86)90067-9. [DOI] [PubMed] [Google Scholar]
- 19.Chen H, Wei X, Cho KS, Chen G, Sappington R, Calkins DJ, Chen DF. Optic neuropathy due to microbead-induced elevated intraocular pressure in the mouse. Invest Ophthalmol Vis Sci. 2011;52(1):36–44. doi: 10.1167/iovs.09-5115. [DOI] [PMC free article] [PubMed] [Google Scholar]
- 20.Urcola JH, Hernández M, Vecino E. Three experimental glaucoma models in rats: comparison of the effects of intraocular pressure elevation on retinal ganglion cell size and death. Exp Eye Res. 2006;83(2):429–437. doi: 10.1016/j.exer.2006.01.025. [DOI] [PubMed] [Google Scholar]
- 21.Sappington RM, Carlson BJ, Crish SD, Calkins DJ. The microbead occlusion model: a paradigm for induced ocular hypertension in rats and mice. Invest Ophthalmol Vis Sci. 2010;51(1):207–216. doi: 10.1167/iovs.09-3947. [DOI] [PMC free article] [PubMed] [Google Scholar]
- 22.Yang Q, Cho KS, Chen H, Yu D, Wang WH, Luo G, Pang IH, Guo W, Chen DF. Microbead-induced ocular hypertensive mouse model for screening and testing of aqueous production suppressants for glaucoma. Invest Ophthalmol Vis Sci. 2012;53(7):3733–3741. doi: 10.1167/iovs.12-9814. [DOI] [PMC free article] [PubMed] [Google Scholar]
- 23.Khan AK, Tse DY, van der Heijden ME, Shah P, Nusbaum DM, Yang Z, Wu SM, Frankfort BJ. Prolonged elevation of intraocular pressure results in retinal ganglion cell loss and abnormal retinal function in mice. Exp Eye Res. 2015;130:29–37. doi: 10.1016/j.exer.2014.11.007. [DOI] [PMC free article] [PubMed] [Google Scholar]
- 24.Ji M, Miao Y, Dong LD, Chen J, Mo XF, Jiang SX, Sun XH, Yang XL, Wang Z. Group I mGluR-mediated inhibition of Kir channels contributes to retinal Müller cell gliosis in a rat chronic ocular hypertension model. J Neurosci. 2012;32(37):12744–12755. doi: 10.1523/JNEUROSCI.1291-12.2012. [DOI] [PMC free article] [PubMed] [Google Scholar]
- 25.Fedosov EV, Ambaryan AV, Mal'tsev AN, Karaman NK, Kotenkova EV. Influence of the Mother on the Behavior of Young Rabbits during the Prepubertal Period. Izv Akad Nauk Ser Bio. 2015;(6):617–626. [PubMed] [Google Scholar]
- 26.Inman DM, Sappington RM, Horner PJ, Calkins DJ. Quantitative correlation of optic nerve pathology with ocular pressure and corneal thickness in the DBA/2 mouse model of glaucoma. Invest Ophthalmol Vis Sci. 2006;47(3):986–996. doi: 10.1167/iovs.05-0925. [DOI] [PubMed] [Google Scholar]
- 27.Livak KJ, Schmittgen TD. Analysis of relative gene expression data using real-time quantitative PCR and the 2[-Delta Delta C(T)] method. Methods. 2001;25(4):402–408. doi: 10.1006/meth.2001.1262. [DOI] [PubMed] [Google Scholar]
- 28.Rao VR, Krishnamoorthy RR, Yorio T. Endothelin-1, endothelin A and B receptor expression and their pharmacological properties in GFAP negative human lamina cribrosa cells. Exp Eye Res. 2007;84(6):1115–1124. doi: 10.1016/j.exer.2007.02.010. [DOI] [PubMed] [Google Scholar]
- 29.Cho KJ, Kim JH, Park HY, Park CK. Glial cell response and iNOS expression in the optic nerve head and retina of the rat following acute high IOP ischemia-reperfusion. Brain Res. 2011;1403:67–77. doi: 10.1016/j.brainres.2011.06.005. [DOI] [PubMed] [Google Scholar]
- 30.Zhang S, Wang H, Lu Q, Qing G, Wang N, Wang Y, Li S, Yang D, Yan F. Detection of early neuron degeneration and accompanying glial responses in the visual pathway in a rat model of acute intraocular hypertension. Brain Res. 2009;1303:131–143. doi: 10.1016/j.brainres.2009.09.029. [DOI] [PubMed] [Google Scholar]
- 31.Vidal L, Diaz F, Villena A, Moreno M, Campos JG, Pérez de Vargas I. Reaction of Müller cells in an experimental rat model of increased intraocular pressure following timolol, latanoprost and brimonidine. Brain Res Bull. 2010;82(1–2):18–24. doi: 10.1016/j.brainresbull.2010.02.011. [DOI] [PubMed] [Google Scholar]
- 32.Tezel G, Chauhan BC, LeBlanc RP, Wax MB. Immunohistochemical assessment of the glial mitogen-activated protein kinase activation in glaucoma. Invest Ophthalmol Vis Sci. 2003;44(7):3025–3033. doi: 10.1167/iovs.02-1136. [DOI] [PubMed] [Google Scholar]
- 33.Ueno A, Tawara A, Kubota T, Ohnishi Y, Inomata H, Solomon AS. Histopathological changes in iridocorneal angle of inherited glaucoma in rabbits. Graefes Arch Clin Exp Ophthalmol. 1999;237(8):654–660. doi: 10.1007/s004170050293. [DOI] [PubMed] [Google Scholar]
- 34.Lütjen-Drecoll E, Schenholm M, Tamm E, Tengblad A. Visualization of hyaluronic acid in the anterior segment of rabbit and monkey eyes. Exp Eye Res. 1990;51(1):55–63. doi: 10.1016/0014-4835(90)90170-y. [DOI] [PubMed] [Google Scholar]
- 35.March WF, Gherezghiher T, Koss M, Nordquist R. Ultrastructural and pharmacologic studies on laser-induced glaucoma in primates and rabbits. Lasers Surg Med. 1984;4(4):329–335. doi: 10.1002/lsm.1900040405. [DOI] [PubMed] [Google Scholar]


