

Abstract
Human-induced pluripotent stem cell-derived cardiomyocytes (hiPSC-CM) raise many possibilities for cardiac research but they exhibit an immature phenotype, which influences experimental outcomes. The aim of our research is to investigate the effects of a topographical gradient substrate on the morphology and function of commercially available hiPSC-CM. The lateral dimensions the microgrooves on the substrate varied from 8 to 100 μm space between the 8 μm grooves on one axis and from ∼5 nm to ∼1 μm in depth on the other axis. Cells were seeded homogeneously across the substrate and according to the manufacturers protocols. At days 4 and 10, measures of eccentricity, elongation, orientation, sarcomere length (SL), and contractility of the hiPSC-CM were taken. Only the deepest and widest region (8–30 μm wide and 0.85–1 μm deep) showed a significantly higher percentage of hiPSC-CM with an increased eccentricity (31.3 ± 6.4%), elongation (10.4 ± 4.3%), and orientation (<10°) (32.1 ± 2.7%) when compared with the control (flat substrate) (15.8 ± 5.0%, 3.4 ± 2.7%, and 10.6 ± 1.1%, respectively). Additionally, during stimulus-induced contraction, the relaxation phase of the twitch was prolonged (400 ms) compared to nonelongated cells (200 ms). These findings support the potential use of dual microgradient substrates to investigate substrate topographies that stimulate migration and/or maturation of hiPSC-CM.
Keywords: hiPSC-CM, cardiac regeneration, microgrooves, topography, biomaterial, functionality
Introduction
The adult heart has one of the lowest regenerative capacities of the human body.1,2 Because of the low number of cardiac progenitor cells present in the heart, the tissue is not capable of self-renewal after scar formation caused by injury, like myocardial infarction (MI). As a consequence, the pump function of the heart dramatically decreases, which can lead to heart failure.3 Therefore, it would be ideal to induce heart tissue regeneration after injury to prevent the continuous development of heart failure.3
New techniques and knowledge regarding regenerative medicine and tissue engineering can contribute to new treatments for heart failure and are based on either preventing scar formation or regenerating the infarcted myocardium into functional cardiac tissue.1 These regenerative strategies are based on supplementing the heart with biochemicals,4 biomaterials or cells,1,5−7 or a combination of those8 to stimulate tissue regeneration within the heart, aiming on improving its functionality or the prevention of heart failure. Unfortunately, primary human cardiac myocytes and cardiac progenitor cells are severely limited,1 therefore researchers look to other cell sources, such as xenogeneic cells and tissues. The knowledge gained from animal studies has successfully been used for understanding human pathologies; however, cardiac physiology in animals, especially rodents, differs vastly from human cardiac physiology.9 In addition to this, the clinical translation of xenogeneic tissues is limited and could cause major side effects. These issues underline the importance of another human cell source for cardiac regeneration.
The discovery of induced pluripotent stem cells (iPSC), raised many possibilities for the scientific field to overcome the aforementioned problems.10 iPSC are derived from somatic cells, which regained pluripotent stemness after transfection with specific genes (c-Myc, Oct3/4, Sox2 and Klf4)10 and have many advantages over immortal cell-lines, human primary cells and xenogeneic lines. First, the cells are harvested in a noninvasive way and can therefore provide for a theoretically unlimited cell source. Second, the cells could be harvested from the patient and used for personalized drugs screens and treatments, possibly preventing unnecessary complications. And third, iPSC could be remodelled to an inherited disease cell-line to reveal underlying pathogenic mechanisms.11 These models could partly replace animal models for ethical and economical reasons.12
Recently, different companies made human iPSC-derived cardiomyocytes (hiPSC-CM) commercially available. The benefits of these commercially available cells are their reliability and comparability to previous nonclinical in vitro and in vivo studies.12,13 Additionally, commercial available cells can be maintained in cell culture for at least 42 days post-thaw, allowing studies involving chronic interventions.14
Although current results are promising, hiPSC-CM do not exhibit the adult genotype, phenotype and functionality.14,15 Studies on iPSC-CM functionality revealed that the excitation-contraction coupling (ECC) mechanisms, the action potentials and the calcium transients of the iPSC-CM are comparable to the physiological properties of CM in the developing heart, but not to adult CM.14 In addition to this, the morphology of iPSC and hiPSC-CM is different compared to adult CM. Native adult CM have a cylindrical morphology, with a length/width ratio of 1:5–1:9 and an anisotropic distribution of myofilaments.16−18 In contrast to this, hiPSC-CM have a circular morphology with an isotropic filament organization and therefore an immature contractility pattern.17 The differential state of the CM will influence experimental outcomes, which underlines the necessity to differentiate hiPSC-CM toward an adult CM phenotype. Theoretically, increasing the elongation of hiPSC-CM will enhance myofilament organization and in turn contractility and functionality as well.17 In addition to this, native adult cells are aligned within the cardiac tissue to gain optimal contractility capacity, suggesting that cell orientation is key as well.
One way to induce iPSC-CM elongation and orientation is by topographical cues.17,19,20 Different topographical cues have been tested already to increase hiPSC-CM elongation, like micropatterned substrates,21 substrate stiffness,17 and microgrids.19,20 However, the ideal spacing and depth combination of a microtopography to mature hiPSC-CM has not been examined yet. Therefore, in this study we use a dual microgradient22 that has an increasing depth (∼5 nm to ∼1 μm) on one axis and spacing (8–100 μm) on the other axis as a substrate to influence the hiPSC-CM phenotype. Because the topography concerns a dual microgradient, every point on the substrate differs from another point in depth and/or spacing. In this way, the ideal depth-spacing combination can easily be examined on a single substrate.
Materials and Methods
Substrate Fabrication
Dual microgradients were made according to the following protocol. To define the spacing, silicon substrates were coated with Shipley S1818 photoresist and soft baked prior to UV exposure. A chrome mask with 8 μm wide lines and an increasing pitch (0.5 μm/pitch) was used to pattern the resist. After patterning, an aluminum layer was evaporated and lift-off used to define a hard mask for the subsequent etch. To obtain a secondary pattern (depth), we performed controlled diffusion of plasma-polymerized hexane (ppHex)23 parallel to the predefined aluminum grating, using a diffusion mask to obtain a thickness gradient. Using dry etching, the depth gradient was then transferred into the silicon substrate. From this silicon substrate, a polymer inlay was made prior to injection molding.24 The depth range was from less than 5 nm to over 1 μm. The total surface area of the microgradient was 10 × 10 mm2 on a 21 × 21 mm2 substrate. After injection molding the substrates were briefly exposed to a pure oxygen plasma to enhance cell attachment. A detailed description of the substrate fabrication process can be found in Reynolds et al. 2012.22
Substrates were sterilized using 70% EtOH and rinsed twice with sterile water, followed by UV-irradiation for 2 h. The substrates were then transferred to a 6-well plate and UV-irradiated again for a minimum of 30 min. Figure 1 shows a schematic description of the dual microgradient layout. The regions of interest are described as following: wide-deep (WD), ∼80–100 μm spacing, and ∼0.85–1 μm deep. Upper right: narrow-deep (ND), ∼8–30 μm spacing, and ∼0.85–1 μm deep. Center: ∼50 μm spacing and 0.5 μm deep. Lower left: wide-shallow (WS), ∼80–100 μm spacing, and ∼5–150 nm deep. Lower right (NS): narrow-shallow, ∼8–30 μm spacing, and ∼5–150 nm deep. The corresponding aspect ratios (depth:spacing) are calculated according by the average depth and spacing of every region. WD, 0.9/90 = 0.01; MD, 0.9/50 = 0.018; ND, 0.9/20 = 0.045; WM, 0.5/90 = 0.0056; center, 0.5/50 = 0.01; NM, 0.5/20 = 0.025; WS, 0.1/90 = 0.0011; MS, 0.1/50 = 0.002; NS, 0.1/20 = 0.005.
Figure 1.

Schematic illustration of the dual microgradient. Here the depth (vertically) and spacing between the microgrooves (horizontally) change continuously from ∼5 nm to ∼1 um and 8–100 um, respectively. For analysis, 9 regions were made, representing the areas with a higher, middle and lower depth and width. W = wide; M = middle; N = narrow; D = deep; S = shallow; C = center. The whole area is 1 cm × 1 cm. The figures on the sides show how the distance between the grooves and the depth of the grooves change. Sizes of all figures are not representative.
hiPSC-CM Cell Culture
Human induced pluripotent stem cells - cardiomyocytes (hiPSC-CM) were obtained from Cellular Dynamics International Inc. (CDI) iCell2 batch (CMC-100–012–001-PT, CDI). Cells were stored in liquid nitrogen until use and the thawing protocol was performed according to the manufacturer, including different medium for plating (CMM-100–110–001, CDI) and maintenance of the cells (CMM-100–120–001, CDI). To both media, 0.5 μL gentamicin (15750–060, Gibco) per ml media was added. A total volume of 450 μL of cell suspension was used per substrate with a precalculated concentration to obtain a final cell density of 10,000 cells/cm2, extra care was taken ensuring the cells were evenly seeded. After 4 h, 3 mL of maintenance medium was added to every well of the 6 well plate. Maintenance medium was refreshed every other day by removing 1 mL medium and adding 1 mL of fresh maintenance medium supplemented with gentamicin. Prior to every medium change the fresh medium was preheated to 37 °C. Cells were kept in culture up to 10 days at which they start to beat and according to the manufacturer should be fully matured.An earlier time point, 4 days, was also included to follow the development. The hiPSC-CM were stained and fixed at both time points.
Contractility Measurements
On days 4 and 10, videos of single cells were made at a sampling rate of 100 frames/second for 10 s in different regions of the substrate. During recordings, the 6 well plate was put in an on-stage incubator with 5% CO2 and 37 °C. Camera: Hamamatsu ORCA-flash4.0 V2 digital CMOS camera C11440–22CU; Microscope: Olympus IX71; Objective: Olympus, 40x air, NA 0.60.
An image stack was made using ImageJ 1.50a, after which an algorithm calculated the contractility trace, based on differences in pixel intensity over time.25 The different transients within this trace were then averaged and variables such as time-to-peak (TTP) and contraction duration 50% (CD50) could be calculated.
As the images were made from single cells and differed in size and shape, the pixel intensity and amplitude varied between each acquired sequence. As a consequence the calculated amplitude was not representative and has not been used in this study.
Immuno-histochemistry
After contractility measurements, the cell membrane was stained for 10 min with wheat germ agglutinin (WGA)-Alexa 594 (W11262, Invitrogen), diluted 1:100 in 1% BSA/PBS (A7030–10G, Sigma). After washing the cells for 3x 10 min in PBS, cells were fixed for 10 min in 2% paraformaldehyde and washed again for 3x 10 min in PBS. Then the cells were permeabilized in 0.2% Triton-X (T-9284, Sigma) dissolved in 1% BSA/PBS, and washed for 10 min in PBS. For epitope blocking 10% goat serum dissolved in 1% BSA/PBS was used. After washing 1x in 1% BSA/PBS, the primary antibody for α-actinin (rabbit-anti-α-actinin, ab137346, Abcam) was added and samples were incubated overnight (ON) at 4 °C. Primary antibody was used in a concentration of 1:50, diluted in 3% goat serum/1% BSA/PBS. The next day, cells were washed in 1% BSA/PBS, where after secondary antibody (Dialight-488 goat-antirabbit, 35552, Thermo Fisher) was added in a concentration of 1:200 diluted in 1% BSA/PBS for 90 min at room temperature (RT). After washing in PBS for 3x 10 min, diamidino-2-phenylindole (DAPI)(62247, Life Technologies) was diluted 1:106 in PBS and added for 2 min. Then, cells were washed with PBS and substrates were mounted in Vectashield for fluorescence (ZA0825, Vector) and #1 coverslips were used. Nail polish prevented the mounting medium to disperse.
Confocal Microscopy
To visualize the microfilament organization inside the cells, images of WGA-, α-actinin- and DAPI-stained samples were taken on a spinning disc confocal microscope (X-light; Crest Optics) with a pinhole of 350 μm. A 100x oil objective was used with a numerical aperture (NA) of 1.45. Images were 74.55 μm wide, 74.55 μm high and z-range varied between 16.2 and 17.4 μm. Voxel width, height and depth were 145.6 nm, 145.6 and 300 nm, respectively. The lasers used for the different fluorescent stains were 561 nm, 488 and 405 nm for WGA, α-actinin and DAPI, respectively. Microvolution deconvolution software was used in combination with ImageJ/Java 1.494 to deconvolve the images. In addition to this, we performed blind deconvolution, using 15 iterations and 5% background correction. Further, the length of a cluster of sarcomeres (N = 16) was measured within single cells using ImageJ 1.50a and divided by the number of sarcomeres within this cluster to obtain an average sarcomere length.
Data acquisition
Image Analysis
Whole-gradient images were made using an EVOS Auto FL imaging system (Life Technologies). Nine ×12 images were collected to cover the whole gradient using a 10x objective with an NA of 0.30 and a working distance of 1.2 mm. Images of DAPI stained nuclei, WGA stained membranes and bright field images were loaded into CellProfiler (version 2.1.1, http://cellprofiler.org/) for analysis. The following morphological cell properties measured were: orientation, cell area, major axis length, minor axis length and perimeter. Different pipelines were tested until the right settings were found. Out of focus images and errors in the datasheet were excluded from the database. Quality control criteria were based on minor axis (<6 or >130), major axis (<40 or >250), form factor (<0.028) and area size (<650 or >18000). Examples of CellProfiler image analysis can be found in supplementary Figure 1. The imaging sequence covering the whole gradient was the same for every sample. Some of the images were selected and grouped to represent the different regions (supplementary Figure 2).
For the control samples an algorithm was used to calculate random numbers from 1 to 108 to select a total of 48 images divided over 2 (day 4) or 4 (day 10) samples, representing the control group per time point. Due to an incidence of out-of-focus images, not all groups are represented by the same number of images. A description of the amount of gradients, images and cells per group is shown in supplementary table 1.
Cell Density Profile (heatmap)
Using ImageJ 1.50a, channels from the whole-gradient images were split, where after only the Texas Red channels were kept to create a heat map. Then, a z-stack was made, based on the average intensity. Brightness was adjusted and kept similar between stacks of each time point. Finally, a heat map was made using the “cool” lookup table from ImageJ 1.50a and corresponding scale bar.
Statistical Analysis
Graphpad Prism 6.0c was used to do statistical analysis. Data represents the mean with standard deviation. For cell shape and orientation, Two-way ANOVA tests were done, where the means of every group were compared to the mean of the control group. Statistical analysis within the control group was performed using a One-way ANOVA, where the mean of every group was compared to the mean of every other group. A Bonferroni-test was used for multiple comparisons. For contractility One-way ANOVA tests were performed, however for variables CD90, CD10 and Dn90 a Kruskall-Wallis test was done due to non-normal distribution of the data. In addition to this, all groups were compared to every other group. A Bonferroni-test and Dunn’s test were done for multiple comparisons after the One-way ANOVA and Kruskall-Wallis test, respectively. A P-value of <0.05 was considered significant. * = P < 0.05; ** = P < 0.01; *** = P < 0.001; **** P < 0.0001.
Results
For all the experiments, the cell seeding density was kept low to ensure cell–substrate interaction and limit cell–cell contacts. As shown in Figure 2, the microgradient induces the formation of regions with a higher cell density (hotspots) over time. At all time points, the cell density is highest in the center of the gradient, which is about 50 μm wide and 0.5 μm deep. In contrast, no hotspots are seen on the control samples. This implies that both the seeding protocol ensures uniform cell coverage and that the gradient stimulates cell migration over the gradient with cells preferring the geometric dimensions of the center region. Similar observations were seen with various cell types in the study of Reynolds et al.22
Figure 2.

(A) Heatmap and (B) graphical representation of cell density on the dual microgradient versus control samples, on day 4 and day 10. Higher cell densities (hotspots) were seen in the center of the microgradient on both days (A). No hotspots were seen for the control group on both days (A). For both days, cell density is significantly higher when the distance between the grooves is between 80 and 70 μm and when about 0.5 μm deep (gradient middle), compared to all other groups (B). * = gradient middle is significantly different with all other groups; § = gradient middle is significantly different with only gradient shallow and control shallow. For the control and gradient, N = 2 and N = 3 for day 4 and N = 4 and N = 6 for day 10, respectively. Unfortunately, data representing the group 8–28 μm on day 4 is missing.
Orientation
As alignment is a good indicator of myocardiac development, CellProfiler was used to analyze cells in different regions of the substrate. Focusing on the cellorientation, clear differences are observed between the ND region (8–30 μm wide and 850–1000 nm deep) and the control sample (Figure 3). On both day 4 and day 10, approximately 30% of the cells have an orientation angle of less than 10 degrees calculated from the grid’s direction (30.1 ± 7.9% and 32.1 ± 2.7%, respectively). For the control, this was 9.5 ± 0.6% on day 4 and 10.6 ± 1.1% on day 10. As expected from a flat surface, the orientation in the control group showed a random orientation. All segments within control group contained approximately 11% of the cells and were not significantly different from each other. Further, the WD region (80–100 μm wide and 850–1000 nm deep) and the center region (around 50 μm wide and 0.5 μm deep) were significantly different compared to the control group, however, less than the ND region. This indicates that the cell sense the topography and increase the alignment in narrower and deeper regions. Note that the region with a higher percentage of aligned cells is not the same region favored by cells via migration (Figure 2).
Figure 3.

hiPSC-CM orientation measured from the groove direction on (A) day 4 (N = 3) and (B) day 10 (N = 6). Every bin represents 10°, e.g. the first bin on the left represents % of cells orientated 0–10° from the grid’s orientation. Significant differences in orientation are seen in narrow-deep (ND) area (red line) compared to the control group (dotted line) at day 4 and day 10. Also the wide-deep (WD) area was significantly different compared to the control group on day 10 (indicated with §).
Cell Shape
Two variables to assess cell shape are eccentricity and elongation. Both variables were measured using CellProfiler image analysis software as well. Eccentricity (e) is the distance between the foci of the best-fitted ellipse around the cell, divided by the major axis length of the same ellipse. A perfect circle would have e = 0, whereas a line would be e = 1. As shown in Figure 4A, no significant difference is seen between all groups on day 4. Additionally, for all groups the majority of the cells have an eccentricity of 0.8–0.85. On day 10, most groups show the same distribution as on day 4, however for only the ND region the peak was shifted toward a higher eccentricity (Figure 4B). This shift results in a significantly larger group of cells with a higher eccentricity in the ND area as compared to the control sample. This is shown in Figure 4D, only the ND region is significantly different compared to the control group, where the other groups are not. To be more specific, 31.3 ± 6.4% of the cells in the ND area have an eccentricity between 0.9 and 1.0, whereas this value is between 14.2 ± 4.0% and 20.0 ± 5.3% for the other groups. Therefore, the topography in the ND area not only influences cell orientation, but also cell shape.
Figure 4.

Eccentricity of hiPSC-CM on (A, C) day 4 and (B, D) day 10. Data are plotted in % of total amount of hiPSC-CM per group. Graphs A and B represent all data on day 4 and day 10, whereas graphs C and D represent data from elongated cells on those days. No significance was seen between any test group and the control on day 4 (A and B). On day 10 only the narrow-deep (ND) area showed a significant increase in amount of elongated hiPSC-CM compared to the control.
To be able to compare the cell shape with adult CM-like values, we calculated the elongation i.e. the major axis of the cell, divided by the minor axis. According to the literature, adult cells have a length/spacing ratio around 5:1.26 More exactly, the length of an adult human cardiomyocyte lies between 60 and 140 μm and the cell width lies between 17 and 25 μm.16 Ratios of the larger values and smaller values result in 17/60 = 0.283 and 25/140 = 0.179, respectively. Cells with a ratio smaller than 0.283 or with a ratio between 0.179 and 0.283 can be considered to have an adult-like proportion. As shown in Figure 5, the ND area again has a significantly increased percentage of elongated cells compared to the control group, but only at day 10 (Figure 5B and5D). The percentage of elongated cells in the ND area is 10.4 ± 4.3%, compared to 3.4 ± 2.7% in the control group. Cells in other regions do not differ significantly in cell shape as compared to the control group. On day 4 no significance was seen, which implies that the hiPSC-CM need more time to elongate. In conclusion, only the ND topography results in both aligned and elongated cells compared to all the other topographical regions and the control group.
Figure 5.

elongation of hiPSC-CM on (A, C) day 4 and (B, D) day 10. Data are plotted in % of total amount of hiPSC-CM per group. Graphs A and B represent all data on day 4 and 10, whereas graphs C and D represent data from elongated cells on those days. No significance was seen between any test group and the control on day 4 (A and B). On day 10, only the narrow-deep (ND) area showed a significant increase in percentage of hiPSC-CM with adult-like elongation compared to the control group.
Additionally, the aspect ratio (AR) (depth/spacing), like used in previous studies,27,28 is plotted against the orientation, eccentricity, and elongation of hiPSC-CM in Figures 6A,6B and6C, respectively. In those figures, a clear trend can be observed where the increase of the AR results in a higher percentage of aligned cells (Figure 6A), and cells with a higher eccentricity (Figure 6B) and elongation (Figure 6C). This trend is strongest when the cells are cultured for 10 days.
Figure 6.

AR plotted against the (A) orientation, (B) eccentricity, and (C) elongation of hiPSC-CM on day 4 and day 10. F represents the control samples, which are flat substrate, so the AR could not be calculated here. A strong trend is seen for the orientation of the cells on day 10 in relation to the AR (A), with a higher percentage of aligned cells when the AR increases. Similar trends, yet with a smaller R2, are seen for the eccentricity (B) and elongation (C) on day 10 and for the orientation on day 4 (A). For the eccentricity (B) and elongation (C) on day 4, the percentages of cells did not change when the AR increased. The calculation of the AR of every region is explained in Figure S2.
Sarcomere Length
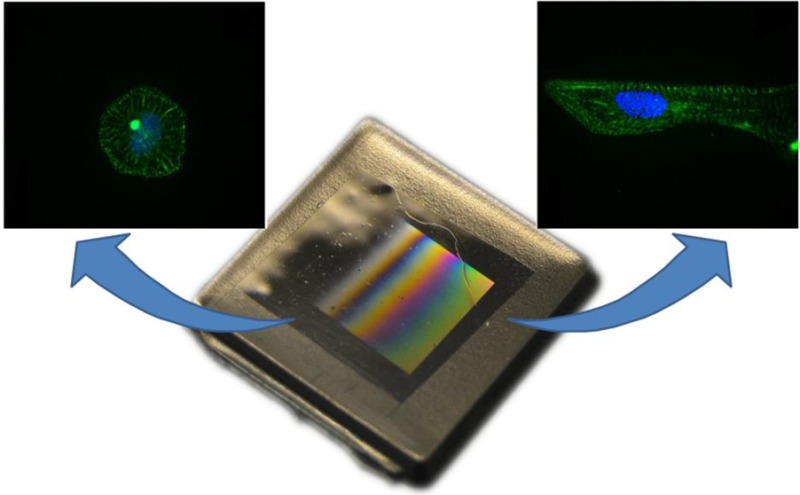
From α-actinin stained samples, confocal images were made and sarcomere length (SL) was calculated. Elongated cells in the ND region contained myofilaments that were aligned with the cell’s major axis (Figure 7). From 16 images the average SL was calculated and appeared to be 1.80 ± 0.15 μm. This value lies in between the average SL for hPSC-CM, hiPSC-CM and mature mammalian CM, which are ∼1.65 μm,26 ∼ 1.5 μm29 and ∼2.0 μm,30,31 respectively.
Figure 7.
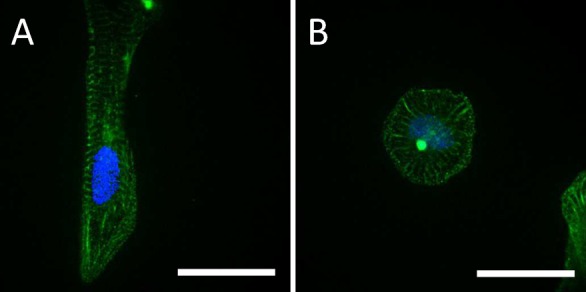
hiPSC-CM cultured on (A) ND-microgrooves and on (B) a flat substrate. Bar represents 25 μm.
Contractility
To assess whether either the elongated shape of the cells and/or the topography have an effect on the contractility, we examined the contractility patterns of cells located in the ND area and compared them with contractility of cells from the control group. Within both groups, we separated the cells with (elongated = E) and without (not elongated = NE) an axis-ratio smaller than 0.283. Figure 8A shows one representable trace of every group. This graph clearly shows the difference in contractility between the groups. Contractility analysis resulted in no significant differences in Up90 and time to peak (TTP) between any of the groups (Figure 8A and supplementary Figures 3B and 3C). However, significance is seen for the decay phase of the transient (Figure 8B), between the ND-E and the ND-NE group (P < 0.05) and between the ND-E and the control-NE group (P < 0.01). For the ND-E group, the mean Dn90-value is almost double (∼400 ms) compared to the other groups (200–250 ms). This result implies that the shape of the hiPSC-CM prolongs the decay phase of the transient, but does not influence the upstroke.
Figure 8.

(A) Contractility measurements of elongated (E) and nonelongated (NE) cells in the ND area versus the control. Only for the elongated cells in the ND area, a prolonged relaxation phase was seen, compared to all other three groups. (B) Statistical analysis shows that the decay phase of these cells is significantly prolonged compared to the NE-cells in both the control and ND group. (C) Dn90 variable is explained. (D) Histogram showing the frequency of elongated cells used from the ND area (black bars, N = 60) and the control area (gray bars, N = 40)(D). For the ND area, a shift is seen toward a higher frequency of elongated cells.
Further analysis of the transients’ shape included calculation of contraction duration (CD) 25%, CD50%, CD75% and CD90%, which are time intervals between the contractility- and refraction-period on 25%, 50%, 75% and 90% of the TTP, respectively (supplementary Figures 3 × 10⁻³I). These results show that the delay in the transients’ decay is not yet present for CD90, but is present at CD75 and is maintained through CD50, CD25 and CD10. This delay is only visible for the ND-E group compared to the ND-NE and control-NE groups. Although a slower relaxation is in line with maturation of hiPSC,15,32 underlying mechanisms for these results are not known.
Despite the mean of the control-E group is comparable to the control-NE group, no significance was seen between the control-E group and any other group. The number of elongated cells in the control group is very low (N = 6), which weakens the statistical analysis for this group and this might explain the lack of significant results for this group. A power calculation resolved that a sample size of 12 was needed to gain statistical significance with 80% power and an α error probability of 0.05. This means we cannot compare the control-NE group with the other groups and therefore we cannot say whether the delay in the relaxation phase is caused by either the cell shape and/or the micropattern.
Discussion
Human iPSC-CM are promising for cardiac regeneration1 and high-throughput drugs-screenings.33 However, forward programming strategies have not yet been successful in differentiating the hiPSC toward an adult-like cardiomyocyte phenotype. During this study we tried to mature hiPSC-CM using topographical cues using a dual microgradient, assessing the cell shape and functionality. The dual microgradient is unique as every location on the substrate represents a combination of the groove depth and distance between the grooves (spacing).
The most important finding of our study is that the topography in the ND region, which is 8–30 μm wide and 850–1000 nm deep, altered the contraction duration of the elongated cells. More specifically, the contractility timecourse was prolonged in only the elongated cells in the ND area, compared to the other groups. This observation is in line with the differentiation process of stem cells.26,32,34 We tried to assess underlying mechanisms, via voltage and calcium measurements, using fluorescent dyes, however, due to the low cell density in combination with the thick plastic of the substrate prevented adequate signals being recorded. Therefore, the cause of the delay during the contraction decay is not yet clear. Nonetheless, there could be four reasons to explain the prolongation of the contraction duration: 1) the action potential duration (APD) is prolonged due to increased Ca2+ influx via L-type Ca2+ channels, this would slow the rate of decline on the intracellular calcium signal and thereby prolong the contraction phase;35,36 2) in the presence of a normal APD the calcium transient is prolonged as a consequence of altered sarcoplasmic reticulum activity,37 prolonging the contractile relaxation phase; 3) the calcium sensitivity of myofilaments is altered such that in the face of an unchanged intracellular calcium signal the myofilament response is prolonged;38 4) the amplitude of contraction trace was higher for the elongated cells thus the decline from the peak would occur over a longer time scale. Other groups found that iPSC-CM cultured on microgrooved substrates displayed a significantly improved Ca2+ cycling and a more organized SR Ca2+ release in response to caffeine, suggesting that SR Ca2+ cycling properties can be influenced by culture conditions.20,39 Additionally, Ribeiro et al. found that calcium flux in hiPSC-CM cultured on patterned substrates propagates anisotropically along the major axis, but is isoptropic in unpatterned cells.17
Although the specific reason for an altered contractility pattern is not yet established for our experiment, we found that elongated hiPSC-CM contained a more anisotropic myofilament organization compared to nonelongated cells within the control group, which had an isotropic myofilament organization. Myofilament organization is related to contractile forces of the cell30,31 and may therefore possibly cause the altered contractility pattern.
Other findings of our study indicate that in the ND area, cells are more elongated and orientated along the grooves’ direction. When seeded on the substrates, cells spread on the surface and adapt a circular cell shape, which is consistent with a stem-cell phenotype.17,20,26,40 However, only in ND area, significantly more cells are elongated compared to the control group on day 10. Additionally, cells in the same region are more orientated along the groove direction. Interestingly, not all hiPSC-CM have an elongated shape or are aligned along the grids. This implies that the feature size is not yet optimal and that in the future the features might have to be deeper and/or narrower to mature and orientate all cells. During our experiments, the maximum depth on the substrate was >1 μm, while other experiments have used substrates with grids of 3 μm19 and 4 μm20 deep. In addition to this, the spacing of their substrates was 10 μm and therefore similar to the narrowest spacing and grooves on our substrate.19,20 Their results were comparable to ours; more cells were elongated and orientated on the structured substrates compared to flat surfaces, but whether the percentage of elongated and orientated cells is higher during those studies is not clear. Using a dual microgradient, we showed that features have to be less than 20 μm wide and between 0.85 and 1 μm deep to increase the orientation, eccentricity and elongation of hiPSC-CM. In addition to this, we found that an increase in AR increases alignment, elongation and eccentricity of hiPSC-CM, what is in line with previous studies using different ARs and celltypes.27,28 Wong et al.28 found that an AR of 1 resulted in 100% alignment of human mesenchymal stromal cells (hMSCs) on the substrate. This implies that the relation between the depth and spacing between the grooves is essential to achieve optimal cell behavior.
During these experiments, hiPSC-CM stayed in culture for a maximum of 10 days, according to the manufacturer’s instructions. However, it has been shown that the cardiac gene expression in first generation CDI hiPSC-CM is optimal at day 14 and stabilizes at a certain cardiac gene expression level that is maintained until day 42.41 In addition to this, fetal gene expression diminished in older cells.15 This suggests that hiPSC-CM might exhibit a more adult-like phenotype when cultured for a longer period than 10 days. So besides using a deeper and/or narrower substrate in the future, hiPSC-CM could be cultured for a longer period of time to improve hiPSC-CM maturation and to increase the number of cells that align and elongate. Also other studies show that the time frame is key for maturation of hiPSC-CM, according to a more mature calcium cycling and a more polarized resting membrane potential.15,32 In addition to this, being able to keep the hiPSC-CM in culture for at least 42 days could be important for future drugs screening purposes or chronic disease models.
During cell seeding, we made sure that the cells were seeded homogeneously and with a low cell density to prevent the formation of a confluent cell-layer. Nonetheless, on day 10 a relatively high cell density was observed in the center of the substrate, which has features of about 50 μm wide and 0.5 μm deep. This observation suggests that the features in the center region are favorable for the hiPSC-CM over other regions on the substrate. Possibly, hiPSC-CM could have migrated along the substrate toward a more favorable spot. Despite this, the hiPSC-CM situated in the center were neither significantly more elongated nor more aligned compared to the control group. One theory is that cells ignore the topography when cell–cell contact is sufficient. In the ND area, where the phenotype and contractility of the hiPSC-CM were more mature, the cell density was significantly lower. Adult cells do have a lower proliferation rate than stem cells. Interestingly, previous findings state that hiPSC-CM cultured on microgrooved substrates similar to the ND area, have a low proliferation rate.19 Therefore, the phenotype, contractility and low cell density of the hiPSC-CM in the ND area implies that those cells are more mature than cells in the other regions.
During this study we observed that microgrooves are sensed by hiPSC-CM, which results in a more structural and functional phenotype. More clearly, hiPSC-CM situated on the narrowest and deepest features of the dual microgradient developed into more elongated and orientated cells compared to the other regions and the control group. Also myofilament structure seemed more organized in the elongated cells. All together we can conclude that the microgradient differentiates the hiPSC-CM toward a more adult-like phenotype. However, the phenotype and physiology of the cells are not yet like adult CM, but exhibit a more intermediate stage. In addition to this, not all the cells cultured in the same region are elongated or aligned. Therefore, more research has to be done to improve hiPSC-CM maturation and establish this for all cells on the substrate. For future experiments it will be interesting to see whether even deeper and narrower features will have a bigger effect on hiPSC-CM maturation. Besides, dual microgradients could be replaced by single micro- or nanogradients. Further, substrates without a gradient, but with only 1 depth and 1 spacing size, would be ideal for monolayer culture, which would result in a significant mass of uniform population of cells facilitating both functional and molecular studies.
Acknowledgments
The authors thank the technical staff and other researchers at the James Watt Nanofabrication Centre and mechanical workshop at the University of Glasgow for their practical assistance, advice, and support. N.G. acknowledges BBSRC grant BB/K011235/1 and ERC funding through FAKIR 648892 Consolidator Award.
Supporting Information Available
The Supporting Information is available free of charge on the ACS Publications website at DOI: 10.1021/acsbiomaterials.6b00426.
Figures S1–S3 and Table S1 (PDF)
The authors declare no competing financial interest.
Supplementary Material
References
- Zhang Y.; Mignone J.; MacLellan W. R. Cardiac regeneration and stem cells. Physiol. Rev. 2015, 95 (4), 1189–1204. 10.1152/physrev.00021.2014. [DOI] [PMC free article] [PubMed] [Google Scholar]
- Mollova M.; Bersell K.; Walsh S.; et al. Cardiomyocyte proliferation contributes to heart growth in young humans. Proc. Natl. Acad. Sci. U. S. A. 2013, 110 (4), 1446–1451. 10.1073/pnas.1214608110. [DOI] [PMC free article] [PubMed] [Google Scholar]
- Mudd J. O.; Kass D. A. Tackling heart failure in the twenty-first century. Nature 2008, 451 (7181), 919–928. 10.1038/nature06798. [DOI] [PubMed] [Google Scholar]
- Fujii H.; Li S. H.; Wu J.; et al. Repeated and targeted transfer of angiogenic plasmids into the infarcted rat heart via ultrasound targeted microbubble destruction enhances cardiac repair. Eur. Heart J. 2011, 32 (16), 2075–2084. 10.1093/eurheartj/ehq475. [DOI] [PubMed] [Google Scholar]
- Shiba Y.; Fernandes S.; Zhu W. Z.; et al. Human ES-cell-derived cardiomyocytes electrically couple and suppress arrhythmias in injured hearts. Nature 2012, 489 (7415), 322–325. 10.1038/nature11317. [DOI] [PMC free article] [PubMed] [Google Scholar]
- Blin G.; Nury D.; Stefanovic S.; et al. A purified population of multipotent cardiovascular progenitors derived from primate pluripotent stem cells engrafts in postmyocardial infarcted nonhuman primates. J. Clin. Invest. 2010, 120 (4), 1125–1139. 10.1172/JCI40120. [DOI] [PMC free article] [PubMed] [Google Scholar]
- Clifford D. M.; Fisher S. A.; Brunskill S. J.; et al. Stem cell treatment for acute myocardial infarction. Cochrane Database Syst. Rev. 2012, 2, CD006536. 10.1002/14651858.CD006536.pub3. [DOI] [PubMed] [Google Scholar]
- Purcell B. P.; Elser J. A.; Mu A.; Margulies K. B.; Burdick J. A. Synergistic effects of SDF-1alpha chemokine and hyaluronic acid release from degradable hydrogels on directing bone marrow derived cell homing to the myocardium. Biomaterials 2012, 33 (31), 7849–7857. 10.1016/j.biomaterials.2012.07.005. [DOI] [PMC free article] [PubMed] [Google Scholar]
- Dixon J. B.; Raghunathan S.; Swartz M. A. A tissue-engineered model of the intestinal lacteal for evaluating lipid transport by lymphatics. Biotechnol. Bioeng. 2009, 103 (6), 1224–1235. 10.1002/bit.22337. [DOI] [PMC free article] [PubMed] [Google Scholar]
- Takahashi K.; Yamanaka S. Induction of pluripotent stem cells from mouse embryonic and adult fibroblast cultures by defined factors. Cell 2006, 126 (4), 663–676. 10.1016/j.cell.2006.07.024. [DOI] [PubMed] [Google Scholar]
- Ross S. B.; Fraser S. T.; Semsarian C. Induced pluripotent stem cells in the inherited cardiomyopathies: From disease mechanisms to novel therapies. Trends Cardiovasc. Med. 2016, 26, 663. 10.1016/j.tcm.2016.05.001. [DOI] [PubMed] [Google Scholar]
- Harris K.; Aylott M.; Cui Y.; Louttit J. B.; McMahon N. C.; Sridhar A. Comparison of electrophysiological data from human-induced pluripotent stem cell-derived cardiomyocytes to functional preclinical safety assays. Toxicol. Sci. 2013, 134 (2), 412–426. 10.1093/toxsci/kft113. [DOI] [PubMed] [Google Scholar]
- Nakamura Y.; Matsuo J.; Miyamoto N.; Ojima A.; Ando K.; Kanda Y.; Sawada K.; Sugiyama A.; Sekino Y. Assessment of testing methods for drug-induced repolarization delay and arrhythmias in an iPS cell-derived cardiomyocyte sheet: Multi-site validation study. J. Pharmacol. Sci. 2014, 124 (4), 494–501. 10.1254/jphs.13248FP. [DOI] [PubMed] [Google Scholar]
- Zhu W. Z.; Santana L. F.; Laflamme M. A. Local control of excitation-contraction coupling in human embryonic stem cell-derived cardiomyocytes. PLoS One 2009, 4 (4), e5407. 10.1371/journal.pone.0005407. [DOI] [PMC free article] [PubMed] [Google Scholar]
- Ivashchenko C. Y.; Pipes G. C.; Lozinskaya I. M.; et al. Human-induced pluripotent stem cell-derived cardiomyocytes exhibit temporal changes in phenotype. Am. J. Physiol Heart Circ Physiol. 2013, 305 (6), H913–22. 10.1152/ajpheart.00819.2012. [DOI] [PubMed] [Google Scholar]
- Tracy R. E.; Sander G. E. Histologically measured cardiomyocyte hypertrophy correlates with body height as strongly as with body mass index. Cardiol Res. Pract. 2011, 2011, 658958. 10.4061/2011/658958. [DOI] [PMC free article] [PubMed] [Google Scholar]
- Ribeiro A. J.; Ang Y. S.; Fu J. D.; et al. Contractility of single cardiomyocytes differentiated from pluripotent stem cells depends on physiological shape and substrate stiffness. Proc. Natl. Acad. Sci. U. S. A. 2015, 112 (41), 12705–12710. 10.1073/pnas.1508073112. [DOI] [PMC free article] [PubMed] [Google Scholar]
- Gerdes A. M.; Kellerman S. E.; Moore J. A.; et al. Structural remodeling of cardiac myocytes in patients with ischemic cardiomyopathy. Circulation 1992, 86 (2), 426–430. 10.1161/01.CIR.86.2.426. [DOI] [PubMed] [Google Scholar]
- Morez C.; Noseda M.; Paiva M. A.; Belian E.; Schneider M. D.; Stevens M. M. Enhanced efficiency of genetic programming toward cardiomyocyte creation through topographical cues. Biomaterials 2015, 70, 94–104. 10.1016/j.biomaterials.2015.07.063. [DOI] [PMC free article] [PubMed] [Google Scholar]
- Rao C.; Prodromakis T.; Kolker L.; et al. The effect of microgrooved culture substrates on calcium cycling of cardiac myocytes derived from human induced pluripotent stem cells. Biomaterials 2013, 34 (10), 2399–2411. 10.1016/j.biomaterials.2012.11.055. [DOI] [PMC free article] [PubMed] [Google Scholar]
- Takenaka C.; Miyajima H.; Yoda Y.; et al. Controlled growth and the maintenance of human pluripotent stem cells by cultivation with defined medium on extracellular matrix-coated micropatterned dishes. PLoS One 2015, 10 (6), e0129855. 10.1371/journal.pone.0129855. [DOI] [PMC free article] [PubMed] [Google Scholar]
- Reynolds P. M.; Pedersen R. H.; Riehle M. O.; Gadegaard N. A dual gradient assay for the parametric analysis of cell-surface interactions. Small 2012, 8 (16), 2541–2547. 10.1002/smll.201200235. [DOI] [PubMed] [Google Scholar]
- Yang J.; Rose F. R. A. J.; Gadegaard N.; Alexander M. R. A high-throughput assay of cell-surface interactions using topographical and chemical gradients. Adv. Mater. 2009, 21 (3), 300–304. 10.1002/adma.200801942. [DOI] [Google Scholar]
- Stormonth-Darling J. M.; Gadegaard N. Injection moulding difficult nanopatterns with hybrid polymer inlays. Macromol. Mater. Eng. 2012, 297 (11), 1075–1080. 10.1002/mame.201100397. [DOI] [Google Scholar]
- Kijlstra J. D.; Hu D.; Mittal N.; et al. Integrated analysis of contractile kinetics, force generation, and electrical activity in single human stem cell-derived cardiomyocytes. Stem Cell Rep. 2015, 5 (6), 1226–1238. 10.1016/j.stemcr.2015.10.017. [DOI] [PMC free article] [PubMed] [Google Scholar]
- Yang X.; Pabon L.; Murry C. E. Engineering adolescence: Maturation of human pluripotent stem cell-derived cardiomyocytes. Circ. Res. 2014, 114 (3), 511–523. 10.1161/CIRCRESAHA.114.300558. [DOI] [PMC free article] [PubMed] [Google Scholar]
- Crouch A. S.; Miller D.; Luebke K. J.; Hu W. Correlation of anisotropic cell behaviors with topographic aspect ratio. Biomaterials 2009, 30 (8), 1560–1567. 10.1016/j.biomaterials.2008.11.041. [DOI] [PubMed] [Google Scholar]
- Wong S. T.; Teo S. K.; Park S.; Chiam K. H.; Yim E. K. Anisotropic rigidity sensing on grating topography directs human mesenchymal stem cell elongation. Biomech. Model. Mechanobiol. 2014, 13 (1), 27–39. 10.1007/s10237-013-0483-2. [DOI] [PubMed] [Google Scholar]
- Rodriguez M. L.; Graham B. T.; Pabon L. M.; Han S. J.; Murry C. E.; Sniadecki N. J. Measuring the contractile forces of human induced pluripotent stem cell-derived cardiomyocytes with arrays of microposts. J. Biomech. Eng. 2014, 136 (5), 051005. 10.1115/1.4027145. [DOI] [PMC free article] [PubMed] [Google Scholar]
- Allen D. G.; Jewell B. R.; Murray J. W. The contribution of activation processes to the length-tension relation of cardiac muscle. Nature 1974, 248 (449), 606–607. 10.1038/248606a0. [DOI] [PubMed] [Google Scholar]
- Bub G.; Camelliti P.; Bollensdorff C.; et al. Measurement and analysis of sarcomere length in rat cardiomyocytes in situ and in vitro. Am. J. Physiol Heart Circ Physiol. 2010, 298 (5), H1616–25. 10.1152/ajpheart.00481.2009. [DOI] [PMC free article] [PubMed] [Google Scholar]
- van den Heuvel N. H.; van Veen T. A.; Lim B.; Jonsson M. K. Lessons from the heart: Mirroring electrophysiological characteristics during cardiac development to in vitro differentiation of stem cell derived cardiomyocytes. J. Mol. Cell. Cardiol. 2014, 67, 12–25. 10.1016/j.yjmcc.2013.12.011. [DOI] [PubMed] [Google Scholar]
- Scott C. W.; Zhang X.; Abi-Gerges N.; Lamore S. D.; Abassi Y. A.; Peters M. F. An impedance-based cellular assay using human iPSC-derived cardiomyocytes to quantify modulators of cardiac contractility. Toxicol. Sci. 2014, 142 (2), 331–338. 10.1093/toxsci/kfu186. [DOI] [PubMed] [Google Scholar]
- Sartiani L.; Bettiol E.; Stillitano F.; Mugelli A.; Cerbai E.; Jaconi M. E. Developmental changes in cardiomyocytes differentiated from human embryonic stem cells: A molecular and electrophysiological approach. Stem Cells 2007, 25 (5), 1136–1144. 10.1634/stemcells.2006-0466. [DOI] [PubMed] [Google Scholar]
- Kang J.; Chen X. L.; Wang H.; et al. Discovery of a small molecule activator of the human ether-a-go-go-related gene (HERG) cardiac K+ channel. Mol. Pharmacol. 2005, 67 (3), 827–836. 10.1124/mol.104.006577. [DOI] [PubMed] [Google Scholar]
- Perry M.; Sanguinetti M.; Mitcheson J. Revealing the structural basis of action of hERG potassium channel activators and blockers. J. Physiol. 2010, 588 (17), 3157–3167. 10.1113/jphysiol.2010.194670. [DOI] [PMC free article] [PubMed] [Google Scholar]
- Epstein F. H.; Morgan J. P. Abnormal intracellular modulation of calcium as a major cause of cardiac contractile dysfunction. N. Engl. J. Med. 1991, 325 (9), 625–632. 10.1056/NEJM199108293250906. [DOI] [PubMed] [Google Scholar]
- Takeishi Y.; Chu G.; Kirkpatrick D. M.; et al. In vivo phosphorylation of cardiac troponin I by protein kinase Cbeta2 decreases cardiomyocyte calcium responsiveness and contractility in transgenic mouse hearts. J. Clin. Invest. 1998, 102 (1), 72–78. 10.1172/JCI2709. [DOI] [PMC free article] [PubMed] [Google Scholar]
- Karakikes I.; Ameen M.; Termglinchan V.; Wu J. C. Human induced pluripotent stem cell-derived cardiomyocytes: Insights into molecular, cellular, and functional phenotypes. Circ. Res. 2015, 117 (1), 80–88. 10.1161/CIRCRESAHA.117.305365. [DOI] [PMC free article] [PubMed] [Google Scholar]
- Yang X.; Rodriguez M.; Pabon L.; et al. Tri-iodo-l-thyronine promotes the maturation of human cardiomyocytes-derived from induced pluripotent stem cells. J. Mol. Cell. Cardiol. 2014, 72, 296–304. 10.1016/j.yjmcc.2014.04.005. [DOI] [PMC free article] [PubMed] [Google Scholar]
- Puppala D.; Collis L. P.; Sun S. Z.; et al. Comparative gene expression profiling in human-induced pluripotent stem cell--derived cardiocytes and human and cynomolgus heart tissue. Toxicol. Sci. 2013, 131 (1), 292–301. 10.1093/toxsci/kfs282. [DOI] [PubMed] [Google Scholar]
Associated Data
This section collects any data citations, data availability statements, or supplementary materials included in this article.