

Abstract
N6-methyladenosine (m6A) is the most prevalent internal modification present in mRNAs of all higher eukaryotes. With the development of MeRIP-seq technique, in-depth identification of mRNAs with m6A modification becomes feasible. Here we present a transcriptome-wide m6A modification profiling effort for rice transcriptomes of differentiated callus and leaf, which yields 8,138 and 14,253 m6A-modified genes, respectively. The m6A peak (m6A-modified nucleotide position on mRNAs) distribution exhibits preference toward both translation termination and initiation sites. The m6A peak enrichment is negatively correlated with gene expression and weakly positively correlated with certain gene features, such as exon length and number. By comparing m6A-modified genes between the 2 samples, we define 1,792 and 6,508 tissue-specific m6A-modified genes (TSMGs) in callus and leaf, respectively. Among which, 626 and 5,509 TSMGs are actively expressed in both tissues but are selectively m6A-modified (SMGs) only in one of the 2 tissues. Further analyses reveal characteristics of SMGs: (1) Most SMGs are differentially expressed between callus and leaf. (2) Two conserved RNA-binding motifs, predicted to be recognized by PUM and RNP4F, are significantly over-represented in SMGs. (3) GO enrichment analysis shows that SMGs in callus mainly participate in transcription regulator/factor activity whereas SMGs in leaf are mainly involved in plastid and thylakoid. Our results suggest the presence of tissue-specific competitors involved in SMGs. These findings provide a resource for plant RNA epitranscriptomic studies and further enlarge our knowledge on the function of RNA m6A modification.
Keywords: MeRIP-seq, N6-methyladenosine, rice, RNA epitranscriptomic, RNA m6A modification
Abbreviation
- BPTM
bases per 10 millions of reads
- RPKM
reads per kilo base per million mapped reads
- SMG
selective methylated gene
- TSMG
tissue specific methylated gene
Introduction
RNA methylation, especially N6-methyladenosine (m6A), is a major internal (exclude mRNA capping) modification of eukaryotic mRNAs. N6-methyladenosine was first discovered in bacteria DNA in 1955,1 and DNA methyltransferase took part in restriction-modification system to protect genome DNA from degradation when infected by viruses.2 Since 1958, m6A was discovered in viral RNAs,3 and in various other eukaryotic species including mammals,4 insects,5 and plants, such as maize,6 wheat,7 and oat,8 and Arabidopsis.9 A 3-component complex of RNA:m6A methyltransferase catalyzes m6A modification, and this complex has not been completely discovered except for MT-A70.10 Recently, another 2 proteins (WTAP/FIP37 and KIAA1429) have been confirmed of their functions related to m6A methylation.9,11 The RNA: m6A methyltransferase binds to specific mRNA sequences with a consensus motif RRACH (where R = purine, and H = A, C, or U).12 Induced deficiency or disruption of the methyltransferase is detrimental and leads to apoptosis in human,13 embryonic developmental arrest in Arabidopsis or defect of gametogenesis in yeast and Drosophila.14,15 Similar to DNA and histone methylations, m6A modification is also a dynamic, reversible process. Recent studies have demonstrated that FTO (fat mass and obesity-associated), a major regulator of metabolism and energy utilization, demethylates RNA m6A modification.16 ALKBH5, another member of the Fe(II)-and oxoglutarate-dependent AlkB oxygenase family, is also able to deprive the methyl group of m6A. ALKBH5 plays important roles in many biological processes, ranging from development and metabolism to fertility.17,18 The existence of RNA m6A in diverse lineages and the complex biological functions of the (de-)/methyltransferases indicate that m6A is an important post-transcriptional modification, playing profound roles in post-transcriptional epigenetic regulations.
Understanding the functional role of RNA m6A modification requires knowledge of its distribution at transcriptomic level. MeRIP-seq (methylated RNA immunoprecipitation followed by sequencing) or m6A-seq,13,19 which combines mRNA-seq and immunoprecipitation technologies, has emerged as the gold standard for studying transcriptome-wide RNA modification. Two corresponding studies have led to exploration of mammalian m6A profiles and both studies have showed that m6A peaks tend to be enriched in 3′UTRs and near the stop codon. The non-random distribution of m6A modification along mRNAs implicates that it may involve in posttranscriptional transcript processing including splicing, transport, degradation, and translational regulation. Recent studies on mRNA methylation in yeast meiosis also illustrated the regulatory roles m6A.20 Another study of m6A in mESC showed that m6A methylation accelerated transcript decay and affected stem cell maintenance and differentiation.21 In all, RNA decorations by m6A have a fundamental role in epigenetic regulation that remains a virgin land.
Many m6A-related studies have been carried out in mammals, stem cells, and yeast, but there are very few studies on m6A profiling in plant transcriptomes. Silin Zhong et al. have reported that Arabidopsis has m6A modification at a level similar to some previous reports for animal cells, and the group has also found that inactivation of MTA genes results in failure of embryo development.9,22 But so far, m6A modification in rice has yet to be exploited. In this study, we simultaneously sample seed-induced differentiation callus and adult leaf with 6 tillers of rice using m6A-seq and acquire the first set of m6A modified mRNA profiles in rice. We compare the patterns of m6A distribution within plant tissues and between plants and animals, and investigate tissue-specificity and selectivity of the methylated genes and their functional implications.
Results
Transcriptome-wide detection of m6A modification in rice callus and leaf
Using the Illumina Hiseq-2000, we acquired 23,400,472 and 47,824,653 reads from callus and leaf, respectively. After end-trimming and quality filtering, 45,165,158 high-quality reads (63.4% of the total reads), were mapped to the reference genome of japonica (MSU 7.0). Among the mapped reads, 87.4% were uniquely mapped to genome and 12.6% were mapped to junction sequences (Table 1).
Table 1.
Summary of sequence data and read alignment statistics
| Samples ID | Raw reads | Clean readsa | Reads Uniquely mapped to genome | Reads uniquely mapped to junction | Total reads uniquely mapped (%) | m6A peaks/m6A modified genes | Expressed gene #b | |
|---|---|---|---|---|---|---|---|---|
| m6A-IPc (m6A-seq) | Callus | 23,400,472 | 23,284,249 | 13,424,301 | 1,766,841 | 15,191,142 (65.2%) | 17,295/7,977 | / |
| Leaf | 47,824,653 | 47,548,747 | 26,056,416 | 3,917,600 | 29,974,016 (63.0%) | 37,295/12,695 | / | |
| CTd (RNA-seq) | Callus | 17,364,975 | 17,220,636 | 9,554,651 | 1,769,941 | 11,324,592 (65.8% | / | 20,329 |
| Leaf | 38,827,070 | 38,569,379 | 20,039,364 | 3,673,561 | 23,712,925 (61.5%) | / | 17,552 |
Note: aclean reads indicate reads after filtering adaptors and low quality, and random sampling; bGenes with RPKM > 1; cIP, immunoprecipitation; dCT, Control
We also sequenced 2 control samples simultaneously in order to improve m6A peak identification; the effort yielded 17,364,975 and 38,827,070 reads for callus and leaf, respectively, and after processing, the information of 20,329 and 17,552 genes were collected (RPKM ≥ 1). The m6A modification sites (actually identified as m6A peaks) were identified based on comparison of reads distribution between the IP and control samples using MeRIP-PF software package.23 We detected 17,614 and 39,390 m6A enriched peaks (Fisher's exact test, P ≤ 0.05) in the 2 samples, representing 7,977 (callus) and 12,693 (leaf) expressed genes, with an average of 2.2 and 3.1 peaks per mRNA in callus and leaf samples, respectively. The methylation ratio was defined as percentage, i.e., the number of methylated genes divided by that of the total expressed genes, which are 39.24% and 72.32% in the 2 samples (Table 1).
Distribution of m6A peaks over mRNAs and chromosomes
We investigated the m6A peak distribution according to gene annotations in MSU database,24 and found that the majority (around 90%) of m6A peaks were within genic regions. Among them, more than 70% genic peaks were localized near CDSs and 3′ untranslated regions (3′UTRs), whereas ∼20% were found in intronic regions and 5′ untranslated regions (5′UTRs) (Fig. 1A). Further analysis on relative positions of m6A peaks along mRNAs revealed the summit of m6A peaks were near stop codons or positions close to the beginning of 3′UTRs. We also downloaded the datasets (GSM854223 and GSM854224) published in 2012 and identified m6A peaks using the same pipeline, and found that the m6A distribution along mRNAs in rice was similar to the reported distributions of mammals.19 More interestingly, there was another minor summit of m6A peaks at positions near the start codon of CDSs both in callus and leaf, which was significantly higher than was what found in mouse brain (Fig. 1B) and further confirmed by magnified m6A peak distribution in the regions around CDS start and end (Fig. S1). The specific distribution may be related to different gene organizations between mammals and plants,25 and suggested different m6A regulatory mechanisms in plants and animals.
Figure 1.
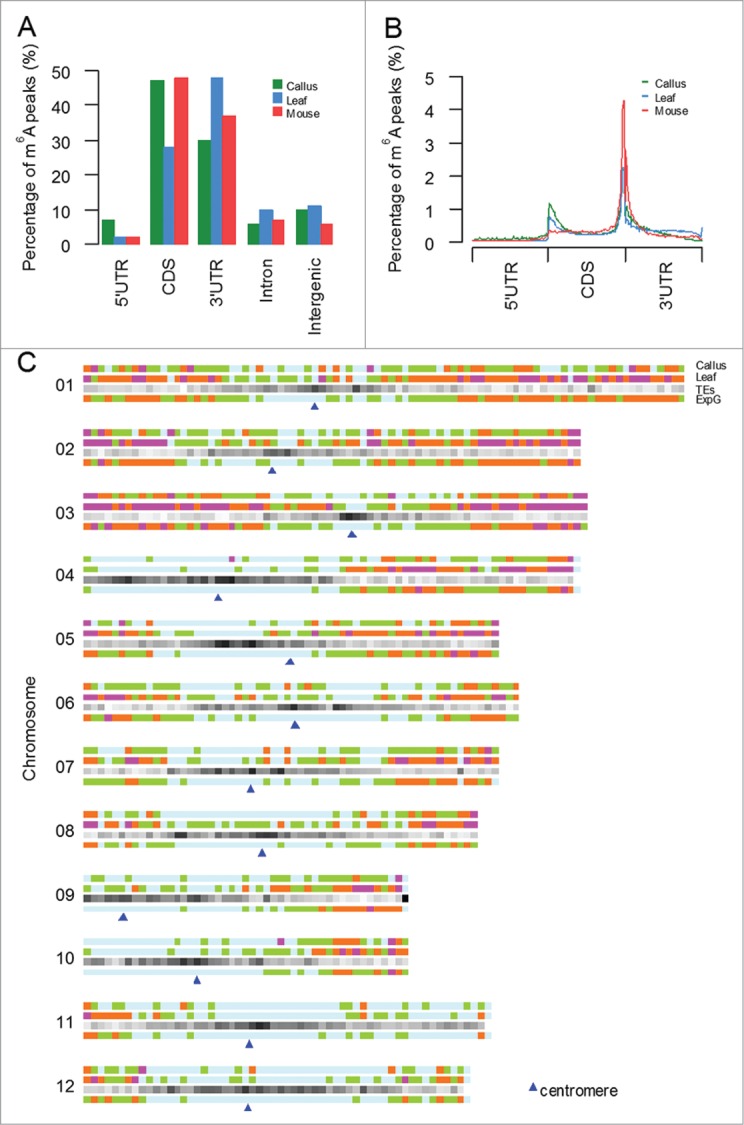
Distribution of m6A modification peaks along mRNA and chromosome (A) Transcriptome-wide distribution of m6A peaks. Bar graph shows the fraction of m6A peaks in each of the 5 non-overlapping transcript segments. (B) Distribution of m6A peaks across the length of mRNAs. 5′UTRs, CDS, and 3′UTRs of rice mRNAs are individually binned into regions spanning 1% of their total length, and the percentage of m6A peaks that fall within each bin is determined. (C)Distribution of m6A peaks along chromosomes of callus and leaf tissues. From top to bottom, 3 horizontal bars represent chromosomes, where the m6A peak density in callus, leaf, TE gene and expressed gene (taking callus as samples) in 500-kb windows are displayed with scales as indicated. Diamonds in different colors (light blue->green-> brown->purple) represent numbers of peaks or genes ascending.
We also investigated the whole genome density of m6A modification peaks and found a ‘2-terminal hot’ distribution of m6A peaks across chromosomes (Fig. 1C). Specifically, m6A peaks were preferentially distributed at the telomeric ends and became sparsely scattered toward centromeres. High density of m6A modification and expressed genes in telomeric regions were observed from the whole genome distribution, which was opposite from the density distribution of TE genes. Both callus and leaf tissues showed very similar features as described, but obviously, the leaf tissue appeared possessing more peaks than callus. The modification profiles as well as TE density were different among chromosomes. By comparing the characteristics of m6A peak distribution among chromosomes (Fig. S2), we found that chromosomes 11 and 12 had less intense modification in both samples whereas chromosomes 2 and 3 showed higher modification levels in average. This whole genome distribution suggested that m6A modification may be closely related to chromatin state and conformation.
Correlation of m6A modification with gene features and transcription levels
The numbers of m6A modified sites were varied widely among individual genes. There were 49.9% and 25.8% of the methylated mRNAs containing a single m6A peak in callus and leaf, respectively, and the percentages varied, 29.3% and 29.8% of the methylated mRNAs, when 2 m6A peaks per mRNAs were looked into. For 3 and 4 m6A peaks, the percentages further reduced to 11.2% and 9.6% in callus and 21.9% and 22.5% in leaf, respectively (Fig. 2A). We made 2 observations here. First, some of the peaks are clustered, which is consistent with those reported in human and mouse.13,19 Second, the difference is the ratio of single over multiple peaks or the overall trend of the clustered peaks; fraction of the peaks in different clustering schemes remains similar (20% to 30% in all clustering schemes) in leaf but variable (single peak is much more than 2-peak and 3-peak clusters) in callus. We presumed that this unequal distribution might be associated with gene structure characteristics. The correlation of m6A enrichment to some gene-centric length parameters, including CDS, 5′UTR, 3′UTR, intron, gene and mRNA, as well as exon number were computed for each sample. The m6A enrichment was slightly and positively correlated with exon number and the length of introns and genes (Fig. 2B). We further correlated modification and expression levels, and Pearson correlation analysis showed that there were negative correlations between the 2 levels (Fig. 2C–D).
Figure 2.
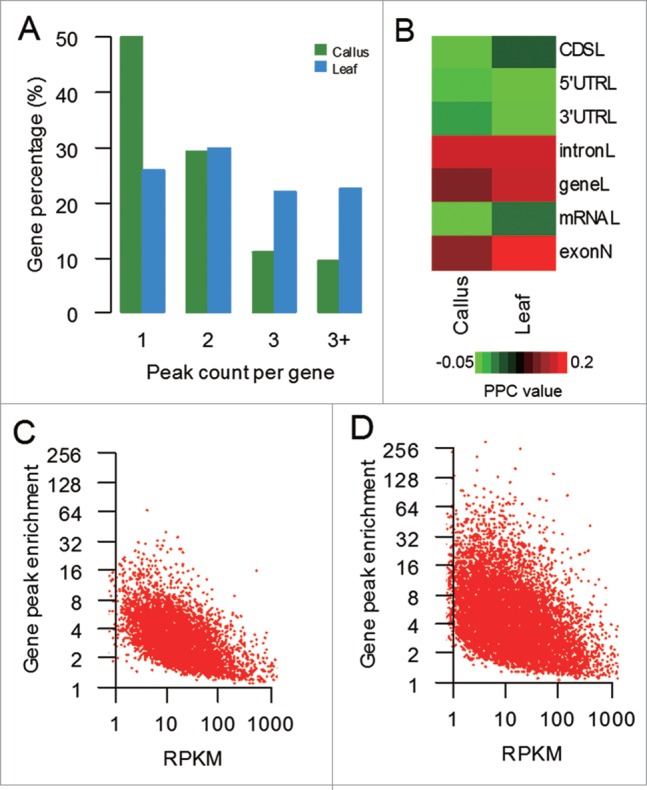
Characteristics and distribution of m6A modification peaks among rice genes (A) Percentage of m6A methylated genes with different m6A peak number. (B) Correlations between m6A enrichment value and the length of CDS, 5′UTR, 3′UTR, intron, gene, and mRNA, as well as exon number. The color bars represent the Pearson Correlation Coefficient (PCC) values. (C–D) Correlations between m6A peak enrichment and mRNA abundance. Peak enrichment value (the ratio of MeRIP sample reads to non-IP sample reads within the area of peaks, each normalized to the number of reads within the sample) relative to transcript abundance measured by RPKM (reads per kilo base per million mapped reads) values in the control are also plotted.
Commonly and selectively methylated genes in callus and leaf
Comparing the methylated genes between the 2 samples, we discovered that 6,185 (76% and 43%) genes were methylated both in leaf and callus; 1,792 and 6,508 genes were tissue specific methylated genes (TSMG) in callus and leaf, respectively. Further investigation revealed 626 (35% out of 1,792 callus-specific methylate genes) and 5,509 (84.6% out of 6,508 leaf-specific methylated genes) TSMGs expressed in both leaf and callus, but selectively methylated (SMG) in either callus or leaf. Such as LOC_Os07g12510.1 and LOC_Os09g10760.1 (Fig. 3A), each is a selectively methylated gene in callus or leaf. Obviously, selectively methylated genes (SMG) were only modified in certain tissues. By statistical test analysis, we found 439 (70%) and 3,968 (72%) SMGs in callus and in leaf were significantly differentially expressed between the 2 tissues (P ≤ 0.001, |FC|≥2).
Figure 3.

Examples of selected methylated genes and GO enriched functional classes for SMGs (A) Two examples of selectively methylated genes (SMGs). The peaks (gray vertical bars) of SMGs in callus (in the left panel; LOC_Os07g12510.1) and leaf (the right panel; LOC_Os09g10760.1) and BPTM (base per 10 millions of reads) values for the 2 genes are shown. (B) GO analysis of commonly methylated genes (CM) and selectively methylated genes in callus (CS) and leaf (LS). Diamonds in different colors represent GO term enrichment values, and gray color means the term is not significantly enriched. *MB, membrane-bound.
To predict potential functional processes of m6A modified genes involved, Gene Ontology enrichment analysis of these commonly and selectively methylated genes were performed by using agriGO.26 We found the commonly methylated genes were mainly involved in RNA binding (GO: 0003723, FDR = 4.30e-16), gene expression (GO: 0010467, FDR = 3.4e-20), and other diverse functional classes (Fig. 3B). The SMGs in callus were mainly involved in transcription factor activity (GO: 0003700, FDR = 1.50e-9), transcription regulator activity (GO: 0030528, FDR = 1.50e-9), nucleic acid binding (GO: 0003676, FDR = 8.00e-4), nitrogen metabolism (GO: 0006807, FDR = 0.004), etc. However, the SMGs in leaf were mainly enriched in intracellular part (GO: 0044424, FDR = 5.00e-28), plastid (GO: 0009536, FDR = 7.10e-33) and thylakoid (GO: 0009579, FDR = 3.80e-06) which are necessary for photosynthesis. Collectively, these data demonstrated that m6A -containing RNAs were involved in a variety of biological pathways relevant to tissue development or cellular signaling, and the SMGs were significantly differentially expressed between the 2 tissues and involved in different functional categories.
Conserved RNA-binding motif for RBPs in selectively methylated genes (SMGs)
RNA-binding proteins (RBPs) regulate numerous aspects of co- and post-transcriptional gene expression, including RNA splicing, polyadenylation, capping, modification, export, location, translation and turnover.27 It remains unclear whether some RBPs play roles as ‘selectors’ or ‘competitors’ in post-transcriptional m6A modification and whether the SMGs are the products of competition between RBPs and m6A methyltransferase. We investigated the conserved motifs around the m6A peaks for all the SMGs in callus and leaf by combination of de novo motif prediction and comparison to known motifs of RBPs. The conserved motif -UGUAMM (UGUA[AC][AC]), which was similar to PUM-binding motif (P = 3.05e-5, E-value = 7.44e-3), was significantly over-represented (E-value = 8.6e-012) in SMGs of leaf (Table 2). Another conserved motif RAGRAG, which was similar to RNA-binding motifs of RNP4F (P-value = 0.0007) and TRA2 (P-value = 0.001), were found significantly (E-value = 2.8e-075) enriched in SMGs of callus. Since the 2 motifs present within m6A peak regions, there may be competition between the RBPs and the RNA m6A methyltransferase. We further surveyed the expression of PUM families and found that 6 members of pumilio-family RNA-binding proteins were all down-regulated or nearly non-expressed in leaf tissue when compared to those in callus (Fig. S3). The low expression of PUMs in leaf provides m6A methyltransferase access to potential modification sites, while the expressed PUMs may compete with m6A RNA methyltransferase in callus, which typically binds to subsets of mRNAs that were functionally related. The conserved RNA-binding motif and differentially expression of these RBPs may be responsible for those SMGs.
Table 2.
Predicated conserved RNA-binding motifs in selectively methylated genes (SMGs)
| Callus | Leaf | |
|---|---|---|
| Common methylated genes (peaks) | 6,185 (11,927|19,215) | |
| Selective methylated genes (peaks) | 626(1,045) | 5,509 (11,820) |
| Peaks for motif findinga | 1,001 | 1,680 (ratio ≥ 16) |
| De-novo conserved motif predictionb (by MEME) | RAGRAG (E-value: 2.8e-075) (252 sites) | UGUAMM (E-value:8.6e-012) (580 sites) |
| Compared to known RBP motifsc (by TOMTOM) | (RAGRAG) | (UGUAMM) |
| P-value | 7.32e-04 | 3.05e-05 |
| E-value | 0.178 | 7.44e-03 |
| q-value | 0.271 | 0.014 |
Note: aThe m6A modification peaks located in intronic regions are filtered out both in callus and leaf, and we choose top 1,680 peaks in leaf depending on the enrichment values; bThe predicted conserved motifs are showed in IUPAC type; cMotifs in the bottom panel are those we found using MEME, and the top panel (RNCMPT00060 represents PUM; RNCMPT00104 represents RNP4F) are those RBP motifs recorded in cisBP-RNA database (http://cisbp-ran.ccbr.utoronto.ca/).
Discussions
In this study, we generated the first transcriptome-wide RNA m6A modification profiles using m6A-seq technology. As expected, the modification profiles were different between the 2 tissues. However, similar distribution characteristics along mRNA and chromosome were observed. The modified peaks along mRNAs were mainly distributed around the translation initiation site and translation termination site which presenting a ‘bimodal’ distribution. The non-random distribution is significantly different from that in mammals, and the distribution characteristic suggested the post-transcriptional RNA m6A modification may play regulation roles on translation. In addition, high density of m6A modification in telomeric regions were observed from the whole genome distribution, which was opposite from the density distribution of TE genes. The negative correlation between m6A enrichment and transcript activities further suggests that chromatin conformation may influence m6A modification. However, much work is needed to detail the real impact of m6A on translation regulation and of chromatin conformation on m6A modification.
The tempospatial methylomes of callus and leaf revealed many commonly methylated genes and quite a few of tissue-specific methylated genes (TSMGs). Some of the TSMGs are due to tissue-specific expression manner. However, a fraction of TSMGs (35% in callus and 84% in leaf) were expressed in both tissues, and we called these genes as selectively methylated genes (SMGs). It is still unknown how tissue-specific and selective m6A methylation is achieved. Our hypothesis is that there may be one or more of RNA binding proteins as ‘Selectors’ or ‘Competitors’ to compete genes as SMGs. By predicting the conserved sequence motif in these SMGs, we found 2 conserved motifs that over-represented in callus and leaf SMGs, respectively. When compared to the known RNA-binding motifs, they were significantly similar to RNP4F and PUF binding motifs, respectively. Especially important, the significant difference of the expression of all PUFs members between callus and leaf further supports the idea that they are potential ‘competitors’ for SMGs. It still needs more experimental evidence to prove whether the RNA-binding proteins compete with methyltransferases in vivo.
The dynamic m6A modification is achieved by the ‘Writers’ and the ‘Easers’. The ‘Writers’, the methyltransferase complex, include METTL3/14 in mammals10,28 or MTA in plants to catalyze the methylation reaction,9 and other crucial components such as WTAP in human29 and FIP37 in Arabidopsis,9 and KIAA142911 which enhance methylation activity.30 Based on published data, a consensus motif sequences ‘RRACH’ is over-represent in m6A motif regions. However, in our current data, another different motif sequence (data not shown) is enriched both by MEME and HOMER software. We are uncertain of if the consensus sequence of the methylation in plants were different from mammals, more methylome data of plant were need to confirm this hypothesis. FTO and alkbh5, 2 m6A demethyltransferases in mammalian cells, have been reported recently as the ‘Easers’, which de-methylate m6A modification in vitro. In this reversible reaction, some m6A specific ‘Readers’ are needed to assist recognition of potential m6A sites. The YTHDF protein families have been reported to selectively recognize m6A and regulate mRNA degradation.31 Here, based on our observation, we proposed that some RNA-binding proteins (e.g. PUMs) may act as ‘Competitors’, competing with methyltrasferaese, and determine to whether to methylate certain mRNA sites in a tissue-specific manner.
In summary, tremendous strides have recently been made toward clarifying key questions related to m6A biology. However, for the first time, we profiled the m6A methylomes in rice callus and leaf, and compared the distribution characteristics between rice and mouse. More importantly, we proposed a ‘Competitor’ concept that is responsible for SMGs. Our epitranscriptomic data provide a foundation for understanding this critical RNA modification on plants and crops.
Materials and Methods
Callus and 6-tillering leaf sample preparation
The mature dehusked caryopses of the rice variety Nipponbare (Oryza sativa L. ssp. Japonica) were used for callus induction experiment. The dehusked caryopses were disinfected in turn by 70% ethanol for 1–2 minutes and NaClo solution with 2.5% available chlorine for 30–45 minutes. In the sterile operation, the caryopses were rinsed with sterile water for 3–5 times, and then cultured on MS basal medium that was supplemented with 2 mg/L 2,4-dichlorophenoxyacetic acid (2,4-D), 30 g/L maltose, 0.3 g/L casein hydrolysate, and 3 g/L agar. After incubation for 2 weeks in dark, the scutella of callus were cut from the caryopses and then subcultured for 2 generations. Half of the compact and vigorous callus particles were collected and stored at −80°C for use, and the other half were transferred to the regeneration medium [MS basal medium supplemented with 1 mg/L 1-naphthaleneacetic acid (NAA), 3 mg/L 6-benzyl adenine (6-BA), 0.5 mg/L thidiazuron (TDZ), 0.3 g/L casein hydrolysate, 30 g/L maltose] at 30°C under fluorescent illumination of 110–130 mmol/m2/s PAR for shoot regeneration. After 14 days, the differentiated callus with green shots were collected and stored at −80°C for the following RIP and RNA-seq experiment. Leaf tissue at the stage of 6-tillering were also collected and stored.
RNA preparation
Total RNAs of the differentiated callus and the leaf were extracted by using the RNA-extraction-system with Trizol (Invitrogen). Enrichment of Polyadenylated RNAs (polyA+ RNAs) was performed with 2 rounds of Dynabeads mRNA purification kit (Invitrogen). The enriched mRNAs were chemically fragmented into ∼100-nucleotide-long fragments by incubating at 94°C for 5 min in fragmentation buffer (Ambion). The fragmentation reaction was stopped with 0.05 M EDTA, followed by standard ethanol precipitation, and the fragmented product was resuspended in H2O in a concentration of ∼1 μg μl−1.
RNA M6A IP-seq library construction and sequencing
RNA immunoprecipitation (RIP) was performed as described previously.13 Fragmented RNA was incubated for 2 h at 4°C with 5 mg of affinity purified anti-m6A polyclonal antibody (Synaptic Systems) in IPP buffer. The mixture was then immunoprecipitated by incubation with protein-A beads (Repligen) at 4°C for an additional 2 h. After extensive washing, bound RNA was eluted from the beads with 0.5 mg ml−1 N6-methyladenosine (Sigma-Aldrich) in IPP buffer, and precipitated in ethanol. RNA was resuspended in H2O and used for RNA-seq library generation with mRNA sequencing kit (Illumina). Both the control (or input) sample without immunoprecipitation and the m6A IP samples were subjected to single-end sequencing on Illumina HiSeq 2000.
Preprocessing sequencing reads
The adaptor sequence (ATCTCGTATGCCGTC) was first removed from the raw reads with an in-house protocol. Low-quality reads were also filtered according to the following 2 criteria: (1) sequenced bases with quality lower than 20 were trimmed from the 3′-end and the reads were discarded if they are shorter than 20bp; and (2) reads having more than 10% bases with low quality scores (<25 ) were also filtered.
Reads alignment and gene expression analysis of control samples
After preprocessing, high-quality reads were aligned to the rice genome (MSU Rice Genome Annotation Project Release 7) and junction data set constructed by connecting 2 95bp-sequences truncated from the 3′ end and 5′ end of 2 randomly combined exons in one gene. For genes with alternative splicing variants, we collected all exons that belong to different transcripts to construct a junction reference. The alignment was done by using the Burrows-Wheeler Aligner (BWA) at default settings.32 Only those reads that uniquely mapped to the reference sequences and had a Phred quality score ≥20 were adopted for gene expression quantification and m6A modification peak identification.
Gene expression levels were measured as numbers of reads per kilo bases of exon model in a gene per million uniquely mapped reads (RPKM) and quantified using wapRNA.33 Genes with RPKM ≥ 1 were used for further analysis. Differentially Expressed Genes (DEGs) between callus and leaf were identified with an R package named ‘DEGseq’.34 Genes with P ≤ 0.001 and normalized change fold ≥2 were regarded as DEGs.
Identification of m6A modification peaks
m6A modification peaks were identified by using MeRIP-PF, which is an easy-to-use package and developed in our own lab based on a method published previously.19 MeRIP-PF first splits genome into end-to-end 25-bp windows and then defines an m6A peak based on comparison of read counts between MeRIP data and controls within a 25-bp window across the genome. Results were tested with one-tailed Fisher's exact test and Benjamini–Hochberg method,35 and both P-value and adjusted P-value (FDR) for each window were calculated (FDR ≤ 0.05). Significantly differential and adjacent (no gaps present) windows are concatenated into peak regions, and only those with appropriate sizes (∼200bp) were considered as reliable and real.
Functional enrichment analysis
Gene Ontology enrichment analysis of m6A methylated genes that include common and tissue-specific methylated genes was done by using agriGO bioinformatics database. Singular enrichment analysis (SEA) in agriGO which adopted hypergeometric test and multi-test adjustment method of Yekutieli (FDR under dependency) was used to differentiate significantly enriched GO terms from non-significant ones, and those with FDR ≤ 0.05 were regarded as significantly enriched GO. Another analysis tool cross comparison of SEA (SEACOMPARE) was further used to compare the enrichment and their differences were presented with gradual color changes.
Conserved motif prediction and comparison to known RNA-binding motifs of RBPs
We extracted 101-nt sequence that surrounds the read-covered summit located within the peak regions of SMGs. Peaks in intronic regions were excluded, and the top 1,680 peaks (enrichment values ≥ 16) in leaf were used for further motif prediction. The conserved RNA binding motifs enriched in the sequences were predicted with MEME and HOMER using both the random sequences and non-m6A UTR sequences as background.36,37 The best motifs predicted in callus and leaf were compared to known RNA-binding-motif databases38 using TOMTOM.39
Figure processing
For plotting m6A peak distribution, 5′UTRs, CDS, and 3′UTRs of rice mRNAs were individually binned into regions spanning 1% of their total length, and peak absolute positions were converted into corresponding percentage positions. Then, we separately counted peak numbers located in the above 3 non-overlapping regions of mRNAs and calculated the percentage of total m6A peaks. For chromosome distribution (Fig. 1C), we split chromosome into 500kb non-overlapping windows, and counted peak number in callus and leaf each window. TE gene density (TE gene number/total gene number) in each window were also calculated. Then, we showed peak density and TE gene density in different colors. For calculating correlations between peak enrichment values (the ratio of IP sample reads to non-IP sample reads within the area of peaks, each normalized to the number of reads within the sample) and RPKM values (reads per kilo base per million mapped reads), Log2 (enrichment value) and Log10 (RPKM value) were plotted.
Supplementary Material
Disclosure of Potential Conflicts of Interest
No potential conflicts of interest were disclosed.
Acknowledgments
The authors thank Professor Lihuang Zhu for support with the samples, and Dr. Qi Wu for assisting in cultivating callus. We also thank Professor Yungui Yang for support with m6A-IP experiments.
Funding
This work was supported by the National Natural Science Foundation (Grant No. 30900831 and 31271372) and Beijing Nova Program (Grant No. Z121105002512060) to SS.
References
- 1. Dunn DB, Smith JD. Occurrence of a new base in the deoxyribonucleic acid of a strain of bacterium-Coli. Nature 1955; 175:336-7; PMID:13235889; http://dx.doi.org/ 10.1038/175336a0 [DOI] [PubMed] [Google Scholar]
- 2. Jeltsch A, Pingoud A. Horizontal gene transfer contributes to the wide distribution and evolution of type II restriction-modification systems. J Mol Evol 1996; 42:91-6; PMID:8919860; http://dx.doi.org/ 10.1007/BF02198833 [DOI] [PubMed] [Google Scholar]
- 3. Beemon K, Keith J. Localization of N6-methyladenosine in the Rous sarcoma virus genome. J Mol Biol 1977; 113:165-79; PMID:196091; http://dx.doi.org/ 10.1016/0022-2836(77)90047-X [DOI] [PubMed] [Google Scholar]
- 4. Adams JM, Cory S. Modified nucleosides and bizarre 5'-termini in mouse myeloma mRNA. Nature 1975; 255:28-33; PMID:1128665; http://dx.doi.org/ 10.1038/255028a0 [DOI] [PubMed] [Google Scholar]
- 5. Levis R, Penman S. 5'-terminal structures of poly(A)+ cytoplasmic messenger RNA and of poly(A)+ and poly(A)- heterogeneous nuclear RNA of cells of the dipteran Drosophila melanogaster. J Mol Biol 1978; 120:487-515; PMID:418182; http://dx.doi.org/ 10.1016/0022-2836(78)90350-9 [DOI] [PubMed] [Google Scholar]
- 6. Nichols JL. N6-Methyladenosine in maize poly(a)-containing rna. Plant Sci Lett 1979; 15:357-67; http://dx.doi.org/ 10.1016/0304-4211(79)90141-X [DOI] [Google Scholar]
- 7. Kennedy TD, Lane BG. Wheat embryo ribonucleates .13. methyl-substituted nucleoside constituents and 5'-terminal dinucleotide sequences in bulk poly(a)-rich rna from imbibing wheat embryos. Can J Biochem Cell B 1979; 57:927-31; http://dx.doi.org/ 10.1139/o79-112 [DOI] [PubMed] [Google Scholar]
- 8. Haugland RA, Cline MG. Post-transcriptional modifications of oat coleoptile ribonucleic-acids - 5'-terminal capping and methylation of internal nucleosides in poly(a)-rich Rna. Eur J Biochem 1980; 104:271-7; PMID:6154573; http://dx.doi.org/ 10.1111/j.1432-1033.1980.tb04425.x [DOI] [PubMed] [Google Scholar]
- 9. Zhong SL, Li HY, Bodi Z, Button J, Vespa L, Herzog M, Fray RG. MTA is an Arabidopsis messenger RNA adenosine methylase and interacts with a homolog of a sex-specific splicing factor. Plant Cell 2008; 20:1278-88; PMID:18505803; http://dx.doi.org/ 10.1105/tpc.108.058883 [DOI] [PMC free article] [PubMed] [Google Scholar]
- 10. Desrosie R, Frideric K, Rottman F. Identification of methylated nucleosides in messenger-rna from novikoff hepatoma-cells. P Natl Acad Sci USA 1974; 71:3971-5; http://dx.doi.org/ 10.1073/pnas.71.10.3971 [DOI] [PMC free article] [PubMed] [Google Scholar]
- 11. Schwartz S, Mumbach MR, Jovanovic M, Wang T, Maciag K, Bushkin GG, Mertins P, Ter-Ovanesyan D, Habib N, Cacchiarelli D, et al. Perturbation of m6A writers reveals two distinct classes of mRNA methylation at internal and 5' sites. Cell reports 2014; 8:284-96; PMID:24981863; http://dx.doi.org/ 10.1016/j.celrep.2014.05.048 [DOI] [PMC free article] [PubMed] [Google Scholar]
- 12. Csepany T, Lin A, Baldick CJ, Jr, Beemon K. Sequence specificity of mRNA N6-adenosine methyltransferase. J Biol Chem 1990; 265:20117-22; PMID:2173695 [PubMed] [Google Scholar]
- 13. Dominissini D, Moshitch-Moshkovitz S, Schwartz S, Salmon-Divon M, Ungar L, Osenberg S, Cesarkas K, Jacob-Hirsch J, Amariglio N, Kupiec M, et al. Topology of the human and mouse m6A RNA methylomes revealed by m6A-seq. Nature 2012; 485:201-6; PMID:22575960; http://dx.doi.org/ 10.1038/nature11112 [DOI] [PubMed] [Google Scholar]
- 14. Clancy MJ, Shambaugh ME, Timpte CS, Bokar JA. Induction of sporulation in Saccharomyces cerevisiae leads to the formation of N6-methyladenosine in mRNA: a potential mechanism for the activity of the IME4 gene. Nucleic Acids Res 2002; 30:4509-18; PMID:12384598; http://dx.doi.org/ 10.1093/nar/gkf573 [DOI] [PMC free article] [PubMed] [Google Scholar]
- 15. Hongay CF, Orr-Weaver TL. Drosophila inducer of MEiosis 4 (IME4) is required for Notch signaling during oogenesis. P Natl Acad Sci USA 2011; 108:14855-60; PMID:21873203; http://dx.doi.org/ 10.1073/pnas.1111577108 [DOI] [PMC free article] [PubMed] [Google Scholar]
- 16. Jia GF, Fu Y, Zhao X, Dai Q, Zheng GQ, Yang Y, et al. N6-Methyladenosine in nuclear RNA is a major substrate of the obesity-associated FTO. Nat Chem Biol 2011; 12:885-887; http://dx.doi.org/ 10.1038/nchembio1212-1008a [DOI] [PMC free article] [PubMed] [Google Scholar]
- 17. Zheng GQ, Dahl JA, Niu YM, Fedorcsak P, Huang CM, Li CJ, Vågbø CB, Shi Y, Wang WL, Song SH, et al. ALKBH5 is a mammalian RNA demethylase that impacts RNA metabolism and mouse fertility. Mol Cell 2013; 49:18-29; PMID:23177736 [DOI] [PMC free article] [PubMed] [Google Scholar]
- 18. Niu Y, Zhao X, Wu YS, Li MM, Wang XJ, Yang YG. N6-methyl-adenosine (m6A) in RNA: an old modification with a novel epigenetic function. Genomics, Proteomics Bioinformatics 2013; 11:8-17; http://dx.doi.org/ 10.1016/j.gpb.2012.12.002 [DOI] [PMC free article] [PubMed] [Google Scholar]
- 19. Meyer KD, Saletore Y, Zumbo P, Elemento O, Mason CE, Jaffrey SR. Comprehensive analysis of mRNA methylation reveals enrichment in 3' UTRs and near stop codons. Cell 2012; 149:1635-46; PMID:22608085; http://dx.doi.org/ 10.1016/j.cell.2012.05.003 [DOI] [PMC free article] [PubMed] [Google Scholar]
- 20. Schwartz S, Agarwala SD, Mumbach MR, Jovanovic M, Mertins P, Shishkin A, Tabach Y, Mikkelsen TS, Satija R, Ruvkun G, et al. High-resolution mapping reveals a conserved, widespread, dynamic mRNA methylation program in yeast meiosis. Cell 2013; 155:1409-21; PMID:24269006; http://dx.doi.org/ 10.1016/j.cell.2013.10.047 [DOI] [PMC free article] [PubMed] [Google Scholar]
- 21. Wang Y, Li Y, Toth JI, Petroski MD, Zhang Z, Zhao JC. N6-methyladenosine modification destabilizes developmental regulators in embryonic stem cells. Nat Cell Biol 2014; 16:191-8; PMID:24394384; http://dx.doi.org/ 10.1038/ncb2902 [DOI] [PMC free article] [PubMed] [Google Scholar]
- 22. Bodi Z, Zhong SL, Mehra S, Song J, Graham N, Li H, May S, Fray RG. Adenosine methylation in Arabidopsis mRNA is associated with the 3 ' end and reduced levels cause developmental defects. Front Plant Sci 2012; 3:48; PMID:22639649 [DOI] [PMC free article] [PubMed] [Google Scholar]
- 23. Li Y, Song S, Li C, Yu J. MeRIP-PF: an easy-to-use pipeline for high-resolution peak-finding in MeRIP-Seq data. Genomics, Proteomics Bioinformatics 2013; 11:72-5; http://dx.doi.org/ 10.1016/j.gpb.2013.01.002 [DOI] [PMC free article] [PubMed] [Google Scholar]
- 24. Kawahara Y, de la Bastide M, Hamilton JP, Kanamori H, McCombie WR, Ouyang S, Schwartz DC, Tanaka T, Wu J, Zhou S, et al. Improvement of the Oryza sativa Nipponbare reference genome using next generation sequence and optical map data. Rice 2013; 6:4; PMID:24280374; http://dx.doi.org/ 10.1186/1939-8433-6-4 [DOI] [PMC free article] [PubMed] [Google Scholar]
- 25. Yu J, Hu S, Wang J, Wong GK, Li S, Liu B, Deng Y, Dai L, Zhou Y, Zhang X, et al. A draft sequence of the rice genome (Oryza sativa L. ssp. indica). Science 2002; 296:79-92; PMID:11935017; http://dx.doi.org/ 10.1126/science.1068037 [DOI] [PubMed] [Google Scholar]
- 26. Du Z, Zhou X, Ling Y, Zhang Z, Su Z. agriGO: a GO analysis toolkit for the agricultural community. Nucleic Acids Res 2010; 38:W64-70; PMID:20435677; http://dx.doi.org/ 10.1093/nar/gkq310 [DOI] [PMC free article] [PubMed] [Google Scholar]
- 27. Glisovic T, Bachorik JL, Yong J, Dreyfuss G. RNA-binding proteins and post-transcriptional gene regulation. FEBS Lett 2008; 582:1977-86; PMID:18342629; http://dx.doi.org/ 10.1016/j.febslet.2008.03.004 [DOI] [PMC free article] [PubMed] [Google Scholar]
- 28. Liu J, Yue Y, Han D, Wang X, Fu Y, Zhang L, Jia G, Yu M, Lu Z, Deng X, et al. A METTL3-METTL14 complex mediates mammalian nuclear RNA N6-adenosine methylation. Nat Chem Biol 2014; 10:93-5; PMID:24316715; http://dx.doi.org/ 10.1038/nchembio.1432 [DOI] [PMC free article] [PubMed] [Google Scholar]
- 29. Ping XL, Sun BF, Wang L, Xiao W, Yang X, Wang WJ, Adhikari S, Shi Y, Lv Y, Chen YS, et al. Mammalian WTAP is a regulatory subunit of the RNA N6-methyladenosine methyltransferase. Cell Res 2014; 24:177-89; PMID:24407421; http://dx.doi.org/ 10.1038/cr.2014.3 [DOI] [PMC free article] [PubMed] [Google Scholar]
- 30. Fu Y, Dominissini D, Rechavi G, He C. Gene expression regulation mediated through reversible m(6)A RNA methylation. Nat Rev Genet 2014; 15:293-306; PMID:24662220; http://dx.doi.org/ 10.1038/nrg3724 [DOI] [PubMed] [Google Scholar]
- 31. Wang X, Lu Z, Gomez A, Hon GC, Yue Y, Han D, Fu Y, Parisien M, Dai Q, Jia G, et al. N6-methyladenosine-dependent regulation of messenger RNA stability. Nature 2014; 505:117-20; PMID:24284625; http://dx.doi.org/ 10.1038/nature12730 [DOI] [PMC free article] [PubMed] [Google Scholar]
- 32. Li H, Durbin R. Fast and accurate short read alignment with burrows-wheeler transform. Bioinformatics 2009; 25:1754-60; PMID:19451168; http://dx.doi.org/ 10.1093/bioinformatics/btp324 [DOI] [PMC free article] [PubMed] [Google Scholar]
- 33. Zhao WM, Liu WF, Tian DM, Tang BX, Wang YQ, Yu C, Li R, Ling Y, Wu J, Song S, Hu S. wapRNA: a web-based application for the processing of RNA sequences. Bioinformatics 2011; 27:3076-7; PMID:21896507; http://dx.doi.org/ 10.1093/bioinformatics/btr504 [DOI] [PubMed] [Google Scholar]
- 34. Wang LK, Feng ZX, Wang X, Wang XW, Zhang XG. DEGseq: an R package for identifying differentially expressed genes from RNA-seq data. Bioinformatics 2010; 26:136-8; PMID:19855105; http://dx.doi.org/ 10.1093/bioinformatics/btp612 [DOI] [PubMed] [Google Scholar]
- 35. Benjamini Y, Hochberg Y. Controlling the false discovery rate - a practical and powerful approach to multiple testing. J Roy Stat Soc B Met 1995; 57:289-300. [Google Scholar]
- 36. Bailey TL, Elkan C. Fitting a mixture model by expectation maximization to discover motifs in biopolymers. Proceedings International Conference on Intelligent Systems for Molecular Biology ; ISMB International Conference on Intelligent Systems for Molecular Biology 1994; 2:28-36. [PubMed]
- 37. Heinz S, Benner C, Spann N, Bertolino E, Lin YC, Laslo P, Cheng JX, Murre C, Singh H, Glass CK. Simple combinations of lineage-determining transcription factors prime cis-regulatory elements required for macrophage and B cell identities. Mol Cell 2010; 38:576-89; PMID:20513432; http://dx.doi.org/ 10.1016/j.molcel.2010.05.004 [DOI] [PMC free article] [PubMed] [Google Scholar]
- 38. Ray D, Kazan H, Cook KB, Weirauch MT, Najafabadi HS, Li X, Gueroussov S, Albu M, Zheng H, Yang A, et al. A compendium of RNA-binding motifs for decoding gene regulation. Nature 2013; 499:172-7; PMID:23846655; http://dx.doi.org/ 10.1038/nature12311 [DOI] [PMC free article] [PubMed] [Google Scholar]
- 39. Gupta S, Stamatoyannopoulos JA, Bailey TL, Noble WS. Quantifying similarity between motifs. Genome Biol 2007; 8:R24; PMID:17324271; http://dx.doi.org/ 10.1186/gb-2007-8-2-r24 [DOI] [PMC free article] [PubMed] [Google Scholar]
Associated Data
This section collects any data citations, data availability statements, or supplementary materials included in this article.