Abstract
An extremophilic fungus identified as a Pleurostomophora sp. was isolated from the Berkeley Pit, an acid mine waste lake. When grown in liquid culture the fungus produced berkchaetoazaphilones A-C (1, 2, and 5), the red pigment berkchaetorubramine (6), and the known compound 4-(hydroxymethyl)-quinoline. These compounds were evaluated as inhibitors of matrix metalloproteinase-3, caspase-1 and of proinflammatory cytokine production in induced THP-1 cells. Berkchaetoazaphilone B (2) inhibited IL-1β, TNFα, and IL-6 production in the induced inflammasome assay and was cytotoxic toward human retinoblastoma cell line Y79 (IC50 = 1.1 μM), and leukemia cell lines CCRF-CEM and SR, and the melanoma cell line LOX IMVI (IC50 = 10 μM).
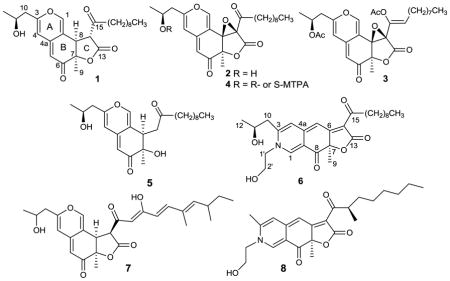
Graphical Abstract
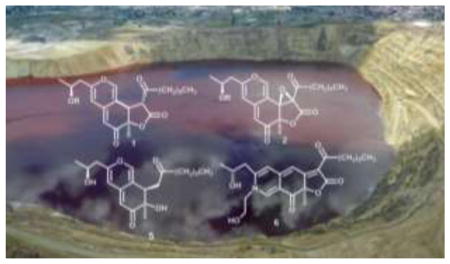
Berkeley Pit Lake, an abandoned open-pit copper mine, is part of the largest EPA Superfund site in North America.1 For the past 15 years this acidic, metal-rich lake has been a rich source of bioactive secondary metabolites produced by extremophilic fungi isolated from Pit water and sediments.2 A filamentous fungus isolated from a water sample collected at a depth of 15 m was identified as a Pleurostomophora sp.3 by 28 S rRNA sequence comparison (closest match, 319 base pairs).4 The organic extracts of this fungus grown in potato dextrose broth inhibited the signal transducing enzymes matrix metalloproteinase-3 (MMP-3) and caspase-1. Inhibition of these enzymes guided compound isolation for this study.
According to the National Cancer Institute, most cancer deaths are associated with metastatic cancer5 and drugs that block metastasis are currently not available.6 MMP-3 promotes epithelial mesenchymal transition (EMT), a critical component of metastatic cancer. EMT is a hallmark of cells undergoing proliferation and differentiation and is characterized by loss of cell adhesion, repression of cell adhesive E-cadherin (E-cad) expression, destruction of the basal lamina, and increased cell mobility.5–8 MMP-3 promotes tumor dissemination and hyperplasia by inducing EMT through activation of MMP-9 (which destroys the basal lamina) and through direct cleavage and repressed synthesis of E-cad.9 Small molecule inhibitors of MMP-3 could mitigate EMT and its role in carcinogenesis.
Inflammation also contributes to EMT and the promotion of the tumor microenvironment, and anti-inflammatory drugs have been shown to reduce the risk of cancer.10 Chronic inflammation involves macrophage accumulation either through recruitment or proliferation and is often associated with cancer initiation and promotion.11 Within the macrophage, the NLRP3 inflammasome assemblage plays an important role in innate immunity.11,12 It activates caspase-1 upon binding, which subsequently activates the pro-inflammatory cytokines IL-1β and IL-18 which can lead to chronic inflammation and the production of reactive oxygen species (ROS). ROS can induce oxidative damage to DNA, which can lead to the initiation and progression of carcinogenesis.11 In this study, the induced THP-1 cell assay was used to assess the ability of caspase-1/MMP-3 inhibitors to block production of pro-inflammatory cytokines in a cellular system that is analogous to a tumor-associated macrophage (TAM) (Supporting Information, S30).2a,b MMP-3 and caspase-1 inhibition assays were used to select for microbial metabolites with activity against specific cancer cell lines associated with the up-regulation of at least one of these enzymes.
The CHCl3 extract of a 10 day shake culture of Pleurostomophora sp. yielded the new compounds berkchaetoazaphilone A (1), berkchaetorubramine (6), and the known compound 4-(hydroxymethyl)-quinoline.2e Following acidification (pH 2.5), the CHCl3 extract yielded berkchaetoazaphilone B (2) and the MeOH soluble mycelial extract yielded berkchaetoazaphilone C (5). The structures of these compounds were established by mass spectrometry and extensive NMR spectroscopy, molecular modeling, ECD, and comparison of spectroscopic data to those of known, related azaphilones.
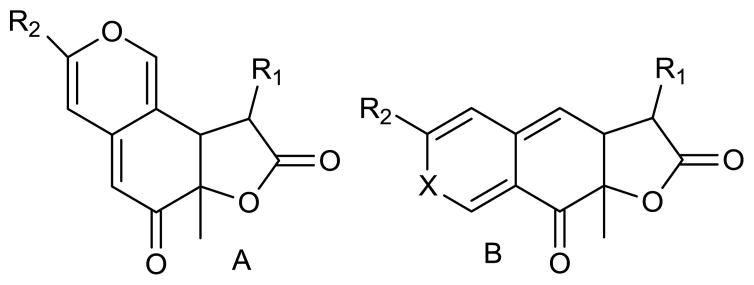
Compound 1 had a molecular formula of C25H34O6 and nine sites of unsaturation, which were established by the HRESIMS [M+H]+ ion of m/z 431.2436. The three carbonyl absorbances in the IR spectrum were attributed to a saturated γ-lactone (1779 cm−1), a saturated ketone (1718 cm−1) and an α,β-unsaturated ketone (1670 cm−1). The out-of-plane bending region exhibited a single sharp absorption at 800 cm−1, more typical of a tri-substituted olefin than of an aromatic ring.13 Although only 24 carbons were observed in the 13C NMR spectrum (CDCl3 or C6D6), correlations in the HSQC spectrum confirmed the presence of two overlapping methylene carbons. The 13C NMR spectrum (Table 1) also showed evidence of both the saturated and the α,β-unsaturated ketone carbonyls (δC 202.3 and 191.5, respectively), an ester carbonyl (δC 168.5) and six olefinic carbons (δC 159.6, 147.5, 144.1, 114.6, 108.5, 106.0). As the three carbonyls, three olefins and the γ-lactone ring accounted for seven of the nine degrees of unsaturation, compound 1 was determined to be tricyclic. The two remaining rings were highly conjugated with an electron donating group at one end and an electron withdrawing group (the α,β-unsaturated ketone carbonyl) at the other end. These data suggested a fused γ-lactone azaphilone.2b Fungally derived tricyclic azaphilones usually adopt either an angular or a linear fused scaffold (Figure 1).14 Angular azaphilones include the chaetoviridins, sassafrin A (7), and monochaetin.14–16 Linear azaphilones include rubropunctatin and monascorubrin.14 Both scaffolds typically have a R1 unit that consists of a proximal ketone carbonyl and variable hydrocarbon chain, and a three carbon R2 unit.14 Comparison of the 1H NMR and COSY data with that of known azaphilones indicated that compound 1 had the same angular scaffold as sassafrin A (7).14,15
Table 1.
| berkchaetoazaphilone A (1) | berkchaetoazaphilone B (2) | berkchaetoazaphilone C (5) | berkchaetorubramine (6) | |||||
|---|---|---|---|---|---|---|---|---|
|
| ||||||||
| no. | δC, type | δH (J in Hz) | δC, type | δH (J in Hz) | δC, type | δH (J in Hz) | δC, type | δH (J in Hz) |
| 1 | 147.5, CH | 7.35, bs | 147.7, CH | 7.44, bs | 146.5, CH | 7.36, s | 144.9, CH | 8.30, s |
| 3 | 159.6, C | 161.0, C | 158.9, C | 154.7, C | ||||
| 4 | 108.5, CH | 6.06, s | 107.6, CH | 6.12, s | 108.4, CH | 6.03, s | 120.0, CH | 7.01, s |
| 4a | 144.1, C | 145.0, C | 145.3, C | 153.7, C | ||||
| 5 | 106.0, CH | 5.35, bs | 105.2, CH | 5.35, bs | 103.4, CH | 5.35, s | 98.6, CH | 6.69, s |
| 6 | 191.5, C | 189.1, C | 198.5, C | 174.2, C | ||||
| 7 | 82.8, C | 84.1, C | 73.1, C | 87.1, C | ||||
| 8 | 42.7, CH | 3.83, d (12.2) | 72.1, C | 40.5, CH | 3.35, dd (10.1, 3.0) | 196.6, C | ||
| 8a | 114.6, C | 108.3, C | 120.5, C | 102.3, C | ||||
| 9 | 22.6, CH3 | 1.55, s | 18.7, CH3 | 1.57, s | 26.7, CH3 | 1.28, s | 30.8, CH3 | 1.65, s |
| 10 | 42.8, CH2 | 2.49, m | 42.7, CH2 | 2.52, d (6.2) | 42.9, CH2 | 2.47, m | 41.4, CH2 | 2.81, m |
| 11 | 65.6, CH | 4.14, m | 65.4, CH | 4.14, m | 65.6, CH | 4.14, m | 68.4, CH | 4.44, bm |
| 12 | 23.2, CH3 | 1.29, d (6.5) | 23.7, CH3 | 1.27, d (6.1) | 23.7, CH3 | 1.26, d (6.4) | 23.9, CH3 | 1.30, d (6.1) |
| 13 | 168.5, C | 165.5, C | 173.9, C | |||||
| 14 | 56.4, CH | 3.70, d (12.2) | 66.8, C | 40.4, CH2 | 3.00, dd (18.6, 3.0) 2.28, m |
122.6, C | ||
| 15 | 202.3, C | 195.6, C | 209.8, C | 199.0, C | ||||
| 16 | 42.8, CH2 | 3.13, dd (18.4, 4.0) 2.48, dd (18.4, 7.9) |
42.0, CH2 | 2.80, dt (17.5, 7.0) 2.58, dt (17.5, 7.0) |
43.5, CH2 | 2.31, m 2.23, m |
40.8, CH2 | 2.96, m 2.81, m |
| 17 | 23.7, CH2 | 1.24, bs | 23.2, CH2 | 1.23, bs | 23.5, CH2 | 1.47, bs | 23.5, CH2 | 1.29, bs |
| 18 | 28.9, CH2 | 1.24, bs | 28.9, CH2 | 1.23, bs | 29.2, CH2 | 1.24, bs | 30.6, CH2 | 1.29, bs |
| 19 | 29.2, CH2 | 1.24, bs | 29.2, CH2 | 1.23, bs | 29.4, CH2 | 1.24, bs | 30.7, CH2 | 1.29, bs |
| 20 | 29.4, CH2 | 1.24, bs | 29.3, CH2 | 1.23, bs | 29.4, CH2 | 1.24, bs | 30.8, CH2 | 1.29, bs |
| 21 | 29.4, CH2 | 1.24, bs | 29.3, CH2 | 1.23, bs | 29.2, CH2 | 1.24, bs | 30.8, CH2 | 1.29, bs |
| 22 | 31.8, CH2 | 1.24, bs | 31.8, CH2 | 1.23, bs | 31.8, CH2 | 1.24, bs | 33.2, CH2 | 1.29, bs |
| 23 | 23.0, CH2 | 1.24, bs | 22.6, CH2 | 1.23, bs | 22.6, CH2 | 1.24, bs | 26.6, CH2 | 1.29, bs |
| 24 | 14.1, CH3 | 0.85, t (6.9) | 14.1, CH3 | 0.85, t (7.0) | 14.1, CH3 | 0.85, t (6.8) | 14.6, CH3 | 0.90, t (7.0) |
| 1′ | 58.1, CH2 | 4.29, bm 4.11, bm |
||||||
| 2′ | 61.8, CH2 | 3.87, bm | ||||||
All assignments are based on COSY, NOE, HSQC and HMBC experiments, 500 MHz for 1H NMR and 125 MHz for 13C NMR.
Figure 1.
Angular (A) and linear (B) fused azaphilone tricyclic systems isolated from fungi, X = O or N.
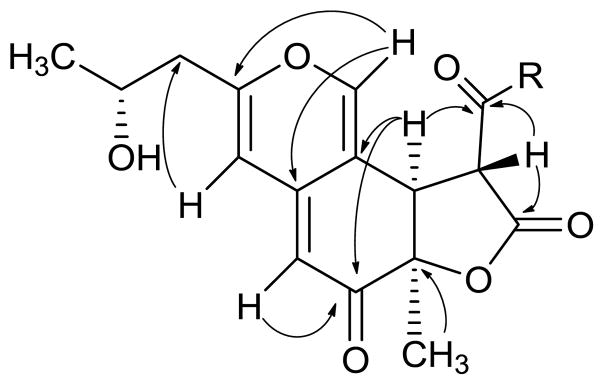
These data also provided evidence of a 1-oxodecyl moiety in the R1 position and a 2-hydroxy-propyl moiety in the R2 position (Figure 1). HMBC data provided adequate support for both of these assignments. Methine H-8 (δH 3.83) and H-14 (δh 3.70) showed correlations to the γ-lactone carbonyl C-13 and to the saturated ketone carbonyl C-15. Methylene H2-16 (δH 3.13 and 2.48) showed strong correlations to C-15, establishing the position of the long chain hydrocarbon substituent on the lactone ring. H-4 showed correlations to methylene C-10, which confirmed the position of the propyl side chain. These key HMBC correlations shown in Figure 2 helped to establish the structure of compound 1 as shown. Comparison of the spectroscopic data of 1 with those of saffranin A,15 monochaetin,16 biscogniazaphilone B,17 and monascuskaolin18 supported this structure. The relative and absolute configurations of 1 and related azaphilones will be addressed in a later section.
Figure 2.
Key HMBC correlations for berkchaetoazaphilone A (1).
Compound 2 gave an [M+H]+ ion of m/z 445.2217 (HRESIMS). It had a molecular formula of C25H32O7 with one more oxygen and degree of unsaturation than 1. Although the NMR spectra (Table 1) and key HMBC correlations were similar to those of 1, the NMR data of 2 indicated the presence of two oxygen-bearing non-protonated carbons at δC 72.1 and 66.8 and the absence of the two spin-coupled methine protons at H-8 and H-14. These data suggested the presence of a C-8-C-14 epoxide, which is unprecedented in this family of compounds.
In an HMBC experiment optimized for 8 Hz, methyl singlet H3-9 (δH 1.57) and singlet olefins H-1 and H-4 (δH 7.44, 6.12, respectively) showed correlations to epoxide C-8 (δC 72.1). When the HMBC experiment was optimized for 3 Hz, methylene H-16 (δH 2.80) showed a correlation to epoxide C-14 (δC 66.8), which established the structure as berkchaetoazaphilone B (2). When treated with pyridine and acetic anhydride, compound 2 formed a diacetate (3). Inspection of the spectroscopic data suggested the formation of a C-11 acetate and an enol acetate at C-15 (the configuration of the enol acetate was not determined). Epoxides exert a strong inductive electron withdrawing effect which would render H2-16 more acidic and facilitate enol-acetate formation.19
Fractionation of the MeOH extract of the mycelia yielded compound 5 which had a molecular formula of C24H36O5 (HRESIMS) with seven sites of unsaturation. It had one less carbon than either 1 or 2 and two less sites of unsaturation. The IR spectrum showed evidence of the saturated and α-β-unsaturated ketone carbonyls (1710 and 1673 cm−1 respectively), but not of the γ-lactone. The 1H NMR spectrum of 5 included resonances that supported the presence of the bicyclic azaphilone skeleton and the two aliphatic side chains found in compounds 1 and 2. The 13C NMR spectrum of 5 showed no evidence of lactone carbonyl C-13 and indicated that the C-14 methine (compound 1) was replaced by a methylene. The 1 H NMR spectrum of 5 indicated the presence of a CH-CH2 moiety, C-8-C-14. These data, as well as all HMBC and COSY correlations, were accommodated by 5. When the 1H NMR spectrum of 5 was recorded in CDCl3, H3-9, H3-12 and methylene protons overlapped. When recorded in C6D6, H3-9 was well resolved at δH 1.35. The NOESY spectrum recorded in C6D6 showed a cross-peak between H3-9 and H-8 (δH 3.52), indicating a cis- relationship consistent with compounds 1 and 2. Compound 5 could be functionally derived by opening the lactone ring in 1, with subsequent decarboxylation of the resulting β-ketoacid to give 5.
Defining the stereoconfiguration of compound 1 was an interesting exercise. Numerous attempts were made to crystallize compounds 1 and 2, but X-ray quality crystals have remained elusive. We could find no reports in the literature of X-ray data for tricyclic azaphilones related to 1 with H-8-H-14 present, so NOE correlations, chiral derivatives, and ECD spectra provided evidence for 3D assignments. The 2D-NOESY spectrum showed a correlation between H-8 and H3-9 which could only be accommodated by if they were on the same side of the ring. However, establishing the relationship between H-8 and H-14 was not as straightforward. In five-membered rings, coupling constants can be similar in magnitude for both cis- and trans- vicinal protons, and NOE correlations can be present in both cases.20 For example, H-8 and H-14 were assigned as cis- in sassafrin A (7) (J = 12.4)15 and as trans- in biscogniazaphilone B17 and monascuskaolin (J = 12.0).18 Energy minimized conformers of both the cis- and trans- diastereomers of 1 were generated to facilitate correlation of spectroscopic data with structure.21 H-14 showed an NOE correlation to H-8 and H2-16, but not to H3-9. However, energy minimized structures of both H-14 epimers indicated that H3-9 and H-14 were too far apart for NOE correlations whether they had a cis- (4.68 Å) or trans- (4.12 Å) relationship (Supporting Information, Figure S27). However, the magnitude of the 3J8–14 coupling constant (J = 12.2) could be correlated to the dihedral angle between H-8 and H-14 using a modified Karplus equation appropriate for five-membered rings (Figure S28).22 When a five-membered ring assumes an envelope conformation, Jcis > Jtrans, with Jmax of 10–11 Hz when the two protons are eclipsing (dihedral angle = 0º). However, when the ring assumes a skewed conformation as in 1, Jtrans > Jcis, with Jmax approaching 12–13 Hz when the dihedral angle approaches 180º. Energy minimized models of 1 showed a dihedral angle of 164º for trans-H-8-H-14 with 3J8–14 of 12 Hz, and a dihedral angle of 22º for cis-H-8-H-14 with 3J8–14 of 8.5–9 Hz. This analysis supported the trans- relationship and the configuration as shown.22
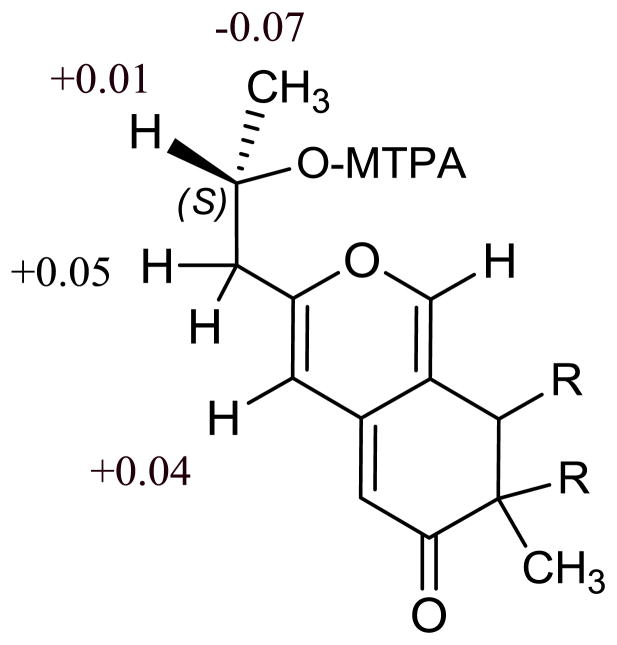
The absolute configuration of C-7 in 1, 2, and 5 was assigned as R based on their ECD spectra (Figure S26), which showed positive Cotton effects at 373 nm (Δε +4.42), 348 nm (Δε +7.66), and 362 nm (Δε +2.58) respectively, which is consistent with other related azaphilones15,18,23,25 The absolute configuration of C-11 was determined using a modified Mosher’s method.24 Compound 1 did not yield a reasonable product so compound 2 was treated with R- or S-methoxy-(trifluoromethyl) phenylacetyl (MTPA) chloride in pyridine to give the corresponding S- or R- esters respectively. Molecular modeling of the resulting esters and consideration of the δ values (Figure 3) indicated that the absolute configuration at C-11 was S, which should be consistent for 1, 2, 5, and 6. These data generated the structure of 1 as shown.
Figure 3.
Selected δΔ values around C-11 of the (R) and (S)-MTPA esters of compound 4. [Δδ=chemical shift of (R)-MTPA ester minus chemical shift of (S)-MTPA ester in ppm].
The relationship between the epoxide (C-8-C-14) and methyl C-9 in compound 2 was established by an NOE correlation between H3-9 and olefinic proton H-5 which could only be accommodated if the epoxide and C-9 were anti- to each other. Extensive molecular modeling studies indicated that the distance between H3-9 and H-5 was 3.70 Å for the anti- relationship and 4.15 Å for the syn- relationship, which exceeds the effective range of NOE (Figure S29).21 Further evidence for the anti- configuration was provided by the NOE correlation between olefinic H-16 and H-1 in diacetate 3. Energy minimized structures were generated for the E- and Z-Δ15 isomers of the syn- and anti- configurations of 3. The distance between H-1 and H-16 was 2.82–3.34 Å for the anti- configuration and 3.96–4.02 Å for the syn- configuration, providing further support for the anti- configuration as shown.
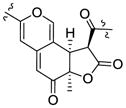
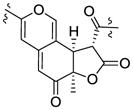
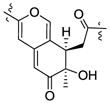
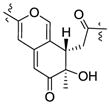
Comparison of the spectroscopic data of several related azaphilones suggested that specific 1H NMR chemical shifts (H-8, H-14 and H3-9) and ECD data could be used to predict stereoconfiguration (Table 2). H3-9 is shielded in compounds with trans-ring junctions like cohaerins G and H25 and chermesinone B26, and deshielded in compounds with cis-ring junctions like sassafrin A (7), monascuskaolin, and compounds 1 and 2.15,18 A similar chemical shift pattern is also seen for H3-9 in the related bicyclic compounds like 5, monapurone A,27 and cohaerins I and K.25 If this pattern is indeed predictive, then longirostrerone C should have a trans-ring junction rather than cis-, as was reported in the literature.28 It is interesting to note that the closely related longirostrerone B was assigned a trans- ring junction. The ring junction of helotialin A should also be reassigned as trans-.29 The authors noted that their assignment of the cis- ring junction was based on the similarity of their compound to cohaerin F,29 which was later revised to the configuration shown.25
Table 2.
Comparison of 1H NMR and ECD data and stereoconfiguration in angular tricyclic azaphilones.
| Compound | H-8 | H3-9 | C-7 | H-14 | ECD (nm) | |
|---|---|---|---|---|---|---|
| Sassafrin A15 | 3.92 (12.4) | 1.60 | R | 3.67 (12.4) | +367, −321, +274 |
|
| Sassafrin B15 | 3.98 (12.4) | 1.59 | R | 3.68 (12.4) | +373, −322, +263 | |
| Longirostrerone C28 | 3.89 (12.9) | 1.42 | R | 4.14 (12.9) | +366, +332, −276 | |
|
| ||||||
| Monascuskaolin18 | 3.86 (12.0) | 1.58 | 3.71 (12.0) |
|
||
| Biscogniazaphilone B17 | 3.86 (12.0) | 1.58 | 3.73 (12.0) | |||
| Berkchaetoazaphilone A (1) | 3.83 (12.2) | 1.55 | R | 3.73 (12.2) | +373, −330, +258 | |
|
| ||||||
| Cohaerin G25 | 3.80 (12.5) | 1.39 | R | 4.08 (12.5) | +350, −272 |

|
| Cohaerin H25 | 3.90 (13.2) | 1.43 | R | 4.11 (12.9) | +350, −273 | |
| Monochaetin16 | 3.76 (12.8) | 1.36 | R | 4.07 (12.8) | ||
|
| ||||||
| Chermesinone B26 | 3.81 (12.9) | 1.36 | Sa | 4.09 (12.9) |

|
|
|
| ||||||
| Monapurone A27 | 3.31 | 1.28 | R | +369, −326, +258 |
|
|
| Berkchaetoazaphilone C (5) | 3.35 | 1.28 | R | +363, −322, +253 | ||
| Helotialin A29 | 3.39 | 1.12 | R | +370, −324, −261 | ||
|
| ||||||
| Cohaerin I25 | 3.26 | 1.11 | R | +366, +319, −245 |
|
|
| Cohaerin K25 | 3.36 | 1.15 | R | +369, +319, −271 | ||
| Longirostrerone B28 | 3.34 | 1.14 | R | +370, +318, −247 | ||
Comparison of ECD data in Table 2 also suggested a trend. The absolute configuration of C-7 in these closely related azaphilones can be assigned by positive Cotton effect around 370 nm (350–390 nm).15,18,23,25 This trend is observed regardless of substituent groups. For example, sassafrin A (7) which has a strong chromophore in the lipid tail attached to C-14 has a value of +367 nm, while compounds that lack a strong chromophore - including compounds 1 and 2, the cohaerins, monapurone and the cohaerins - also show a positive Cotton effect from 350–390 nm.
As mentioned above the magnitude of 3J8–14 could be used to assign a cis- or trans- relationship between H-8-H-14 in this class of azaphilones.22 We hope to validate these hypotheses as they could be useful tools in the structure elucidation of an interesting, bioactive class of molecules.
The CHCl3 extract also yielded a red pigment (6) that had a molecular formula of C27H37NO6 with 10 degrees of unsaturation, as established by the HRESIMS [M+H]+ ion of m/z 472.2634. When run in MeOH-d4, the 13C NMR spectrum showed 27 carbons with two ketone carbonyl carbons (δC 196.6 and 199.0), one ester carbonyl carbon (δC 173.9) and eight olefinic carbons. The remaining degrees of unsaturation required three rings. The NMR data also indicated the presence of both the hydroxypropyl (C-10 – C-12) and the 1-oxodecyl substituents (C-15 – C-24) found in 1, 2, and 5. However, compound 6 also had a single nitrogen connected to a -CH2-CH2-OH group (δH 4.29 m, 4.11 m; and 3.87 m, 2H) and one more additional degree of unsaturation than 1. In the 1H NMR spectrum the chemical shifts of H-1, H-4 and H-5 (δH 8.30, 7.01, and 6.69, respectively) were more typical of a linear azaphilone skeleton.30 The nitrogen containing analogs of several linear and angular azaphilones have been synthesized and the two skeletons can be distinguished by the chemical shifts of these protons.30
The HMBC spectrum showed 3-bond correlations from H-1 (δH 8.30) to ketone carbonyl C-8 (δC 196.6), C-3 (δC 154.7) and to C-1′ (δC 58.1), which connected the hydroxyethyl side chain to the ring system. H-4 (δH 7.01) showed 3-bond correlations to C-5 (δC 98.6) and C-10 (δC 41.4), which provided connectivity between the ring system and the hydroxypropyl moiety. H-5 (δH 6.69) showed 3-bond correlations to C-7 (δC 87.1) and C-4 (δC 120.0). Methyl H3-9 showed 3-bond correlations to C-7 and C-8, and a 4-bond correlation to ester carbonyl C-13. Finally, side chain methylene H2-16 (δH 2.96) showed a 3-bond correlation to C-14 (δC 122.6) which connected the oxodecyl moiety to the ring system and established the structure of the red pigment as 6. These spectroscopic data compared favorably to those of sequoiamonascin D (8), a red pigment isolated from the redwood endophyte Aspergillus parasiticus.31 The configuration of C-11 was assumed to be consistent with compounds 1, 2, and 5.
The known compound 4-(hydroxymethyl) quinoline was identified by careful examination of NMR data and by HRESIMS which yielded an [M+H]+ ion of m/z 160.0763, and a molecular formula of C10H9NO. This compound has been previously isolated from the myxobacterium, Archangium gephyra32 and a wood rotting Polyporus fungus.33
Compounds 1, 2 and 6 inhibited both caspase 1 (IC50 values: 150, 25, and 50 μM, respectively) and MMP-3 (IC50 values: 130, 15, and 45 μM, respectively). The induced THP-1 assay was used to assess their abilities to block production of proinflammatory cytokines in a cellular system. In this assay, bacterial LPS and titanium dioxide (TiO2) were used to stimulate the production of specific proinflammatory cytokines and the assemblage of the NLRP3 inflammasome in THP-1 cells (Supporting Information, S30).2a,b Compounds 1, 2, and 6 were administered to induced THP-1 cells and the production of cytokines post-administration was determined. Compound 2 was the most potent: at 10 μM it completely inhibited the production of interleukin 6 (IL-6) and IL-33, and mitigated production of tumor necrosis factor-alpha (TNF-α) and IL-1β by 95%. Compound 1 which lacks the epoxide, shows similar activity at 100 μM, but no effect at 10 μM.
Compounds 1 and 2 were sent to the NCI-Developmental Therapeutics Program and to Memorial Sloan-Kettering Cancer Center (MSKCC) for evaluation as cytotoxic or antiproliferative agents against selected and established cancer cell lines. In the NCI-DTP 60, 1 and 5 were inactive, but 2 had log10 GI50 of 10 μM against leukemia cell lines MOLT-4, RPMI-8226 and SR, and melanoma cell line LOX IMVI and log10 GI90 of 10 μM against leukemia cell line CCRF-CEM. MSKCC human cell lines include retinoblastoma Y79. Compounds were tested using two different protocols: the Alamar Blue Viability Assay34, 35 and the Nuclei Count Proliferation Assay. Compound 2 had an IC50 of 1.1 μM against Y79 (Supporting Information, S31–32).
Experimental Section
General Experimental Procedures
Instrumentation has been previously described.2
Collection, Fermentation, Extraction, and Isolation Procedures
The collection of water samples from the Berkeley Pit, the isolation of the various organisms, and the pilot growths and biological testing of the extracts have been previously described.2 The fungus was identified (best fit) as a Pleurostomophora sp. by Microbial Identification, Inc. Microbial ID, Inc. originally identified the organism as Chaetomium funicola (6.58% difference), but alignment of 319 base pairs of the 28S rRNA gene showed a 99% identity with Pleurostomophora richardsiae. It has therefore been designated as a Pleurostomophora sp. GenBank Accession # KT728826; NRRL repository # 66319.
It was grown in 8 × 500 mL of DIFCO potato dextrose broth in 1 L Erlenmeyer flasks (shaken 180 rpm for 10 days). At harvest time, 20 mL of MeOH was added to each flask and the broth cultures were filtered through cheesecloth to separate the mycelial mat. The filtrate was extracted three times with 500 mL of CHCl3, and the extract was reduced in vacuo to yield CHCl3 extract A (0.0590 g, oil). The filtrate was then acidified to pH 2.5 with 50% H2SO4 and re-extracted with CHCl3 to yield CHCl3 extract B (0.1030 g, oil). The mycelia mat was extracted with 100% MeOH.
CHCl3 extract A was fractionated by flash silica gel column chromatography using a stepwise gradient system of increasing polarity starting with 100% hexanes to 100% IPA (six fractions) followed by 100% MeOH. A red oily pigment that eluted from the flash column with 100% IPA was berkchaetorubramine (6) (4.6 mg). The fraction that eluted with 5% IPA/hexanes was further resolved using semi-preparative silica gel HPLC [Varian Dynamax Microsorb 100-5] in gradient mode from 5% IPA/hexanes to 25% IPA/hexanes over 60 min to yield the known 4-(hydroxymethyl) quinoline (1.2 mg). The fraction that eluted with 10% IPA/hexanes was further resolved using the HPLC conditions as described to yield berkchaetoazaphilone A (1) (12.8 mg). CHCl3 extract B was fractionated by flash silica gel chromatography as described above. Berkchaetoazaphilone B (2, 66.4 mg) eluted with 50% IPA/hexanes. The mycelia MeOH extract (3.2 g) was fractionated by size exclusion column chromatography [LH-20, 1:1 CHCl3-MeOH]. Fraction E was further resolved by gradient flash silica gel chromatography (100% CHCl3 to 100% MeOH). The fraction eluting with 20% MeOH was chromatographed with silica gel HPLC in gradient mode [Varian Dynamax, 10% IPA/hexanes to 50% IPA/hexanes] to yield berkchaetoazaphilone C (5) (2.5 mg).
Berkchaetoazaphilone A (1): colorless oil, [α]20D +4.8 (c 0.65, CHCl3); UV (MeOH) λmax (log ε) 249 (3.79), 360 (4.05) nm; ECD (c 2.32 × 10⁻⁵ M, MeOH) λmax (Δε) 373 (+4.42), 330 (−7.22), 253 (+0.82) nm; IR (CHCl3) νmax 3550, 3010, 2928, 1779, 1718, 1670, 1623, 1553, 1376, 1248 cm−1; 1H NMR and 13C NMR see Table 1; HRESIMS m/z 431.2436 [M + H]+ (calcd for C25H35O6, 431.2434).
Berkchaetoazaphilone B (2): colorless oil, [α]20D +41 (c 0.10, CHCl3); UV (MeOH) λmax (log ε) 245 (3.30), 354 (3.45) nm; ECD (c 4.50 × 10⁻⁵ M, MeOH) λmax (Δε) 348 (+7.66), 312 (−5.42), 283 (+0.57), 245 (+7.77), 213 (−25.26) nm; IR (CHCl3) νmax 3417, 3025, 2929, 2856, 1789, 1718, 1635, 1550, 1263, 1122 cm−1; 1H NMR and 13C NMR see Table 1; HRESIMS m/z 445.2217 [M + H]+ (calcd for C25H33O7, 445.2226).
Acetylation of 2
Compound 2 (1.0 mg) was dissolved in pyridine (40 μL) and Ac2O (40 μL) and stirred for 24 hours. After that time the solvents were removed to give diacetate 3 as an oil. 1H NMR (CDCl3) δH 7.02 (s, H-1), 6.01 (s, H-4), 5.41 (t, J =7.6 Hz, H-16), 5.38 (s, H-5), 5.14 (m, H-11), 2.65 (dd, J =14.7, 7.3 Hz, H-10), 2.54 (dd, J =14.7, 5.6 Hz, H-10), 2.05 (3H, s, OAc), 1.99 (3H, s, OAc), 1.56 (3H, s, H-9), 1.29 (3H, d, J = 6.2 Hz, H-12), 1.24 (bs), 0.86 (3H, t, J = 7.1 Hz, H-24); 13C NMR (CDCl3) δC 190.0 (C, C-6), 170.1 (C, OAc), 168.5 (C, OAc), 166.4 (C, C-13), 158.6 (C, C-3), 144.7 (C, C-4a), 144.4 (CH, C-1), 134.2 (C, C-15), 123.6 (CH, C-16), 109.7 (C, C-8a), 108.5 (CH, C-4), 106.2 (CH, C-5), 83.5 (C, C-7), 71.0 (C, C-8), 67.6 (CH, C-11), 66.7 (C, C-14), 38.8 (CH2, C-10), 31.9 (CH2, C-22), 29.3 (CH2, C-21), 29.2 (CH2, 2C, C-20, C-19), 28.7 (CH2, C-18), 25.2 (CH2, C-17), 22.7 (CH2, C-23), 21.0 (CH3, OAc), 20.4 (CH3, OAc), 19.8 (CH3, C-12), 18.8 (CH3, C-9), 14.1 (CH3, C-24); ESIMS m/z 529 [M + H]+.
Mosher’s Analysis of 2
Compound 2 (1.0 mg) was dissolved in dry pyridine (40 μL) and either the R- or S- stereoisomer of α-methoxy-α-trifluoromethylphenylacetyl chloride (4 μL) added. The mixtures were stirred for 24 hours. After that time, MeOH (400 μL), was added and the solvents removed. The reaction mixtures were then each passed through a small silica gel column and eluted with hexane and increasing amounts of IPA to give the products (4). The product of esterification with R-MTPA-chloride is the S-MTPA-ester and the product of S-MTPA-chloride is the R-MTPA-ester.
(S)-MTPA ester
1H NMR (selected shifts) (CDCl3) δH 1.38 (d, J = 6.4, H-12), 1.59 (s, H-9), 2.70 (m, H-10), 3.45 (OCH3), 5.43 (m, H-11), 7.32 – 7.41 (m, aromatics); ESIMS m/z 661 [M + H]+.
(R)-MTPA ester
1H NMR (selected shifts) (CDCl3) δH 1.45 (d, J =6.4, H-12), 1.58 (s, H-9), 2.65 (m, H-10), 3.50 (OCH3), 5.42 (m, H-11), 7.32 – 7.41 (m, 5 H, aromatics); ESIMS m/z 661 [M + H]+.
Berkchaetoazaphilone C (5): colorless oil, [α]20D +183 (c 0.23, CHCl3); UV (MeOH) λmax (log ε) 246 (3.50), 353 (3.67) nm; ECD (c 4.95 × 10⁻⁴ M, MeOH) λmax (Δε) 362 (+2.58), 322 (−2.57), 253 (+0.79), 228 (−0.442) nm; IR (CHCl3) νmax 3448, 3018, 2856, 1710, 1673, 1616, 1548, 1456, 1371, 1170, 927 cm−1; 1H NMR and 13C NMR (CDCl3) see Table 1; 1H NMR (C6D6) δH 7.17 (s, H-1), 5.48 (s, H-5), 5.44 (s, H-4), 4.53 (bs, OH), 3.53 (m, H-11), 3.52 (dd, J = 10.3, 2.6, H-8), 3.10 (dd, J = 18.0, 2.6, H-14), 2.23 (dd, J = 18.0, 10.3, H-14), 1.85 (m, 3H, H-10, H-16), 1.73 (dt, 16.7, 7.2, H-16), 1.35 (s, 3H, H-9), 1.34-1.1 (m, H-17 – H-23), 0.92 (t, 3H, 6.9, H-24), 0.80 (d, 3H, 6.2, H-12); HRESIMS m/z 405.2634 [M + H]+ (calcd for C24H37O5, 405.2641).
Berkchaetorubramine (6): red oil, [α]20D +5.1 (c 0.75, CHCl3); UV (MeOH) λmax (log ε) 228 (3.94), 269 (3.87), 423 (3.80), 486 (3.92) nm; IR (CHCl3) νmax 3800, 3009, 2928, 2855, 1716, 1637, 1544, 1464cm−1; 1H NMR and 13C NMR see Table 1; HRESIMS m/z 472.2723 [M + H]+ (calcd for C27H38NO6, 472.2699).
Induced Inflammasome Assay; Toxicity Assay; and Cytokine Assays
These assays have been described previously.2a,b (Supporting Information).
Antiproliferative/cytotoxicity Dose Response Studies of the Azaphilone Compounds; Image acquisition and analysis; and Data Analysis & IC50 determinations
These assays have been previously described.2d (Supporting Information).
Supplementary Material
Acknowledgments
We thank NSF grant #CHE-9977213 for acquisition of an NMR spectrometer and the MJ Murdock Charitable Trust Ref # 99009:JVZ:11/18/99 for acquisition of the mass spectrometer. The project described was supported by NIH grants P20GM103546, P20RR16455-04, P20RR017670, 5P30NS055022, and RC2ES018742, and USGS grant # 02HQGR0121. The Macromolecular X-ray Diffraction Core Facility at the University of Montana was supported by a Centers of Biomedical Research Excellence grant from the National Institute of General Medical Sciences (P20GM10356). The HTS Core Facility is partially supported by Mr. William H. Goodwin and Mrs. Alice Goodwin and the Commonwealth Foundation for Cancer Research, the Experimental Therapeutics Center of MSKCC, the William Randolph Hearst Fund in Experimental Therapeutics, the Lillian S Wells Foundation and by an NIH/NCI Cancer Center Support Grant 5 P30 CA008748-44.
Footnotes
Supporting Information. Experimental details including 1H NMR, 13C NMR, COSY, NOESY, HSQC and HMBC spectra for compounds 1, 2, 5 and 6 and ECD spectra for 1 and 2, discussion of 5-membered ring conformation, and details of testing data. The Supporting Information is available free of charge on the ACS Publications website at DOI:
References
- 1.Montana Bureau of Mines and Geology. [accessed 5/16/11];Berkeley Pit and Butte Mine-Flooding Operable Unit. website: http://www.mbmg.mtech.edu/env-berkeley.htm.
- 2.Some of the previous reports of the isolation of secondary metabolites from Berkeley Pit fungi include: Stierle DB, Stierle AA, Patacini B, McIntyre K, Girtsman T, Bolstad E. J Nat Prod. 2011;74:2273–2277. doi: 10.1021/np2003066.Stierle AA, Stierle DB, Girtsman T. J Nat Prod. 2012;75:344–350. doi: 10.1021/np200414c.Stierle AA, Stierle DB. In: Studies in Natural Products Chemistry. Atta-Ur-Rahman, editor. Vol. 39. Elsevier Science; Amsterdam: 2013. pp. 1–44.Stierle AA, Stierle DB, Mitman GG, Snyder S, Antczak C, Djaballah H. Nat Prod Commun. 2014;9:87–90.Stierle AA, Stierle DB. Nat Prod Commun. 2014;9:1037–1044.
- 3.Vijaykrishna D, Mostert L, Jeewon R, Gams W, Hyde KD, Crous PW. Stud Mycol. 2004;50:387–395. [Google Scholar]
- 4.Microbial ID, Inc. originally identified the organism as Chaetomium funicola (6.58% difference), but alignment of 319 base pairs of the 28S rRNA gene showed a 99% identity with Pleurostomophora richardsiae. It has therefore been designated as Pleurostomophora sp. GenBank Accession # KT728826; NRRL repository # 66319.
- 5.Thiery JP, Acioque H, Huang RYJ, Nieto MA. Cell. 2009;139:871–890. doi: 10.1016/j.cell.2009.11.007. [DOI] [PubMed] [Google Scholar]
- 6.American Cancer Society. Cancer Facts & Figures 2014. Atlanta: American Cancer Society; 2014. pp. 17–18. [Google Scholar]
- 7.Radisky DC, Levy DD, Littlepage LE, Hong Liu Nelson CM, Fata JE, Leake D, Godden EL, Albertson DG, Nieto MA, Werb Z, Bissell MJ. Nature. 2005;436:123–127. doi: 10.1038/nature03688. [DOI] [PMC free article] [PubMed] [Google Scholar]
- 8.Comoglio PM, Trusolino L. Nature Medicine. 2005;11:1156–1159. doi: 10.1038/nm1105-1156. [DOI] [PubMed] [Google Scholar]
- 9.Vandooren J, Van den Steen PE, Opdenakker G. Crit Rev Biochem Mol Biol. 2013;48:222–272. doi: 10.3109/10409238.2013.770819. [DOI] [PubMed] [Google Scholar]
- 10.Balkwill F, Charles KA, Mantovani A. Cancer Cell. 2005;7:211–217. doi: 10.1016/j.ccr.2005.02.013. [DOI] [PubMed] [Google Scholar]
- 11.Condeelis J, Pollard JW. Cell. 2006;124:263–266. doi: 10.1016/j.cell.2006.01.007. [DOI] [PubMed] [Google Scholar]
- 12.Franchi L, Eigenbrod T, Muñoz-Planillo R, Nuñez G. Nat Immunol. 2009;10:241–256. doi: 10.1038/ni.1703. [DOI] [PMC free article] [PubMed] [Google Scholar]
- 13.Nakanishi K, Solomon PH. Infrared Absorption Spectroscopy. 2. Chapter 2. Holden-Day; San Francisco: 1977. pp. 17–22. [Google Scholar]
- 14.Gao JM, Yang SX, Qin JC. Chem Rev. 2013;113:4755–4811. doi: 10.1021/cr300402y. [DOI] [PubMed] [Google Scholar]
- 15.Quang DN, Hashimoto T, Fournier J, Stadler M, Radulovic N, Asakawa Y. Tetrahedron. 2005;61:1743–1748. [Google Scholar]
- 16.Steyn PS, Vieggaar R. J Chem Soc, Perkin Trans 1. 1986:1975–1976. [PubMed] [Google Scholar]
- 17.Cheng MJ, Wu MD, Yanai H, Su YS, Chen IS, Yuan GF, Hsieh SY, Chen JJ. Phytochemistry Letters. 2012;5:467–472. [Google Scholar]
- 18.Cheng MJ, Wu MD, Yanai H, Su YS, Yuan GF, Chen YL, Chem IS. Phytochemistry Letters. 2012;5:262–266. [Google Scholar]
- 19.Shudo K, Okamoto T. Tetrahedron. 1977;33:1717–1719. [Google Scholar]
- 20.Claridge TDW. In: Tetrahedron Organic Chemistry Series: High Resolution NMR Techniques in Organic Chemistry. Baldwin JE, Williams FRS, Williams RM, editors. Vol. 19. Pergamon; Amsterdam: 1999. pp. 298–302. [Google Scholar]
- 21.Spartan Pro 06 - Molecular mechanics: MMFF; Single point energy minimization: Hartree-Fock using 3–61G* and STO-3G; Tripos-Sybyl-X 2.1- Molecular mechanics: MMFF94; Energy minimization: Powell’s method; Chem3D Pro 12.0 Molecular Dynamics and energy minimization: MMFF94.
- 22.http://www.nmr.ch.tum.de/home/dames/J_reich_uwisc.pdf
- 23.Steyn PS, Vieggaar R. J Chem Soc, Perkin Trans 1. 1976:204–206. [PubMed] [Google Scholar]
- 24.Seco JM, Quinoa E, Riguera R. Chem Rev. 2004:17–117. doi: 10.1021/cr2003344. [DOI] [PubMed] [Google Scholar]
- 25.Quang DN, Stadler M, Fournier J, Tamita, Hashimoto T. Tetrahedron. 2006;62:6349–6354. [Google Scholar]
- 26.Huang H, Feng X, Xiao Z, Liu L, Li H, Ma L, Lu Y, Ju J, She Z, Lin Y. J Nat Prod. 2011;74:997–1002. doi: 10.1021/np100889v. [DOI] [PubMed] [Google Scholar]
- 27.Li JJ, Shang XY, Li LL, Liu MT, Zheng JQ, Jin ZL. Molecules. 2010;15:1958–1966. doi: 10.3390/molecules15031958. [DOI] [PMC free article] [PubMed] [Google Scholar]
- 28.Panthama N, Kanokmedhakul S, Kanokmedhakul K, Soytong K. J Nat Prod. 2011;74:2395–2399. doi: 10.1021/np2004903. [DOI] [PubMed] [Google Scholar]
- 29.Zou XW, Sun BD, Chen XL, Liu XZ, Che YS. Chin J Nat Med. 2009;7:140–144. [Google Scholar]
- 30.Musso L, Dallavalle S, Merlini L, Bava A, Nasini G, Penco S, Giannini G, Giommarelli C, De Cesare A, Zuco V, Vesci L, Pisano C, Dal Piaz F, De Tommasi N, Zunino F. Bioorg & Med Chem. 2010;18:6031–6043. doi: 10.1016/j.bmc.2010.06.068. [DOI] [PubMed] [Google Scholar]
- 31.Stierle DB, Stierle AA, Bugni T. J Org Chem. 2003;68:4966–4969. doi: 10.1021/jo0340253. [DOI] [PubMed] [Google Scholar]
- 32.Bohlendorf B, Forche E, Bedorf N, Gerth K, Irschik H, Jansen R, Kunze B, Trowitzch-Kienast W, Reichenbach H, Hofle G. Liebigs Ann. 1996:49–53. [Google Scholar]
- 33.Abraham W, Spassov G. Phytochemistry. 1991;30:371–372. [Google Scholar]
- 34.Shum D, Radu C, Kim E, Cajuste M, Shao Y, Seshan VE, Djaballah H. J Enzyme Inhib Med Chem. 2008;23:931–945. doi: 10.1080/14756360701810082. [DOI] [PMC free article] [PubMed] [Google Scholar]
- 35.Mahida JP, Antczak C, DeCarlo D, Champ KG, Francis JH, Marr B, Polans AS, Albert DM, Abramson DH, Djaballah H. PLoS ONE. 2013;8:e59156. doi: 10.1371/journal.pone.0059156. [DOI] [PMC free article] [PubMed] [Google Scholar]
Associated Data
This section collects any data citations, data availability statements, or supplementary materials included in this article.


