

Building a synthetic protein structure and new tools helps determine nanoscale architectural principles for designing assemblies.
Keywords: Protein Design, Self-assembly, symmetry, protein dynamics, conformational change, SAXS, macromolecular crystallography
Abstract
Central challenges in the design of large and dynamic macromolecular assemblies for synthetic biology lie in developing effective methods for testing design strategies and their outcomes, including comprehensive assessments of solution behavior. We created and validated an advanced design of a 600-kDa protein homododecamer that self-assembles into a symmetric tetrahedral cage. The monomeric unit is composed of a trimerizing apex-forming domain genetically linked to an edge-forming dimerizing domain. Enhancing the crystallographic results, high-throughput small-angle x-ray scattering (SAXS) comprehensively contrasted our modifications under diverse solution conditions. To generate a phase diagram associating structure and assembly, we developed force plots that measure dissimilarity among multiple SAXS data sets. These new tools, which provided effective feedback on experimental constructs relative to design, have general applicability in analyzing the solution behavior of heterogeneous nanosystems and have been made available as a web-based application. Specifically, our results probed the influence of solution conditions and symmetry on stability and structural adaptability, identifying the dimeric interface as the weak point in the assembly. Force plots comparing SAXS data sets further reveal more complex and controllable behavior in solution than captured by our crystal structures. These methods for objectively and comprehensively comparing SAXS profiles for systems critically affected by solvent conditions and structural heterogeneity provide an enabling technology for advancing the design and bioengineering of nanoscale biological materials.
INTRODUCTION
Flexibility, modularity, and conformational polymorphism in solution are common features for the function of complex biological macromolecules (1–3). However, these features are difficult to quantitatively define by classical approaches such as x-ray crystallography and electron microscopy (EM). Even greater challenges apply to the problem of characterizing large biological assemblies created by design. Structural polymorphism may be a challenge or a desirable feature depending on design goals. The development of robust design principles that favor structural homogeneity or specific desired heterogeneity are hampered by the lack of systems and tools for testing a combinatorial expansive set of structural modifications in solution.
Motivated by the exciting possibilities of creating novel designed supramolecular protein structures (4–7), strategies for building large assemblies from multiple copies of smaller protein building blocks have been developed and tested (7–16). Despite notable achievements, we estimate that the success rate for designed geometrically specific assemblies is currently only ~10% from assessments of published work. In most cases, the designed nanoassembly either fails to express, aggregates, fails to assemble, or assembles into alternate structures that are often not fully defined. When assembly occurs as intended, architectures may be partially formed or deformed by protein flexibility.
To test the design feature of symmetry and the potential effects of cooperativity on structural regularity and stability, we set out to assemble a symmetric tetrahedral protein cage (14, 15). Our design strategy for this assembly relies on the fusion of two different oligomeric protein domains (that is, a dimer and a trimer) in a specific orientation by using an α-helical linker to join the helical termini of the component domains (Fig. 1A). Initial designs gave polymorphic assemblies (15), so we focused limited mutagenesis near the helical linker to obtain more homogeneous assemblies from which we determined crystal structures (14, 17). The best of the protein cage variants (denoted by PC), referred to here as PCtrip because it had three mutations relative to the original designed sequence, was still distorted by ~20% from a symmetrical configuration (17). These distortions were apparent in varied conformations between monomeric units in the homododecameric assembly. Because PCtrip had shown the greatest symmetry in our constructs, we sought to test modifications to improve symmetry and define its significance for design homogeneity.
Fig. 1. Designed and observed cage symmetry.
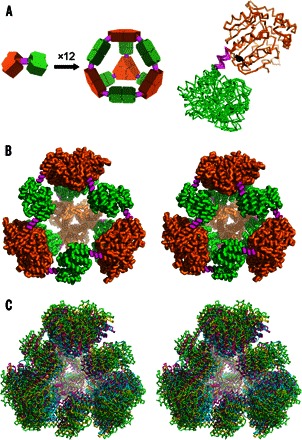
(A) Left: Schematic diagram of the symmetry principles used to design the 12-subunit tetrahedral cage by fusing two oligomeric domains (green and orange) by a semirigid linker (magenta) (14, 15). Right: Single point mutation distinguishing our PCtrip construct from PCquad replaces tyrosine (black sticks) with alanine in the trimeric domain that makes contact with the linker. (B) Side-by-side view of the theoretically designed (perfectly symmetric) model of the protein cage (left) and the most symmetric crystal structure obtained in this work for the PCquad variant (right). (C) Walleyed stereo view of three crystal structures of PCquad (yellow, magenta, and blue) overlaid on the ideal model (green ribbon), showing the agreement of the observed structures and the design.
Hybrid approaches have been critical in testing and improving these complex macromolecular systems (18–21). Design feedback from x-ray crystallography and EM can confirm assembly formation and suggest hypotheses for modifications. However, the stochastic and low-throughput nature of these techniques limits their use for comparing design outcomes with intended structures and assessing the impact of the solution environment.
The development of high-throughput small-angle x-ray scattering (HT-SAXS) facilities (22–25) provides the opportunity to test and develop SAXS as an enabling technology for design projects. HT-SAXS provides sufficient throughput to match the increasing capacity to synthesize large libraries of protein-based nanomaterials for testing. Moreover, SAXS is a solution-based technique, allowing for testing of the impact of solution conditions (19). Applications of SAXS to biological molecules have received widespread attention for its ability to provide shape information on macromolecules in homogeneous solutions. However, SAXS also provides valuable information on the particular ways that molecules in heterogeneous solutions deviate from homogeneous models. These capacities for high-throughput characterizations in solution and sensitivity to heterogeneity serve as motivation for the further development of HT-SAXS methods that can go beyond average shape analysis to reveal insights into the structures of complex mixtures of biological assemblies in solution.
Here, we test the design and consequences of structural modifications for a 600-kDa homododecamer that is intended to assemble into a symmetric tetrahedron. We augment crystallographic results with HT-SAXS by comprehensively identifying solution conditions that promote symmetry and define the effects of amino acid sequence on structural robustness. We measured the solution behavior of design variants by developing and applying new data interpretation algorithms for systematic analyses by HT-SAXS experiments. Our collective results reveal cage symmetry, flexibility, multimeric stability, and conformational transitions as a function of solution environment.
RESULTS
Crystal structures of a designed protein cage
Toward the goal of reducing the degree of structural asymmetry exhibited by PCtrip (the tetrahedral protein cage with three sequence changes), we identified the tyrosine residue in the helix linker that joins the dimeric and trimeric domains as a potential problem (Fig. 1A and fig. S1). To test whether its presence deforms the cage, we introduced an alanine mutation at tyrosine position 51 (Y51A), creating a quadruple mutant, PCquad, relative to the initial design. We solved three new crystal structures of PCquad, with the statistics summarized in Table 1, marking a total of eight crystal structures from our protein cage system, which is summarized in Table 2. As with all our protein cage structures, the diffraction resolution was limited. Nonetheless, clear molecular replacement solutions identified the individual protein components and their assemblies. The appearance of electron density for the α-helical linker (which was not a part of the search model) validated the molecular replacement solutions (fig. S2). Owing to the resolution, refinements were limited to avoid overfitting the observed diffraction data.
Table 1. X-ray diffraction and crystallographic refinement data.
| Space group | I222 | P21212 | P212121 |
| Unit cell dimensions | 123.51, 165.52, 167.67 |
175.50, 147.73, 167.63 |
155.50, 156.52, 325.03 |
| Resolution (Å) | 4.19 | 6.49 | 7.81 |
| Measured reflections | 16,7202 | 56,958 | 34,715 |
| Unique reflections | 12,914 | 9,001 | 8,723 |
| Completeness | 99.7% (96.4%) | 99.6% (96.1%) | 92.1% (77.4%) |
| Rsym | 12.7% (88.5%) | 8.6% (81.9%) | 14.2% (59.7%) |
| I/σ(I) | 14.2 (3.3) | 14.2 (2.3) | 10.7 (2.3) |
| Refinement | |||
| Resolution | 83.83–4.19 | 93.71–6.49 | 91.27–7.81 |
| Asymmetric unit | 3 molecules | 6 molecules | 12 molecules |
| Matthews coefficient | 2.85 | 3.61 | 3.29 |
| Solvent content | 56.85% | 65.97% | 62.61% |
| Data used for refinement |
11,622 | 8,100 | 7,849 |
| Data used for Rfree | 646 | 451 | 437 |
| Final Rwork | 0.251 | 0.271 | 0.288 |
| Final Rfree | 0.295 | 0.324 | 0.339 |
| RMSD | |||
| Bonds (Å) | 0.009 | 0.007 | 0.010 |
| Angles (°) | 1.44 | 1.01 | 1.44 |
| PDB ID | 4QES | 4QF0 | 4QFF |
Table 2. Compared structural features among cage crystal structures.
The degree of asymmetry was taken as the largest difference between elliptical diameters divided by the largest of the three values. The rows are color-grouped by different cage variants: red, original cage structures (14); blue, PCtrip crystal structures (17); green, PCquad structures (this study), including the most symmetric structure obtained to date (4QF0).
| PDB code |
Space group |
Elliptical diameters (Å) |
Asymmetry | RMSD (Å) |
| 3VDX | I222 | 121, 112, 103 | 15% | 17.5 |
| 4D9J | P2221 | 115, 108, 106 | 8% | 17.4 |
| 4IVJ | I222 | 135, 125, 109 | 19% | 12.8 |
| 4IQ4 | P21212 | 123, 112, 103 | 16% | 17.6 |
| 4ITV | P212121 | 130, 118, 100 | 23% | 16.3 |
| 4QES | I222 | 128, 122, 116 | 9.5% | 12.0 |
| 4QF0 | P21212 | 130, 129, 126 | 3.4% | 7.1 |
| 4QFF | P212121 | 138, 121, 119 | 13.8% | 11.6 |
We evaluated the asymmetry in the observed cage structures by comparing the elliptical axis lengths obtained from an analysis of inertial moments following earlier calculations (17): these three axis lengths should be equal for a cubically symmetric structure. Notably, as a group, the PCquad structures were more symmetric than previous cages (Table 2). The P21212 crystal form of the PCquad cage was by far the most symmetric, showing only a 3.4% deviation compared to the previous range of 8 to 23%. The PCquad cage structures are also less distorted by compression than previous designs, as shown by the higher values of their smallest elliptical diameter. The value for the P21212 crystal form of the PCquad cage is 126 Å compared to a previous range of 100 to 109 Å. Owing to their higher symmetry and lesser compression, the PCquad cage structures as a group better match the intended design. The P21212 structure of the PCquad cage matched the designed model within a root mean square deviation (RMSD) of 7.1 Å over 5280 Cα atoms (Fig. 1, B and C) compared to a previous range of 13 to 18 Å.
Solution structures of protein cage variants
To contrast the sequence variants and comprehensively test whether solution conditions substantially modulate their conformations, we conducted systematic SAXS experiments. Crystallographic results from our original design [Protein Data Bank (PDB) IDs: 3VDX and 4D9J (14)], from the PCtrip cage [PDB IDs: 4IVJ, 4IQ4, and 4ITV (17)], and from the PCquad cage (structures reported here; PDB IDs: 4QES, 4QF0, and 4QFF) show a range of conformations. Theoretical SAXS profiles calculated from the crystal structures using the SAXS calculator FoXS (26) indicated that cage conformations should be distinguishable from each other (Fig. 2A).
Fig. 2. Cage conformation and assembly in solution from theoretical and experimental SAXS scattering plots.
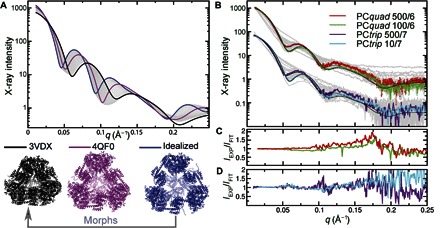
(A) X-ray scattering profiles calculated from the most compact crystal structure (PDB ID: 3VDX; black), the most symmetric and open crystal structure (PDB ID: 4QF0; magenta), and the ideal designed model (blue). Scattering plots calculated from snapshots of a morph between the ideal and compact structures are shown in gray. (B) Observed scattering plots from 64 separate experiments involving the two constructs (PCtrip and PCquad profiles are offset vertically for clarity) under various buffer conditions (gray). Extremes of salt for which cages persisted as the dominant structures are shown in color (labeled as x/y = salt concentration [mM]/pH), along with their fits (black). Ratio of SAXS experiments to fits for (C) PCquad and (D) PCtrip.
Because SAXS can be collected in nearly any solution condition and in high throughput (27), we monitored the structures of PCtrip and PCquad as a function of pH, protein, and salt concentration. No protein concentration dependence was observed in the two cage systems in the purification buffer (fig. S3). We used the simple preparation feature of SAXS by taking a single high-concentration preparation of each cage and diluting it with modifying buffers for a consistent initial starting concentration of 2 mg/ml. We collected data at NaCl concentrations of 10, 100, 300, and 500 mM, varying the pH from 4 to 11 in single unit pH steps. We observed substantial changes in the experimental SAXS profiles from both PCtrip and PCquad, which resemble the differences observed between profiles calculated from the crystal structures (Fig. 2, A and B, and fig. S4).
Under most conditions, SAXS profiles exhibited features indicative of large populations of dodecameric cages, including radii of gyration (Rg) and maximum dimension (Dmax) within the range of the crystal structures (56.1 < Rg < 64.2, 157.5 < Dmax < 176.2). Exponential decays of the SAXS data as a function of q were consistent with limited flexibility (Porod exponents > 3.5) (28). Masses, extracted through the volume of correlation (29), were also within the expected range of 600 kDa (tables S1 to S3). The oscillating maxima and minima are consistent with particles of overall low heterogeneity in solution. Under all but low salt and pH conditions (10/4, 10/5, 10/6, 100/4, and 100/5 for PCtrip and 10/7 for PCquad), the protein remained soluble.
Structural similarities measured comprehensively by force plots
To provide a comprehensive perspective on the 52 (of a total of 64) SAXS data sets collected from conditions with the soluble protein, we developed, tested, and applied new data interpretation tools. We used the recent heat map concept (30) to compare SAXS profiles pairwise and examine conformational variation in response to solution conditions. In each cell of the heat map, two SAXS profiles are scored for agreement (Fig. 3). We also applied a “force plot” method. The force plots embed the set of SAXS curves as points in two-dimensional space, according to their similarities to each other. Each circle or node represents a SAXS profile, and the score for similarity is treated as a force of repulsion between nodes. Thus, two profiles that have a large dissimilarity score have a large repulsive force, which leads to a larger separation in the two-dimensional plot. These objective data interpretation tools, as developed for this work, are available as a web application at sibyls.als.lbl.gov/saxs_similarity.
Fig. 3. Comprehensive determination of cage assembly and conformation in response to salt and pH.
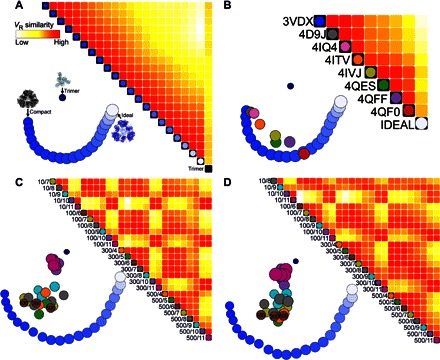
(A) Comparing the agreement of theoretical SAXS data calculated from 21 snapshots of a morph trajectory, between a compact crystal structure (3VDX) and the ideal designed cage, plus a trimer from the crystal representing disassembled cages. Each cell in the heat map matrix compares two SAXS profiles by VR value, with red indicating high similarity and white indicating low similarity. In the lower left part of each panel, the models are arranged in two dimensions in the form of a force plot, where stronger repulsive forces are invoked between models whose calculated SAXS profiles are less similar. The size of each circle reflects the Rg of the corresponding cage structure. The force plot for the trimer and morphed models is included as a “landmark” in subsequent force plots. (B) Heat map and force plots for all eight crystal structures obtained for the cage (PDB code listed). (C and D) Analysis of experimental SAXS data for PCtrip and PCquad, varying salt concentration and pH. Dot color coding is set by pH, and at pH 6 (brown), the micromolar salt concentration is noted. The buffer conditions are labeled as x/y, meaning x mM of salt and pH y.
To gain intuition in the interpretation of these data presentation tools, we used calculated SAXS profiles from a set of 19 morphed structures [movie S1, created with Chimera (31)], ranging from our idealized symmetric structure to our most compact asymmetric crystal structure (our first: PDB code 3VDX; see Table 2). Because there is a quantifiable relationship based on atomic coordinates between each structure along the morphed trajectory, there should also be a clear relationship in our plots if they are to provide insights. A heat map (Fig. 3A) of these SAXS calculations from the morphed snapshots shows a gradient of similarity along the diagonal. This gradient reflects the imposed ordering of the SAXS profiles as sequential steps along the morphed trajectory. In the force plot, the models self-organize in sequential order along a horseshoe-shaped path based on overall structure similarity. In the force plot, additional information about size is conveyed in the diameter of the node, which is proportional to Rg.
Our crystal structures are important points of reference for interpreting our experimental SAXS data. We calculated SAXS from crystal structures (Fig. 3B). In addition, a trimer (one of four that make up a complete assembly) represents a potential assembly intermediate, so a SAXS profile was also calculated and used as a representative subassembly. A heat map of our crystal structure reveals an overall similarity within the multiple structures of PCquad (4QES, 4QFF, and 4QF0), whereas the multiple structures of PCtrip (4IQ4, 4ITV, and 4IVJ) are somewhat split in their similarity patterns.
The force plot allows for useful interpretation of more data sets than heat maps because similar SAXS profiles cluster together. Thus, the SAXS curves calculated from morphs can be displayed in the same force plot as those calculated from our crystal structures. The force plot reenforces the findings in the heat map, but because the morphed structures are also present, it uncovers the trend of the PCquad structures being shifted toward the ideal designed structure. These trends agree with the information extracted directly from the crystallographic atomic models (Table 2).
A heat map of our experimental SAXS data collected from soluble PCtrip and PCquad conditions highlights major trends as a function of pH and salt. The grid-like feature in heat maps (Fig. 3, C and D) is due to a large dissimilarity in the SAXS data at pH 10 and 11, relative to other pH levels. Although aberrations at these high pH levels are expected, they provide insights into heterogeneities occurring in lower quantities at moderate pH. The grid-like features are more notable in PCtrip relative to PCquad, reflecting a steeper transition between states as a function of pH for PCtrip.
We also created force plots for PCtrip and PCquad and used the calculated scattering curves from structures of known atomic coordinates (morphed trajectory, crystal structures, and disassembled cage) as landmarks. In the force plot, nodes are color-coded according to pH, with the pH 11 (magenta) and pH 10 (purple) nodes associating most closely with the SAXS profile calculated from the trimer rather than the morphed model cage structures. As pH is lowered, the SAXS curves diverge from the trimer and find higher agreement with the model cages, as indicated by the vertically layered coloring of nodes in the force plot. This observation suggests that disassembled cages make pH-dependent contributions to the solution population.
Evaluating the effect of salt, within the lower pH conditions, the force plots show a clear trend of conformational change between low salt and high salt. Taking the pH 6 brown nodes in the force plot, low salt conditions associate most closely with the more compact crystal structure; higher salt conditions are translated horizontally toward the more open and symmetric ideal cage. Comparing PCtrip and PCquad, the main population of the PCquad nodes is horizontally shifted toward the more open cage models and constrained to a narrower band of horizontal space relative to PCtrip. This suggests that PCquad preferentially occupies a narrower range of conformations that are more open than PCtrip. However, the vertical continuum of PCquad toward the trimeric model node uncovers greater pH sensitivity for disassembly. No experimental SAXS profile exactly matches the hypothetical morphed models (the horseshoe landmark); however, several colocate with profiles calculated from individual crystal structures (Fig. 3, compare C and D to B). These observations motivated further detailed analysis.
For the heat maps and force plots described above, we found that the volatility of ratio (VR) gave superior performance compared to the commonly used χ2 value in comparing SAXS and providing insight into the underlying structural similarities (figs. S5 and S6). Although χ2 continues to be the default metric for many SAXS studies, it may not be the most insightful for characterizing underlying changes in structure, as we and others have noted (29, 30, 32). The VR criterion is calculated by taking the normalized ratio of two SAXS profiles (Fig. 2, C and D) and measuring its deviation from a flat line (see Materials and Methods) (30). To further understand the different perspectives that heat maps and force plots convey when either χ2 or VR values are used, we compared these scores to those that would be attained with RMSD, where atomic coordinates are available. We find that the VR score from SAXS calculated from models of morphed structures has the same trend and changes with the same order of magnitude as the RMSD calculated from the differences in the corresponding structures (fig. S6). The trend in χ2 was an order of magnitude greater relative to RMSD, further elucidating why χ2 is not an ideal metric for this purpose.
Integrating x-ray scattering data with crystal structures
In a few cases, fits of reasonable quality could be attained using a single crystal structure. The best χ2 agreement was found between PCtrip in 10 mM NaCl (pH 7) and one of its crystal structures (PDB ID: 4ITV), with a value of 3.2. While improving the quality, the fit using ensembles of crystal structures remained unsatisfactory. We expanded our basis set and added morphed models between crystal structures. Because our force plots show a degree of similarity with trimers at high pH values, the basis set was expanded to include disassembled cages (monomers, dimers, and trimers). Aggregated cages, including a full cage plus monomers, dimers, and so on up to 24-mers, were also taken from crystal contacts, forming a final 500-member basis set. A genetic algorithm minimizing the VR score was used to select five calculated profiles and the corresponding population weight percentage, giving the highest quality fit for each experimental SAXS profile (fig. S4). The quality of fit and algorithm speed were significantly enhanced with VR compared to χ2, even as judged by the final χ2 values (see Materials and Methods). For each experimental curve, we tabulated the contributions from disassembled, intact, and aggregated cages (tables S4 and S5).
To further validate the multimeric population distribution that we extracted from the SAXS analysis, we conducted more detailed size exclusion chromatography (SEC) experiments in a retrospective study. From initial purifications of PCtrip and PCquad for SAXS experiments, we note that the PCtrip version showed a smaller proportion of species in elution fractions, which corresponds to larger-than-intended aggregates (that is, n > 12 subunits), and a slightly greater proportion in the correctly assembled form (fig. S7). This minor difference is consistent with the SAXS analysis. We then selected the PCtrip protein for a follow-up analysis of pH dependence using SEC; our analysis of the SAXS data (Fig. 4A) indicated that the cage form was dominant in 100 mM salt at pH ranging from 6 to 9 but not outside these values. In a series of follow-up experiments, SEC elution profiles of PCtrip at a range of pH values showed excellent agreement with the SAXS findings (table S4 and fig. S8). At pH values of 4 and 5, the purified protein mainly aggregated into larger species that were removed by centrifugation, leading to no detectable elution in SEC.
Fig. 4. Solution conditions modulate cage conformation and assembly as determined from fits to SAXS data.
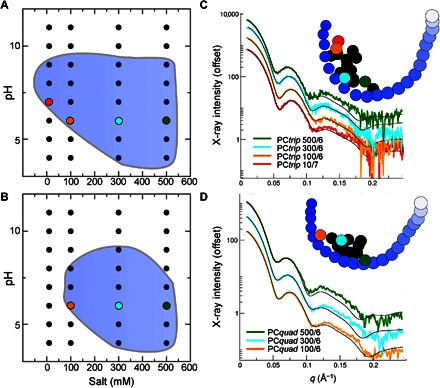
(A and B) Regions shaded in blue represent conditions where the protein is mostly assembled as a 12-subunit tetrahedral cage as designed (>50% by weight). (A) PCtrip. (B) PCquad. The values for cage abundance are determined from fitting the data with an ensemble of models, including cages, trimers, larger multimers found in crystal structures, and morphs between crystal structures. The quality of fits is shown for a subset of SAXS experiments for (C) PCtrip and (D) PCquad. Subtracting the noncage component for all members within the contour yields modified SAXS curves that represent the average conformation sampled in the cage assemblies for each condition. These are placed in a force plot [insets of (C) and (D)], along with the landmark morph trajectory described in the figures above (blue circles). A subset of conditions is color-coded to draw out the trend observed with the following salt concentrations: 10 mM (red), 100 mM (orange), 300 mM (cyan), and 500 mM (green). Multiple SAXS curves are offset vertically for clarity.
At pH values of 10 and 11, the SEC profiles show clear disassembly into smaller species, most likely trimers. To examine whether protein concentration could be used to push the population toward the cage under these disassembling conditions, we collected SAXS data on PCtrip at pH 10 between 2 and 17 mg/ml. Very small concentration dependence was observed. The more laborious SEC experiments provided strong validation for the conclusions obtained from our HT-SAXS experiments.
Excellent fits were obtained with ensembles of the larger basis set. In most cases, small populations of nondodecameric assemblies were required. For example, with the addition of 4% by weight of the trimer, the PCtrip condition 10/7 can be fit with a χ2 agreement below 1. At low salt/low pH values, aggregating cages contributed significantly, whereas at high pH values disassembled cages were more significant, consistent with the results in the force plot analyses. Neither monomers nor dimers contributed significantly. Rather, multimeric states divisible by three made up the disassembled cage contribution, indicating that the dimeric interface is the weak point in the assembly. This observation is in line with previous mutagenesis experiments (17). The fitting analysis provided a basis for comparing the assembly robustness of the two variants. The abundance and most stable condition for cages differed between variants, with a 96% cage for PCtrip in 10 mM NaCl (pH 7) and 77% for PCquad in 100 mM NaCl (pH 7). In Fig. 4 (A and B), we show the contour within which cages compose the major species (greater than 50% by weight in its population), illustrating that the PCtrip cage is stable under a broader range of conditions than PCquad.
The average cage conformation evident across solution conditions was isolated and visualized on a force plot. We restricted the analysis to conditions where cages contribute 50% or greater (blue contour region of Fig. 4, A and B; tables S4 and S5). The noncage contributions affect the scattering curves by reducing the maxima and minima characteristic of scattering from cages (Fig. 2A). With noncage components subtracted, the maxima and minima retain the same q values but become more distinct (Fig. 4, C and D). Efforts to define an accurate population distribution of conformations that fit these SAXS profiles provided degenerate results, with several minimal ensembles providing equivalent fits (fig. S9). Ambiguity in SAXS data and noise level limit further deconvolution of a distribution. However, we could provide a perspective on the average conformation sampled with respect to the morphed structures by mapping the SAXS curve with noncage components subtracted on a force plot (Fig. 4, C and D). When placed on a force plot, many of the same features that were apparent in an analysis of the raw data (Fig. 3) are amplified (Fig. 4). PCtrip samples a wider range of conformations but is centered further toward the more compact structures relative to PCquad. The PCquad structures are more clustered, suggesting a more limited flexibility despite a more expanded conformation, supporting the value of symmetry in stabilizing the expanded form of the cage. Also, the nodes of more conditions colocate with the positions of crystal structures (comparing Fig. 4D with Fig. 3B).
Salt concentration was the primary factor influencing the conformation of both variants (Fig. 4). The pH also had important impacts, particularly in assembly. Together, pH and salt concentration provide a means to control cage conformation and assembly, as monitored by x-ray scattering.
DISCUSSION
Large macromolecular assemblies enable unique processes, but because of their complexity and sometimes for function, they often exhibit heterogeneity at the level of both assembly state and conformation (33, 34). For large protein systems, whether they are of natural or synthetic design, to populate a desired functional state robustly, many features must be optimized. Multitudes of atomic interactions, reinforced across the structure, can lead to cooperative assembly effects that favor homogeneous forms. At the nanoscale, the structure is finely tuned by chemistry and chemical forces, so individual amino acids and their interaction with solvents also have a profound influence. To better understand these principles both as evolving naturally and for protein engineering, we sought to build a novel symmetric tetrahedral protein cage.
The degree of symmetry we observe in crystals and higher salt solutions of our newly reported protein assembly, PCquad, bring us markedly close to attaining our decade-long design goal of creating a fully symmetric tetrahedral protein cage by fusing distinct oligomeric components. The mutation Y51A (PCquad)—one of 450 amino acids in the monomer—substantially influenced conformation and assembly. This modification was undertaken on the basis of a rational examination of the region where the crystal structures of PCtrip, a previous iteration, most deviated from the idealized model, namely, the connecting helix between the trimeric and the dimeric domains was bending over a tyrosine on the dimeric domain. We rationalized that shrinking the volume of this amino acid position would increase the distance between the helix and the proximal domain and reduce the potential for bending the helix.
One of our newly determined crystal structures of the Y51A-containing PCquad variant has the highest degree of symmetry (3% deviation) and the closest agreement with the intended design (7 Å for an object of 160 Å diameter) relative to all other variants we have tested. Given a diversity of crystal structures, we turned to SAXS for further verification of improved symmetry and identification of solution conditions that most support them.
Advances in synchrotron facilities have made HT-SAXS experiments a generally available technology. However, tools that provide insights into comprehensive data sets, such as those we generated on two cage variants in 32 conditions, have yet to be adequately developed. We show that SAXS data can be obtained and analyzed from a wide range of samples, using the heat map and new force plot tools presented, to analyze the conformational changes of a designed protein in response to different solution conditions. As demonstrated in this report, force plots can be interpreted more intuitively when compared to the use of heat maps alone.
Application of our SAXS analysis tools confirmed that the mutated Tyr51 residue has important effects on the symmetry of the assembly, as hypothesized. Through force plots, we see that the PCquad forms more open structures under conditions where PCtrip is more compact. They also showed that most solution experiments were not fit well by any single atomic model, so we used an ensemble-fitting approach that helped further illuminate the average cage conformation and estimate the population of noncage components. We obtained robust interpretations by limiting our ensemble fitting of SAXS data to three multimeric classes: disassembled oligomers, aggregated cages, and intact cages. The analysis was in agreement with the SEC elution profiles (table S4 and figs. S7 and S8), validating this approach. On the basis of SAXS data alone, the exact distribution of cage conformations that make up an ensemble remains necessarily ambiguous, but findings from SAXS analysis could be complemented by other structural methods where feasible. Cryo-EM of a large field could aid in defining the limits of aggregating cages. Nuclear magnetic resonance could be used to define the maximum distortions of the linking helix. These complementary inputs would aid in constraining the degeneracies we found in fitting the SAXS data (fig. S9) for the extraction of greater detail. Although these high levels of detail could be valuable in some cases, during the protein engineering design cycle where even single point mutations can affect the stability and conformation of an entire assembly, SAXS provides a uniquely efficient and comprehensive means for guiding design.
By removing an estimate of the noncage components and displaying the remaining cage contribution on a force plot, we provide key insight into the average conformation sampled relative to atomic resolution models. Given this tendency to form more symmetric structures, it was surprising and informative to find slightly greater multimeric heterogeneity for PCquad relative to PCtrip as a function of salt and pH. Thus, although cooperativity appears to stabilize a symmetric and expanded assembly conformation, it does not necessarily confer greater multimeric specificity.
The fact that we see the salt modifying the compaction of both variants, albeit less so for PCquad, exposes electrostatic screening as a factor controlling solution conformations for large cages. The α-helical linker that connects the dimeric and trimeric domains is highly charged (KAQEAQKQK). Given the salt dependence we observed in the SAXS force plots, the intrinsic flexibility of a lone helix might also play a role as the Y51A change lies adjacent to the helix linker. In a recent publication (35), we observe that the helix linkers in a different fusion system can bend up to 35°. An optimized helix linker that is less affected by changes in salt concentration may lead to a more rigid structure. In addition to the charged semiflexible helix linker, several of our crystal structures show greater variations in the dimeric interface relative to the trimer (17). Multimeric species divisible by three dominated fits in many of the SAXS profiles. Together, both confirm that the trimeric interface is much more stable than the dimeric interface. Stabilization of the dimeric interface is likely to enhance stability.
We have also identified several alternative design goals according to the solution behavior of the cage. For example, to encapsulate and then release cargo, the PCquad system could be tuned to disassemble and assemble under different conditions while maintaining a consistent inner cavity size. In contrast, our crystal structures and SAXS results from PCtrip reveal a wide range of conformations (movie S1). The observed transitions between asymmetry and symmetry have several consequences, including an inner cavity change in volume from approximately 100 to 250 nm3 and an increased surface area. These changes could be used for alternate forms of storage and release.
We expect that the application of HT-SAXS and the new tools we have developed will greatly expedite our design efforts as well as those emerging from the bioengineering field, where reasonable models may be available but high-quality crystal structures are likely to be elusive. Here, we verified the improvement to symmetry through modifying a rationally identified region of the protein. The salt dependence suggests that the high charge on the linker region may be disruptive. Investigating the high pH instability identified the dimeric interface as a weak point in the assembly. Additional modifications with new design goals can now be rapidly assessed with the tools we have developed. We expect that these tools and the general combination of SAXS with crystallography or EM could be increasingly useful in analyzing and optimizing designed protein assemblies and understanding their behavior in solution.
MATERIALS AND METHODS
Protein overexpression and purification
The PCquad overexpression plasmid was derived from the PCtrip plasmid, which was based on a pET22b vector. The Y51A mutation was introduced using a QuikChange mutagenesis kit (Agilent). The PCquad plasmid sequence was sequence-verified before it was transformed into Escherichia coli BL21(DE3) for protein overexpression. Ten milliliters of overnight seed culture was inoculated into 1 liter of LB medium supplemented with ampicillin (100 μg/ml), incubated at 37°C for 2 hours. The temperature was decreased to 18°C, and the culture was incubated for 1 hour before 0.2 mM isopropyl-β-d-thiogalactopyranoside was added for induction. The culture was incubated overnight before harvesting. All the following purification steps were carried out at 4°C. The bacterial culture was harvested by centrifugation at 6000g for 15 min. The cell pellet was resuspended in 50 mM phosphate buffer (pH 8.0), 300 mM NaCl, and 10 mM imidazole and lysed by sonication (Sonics Vibra-Cell VCX500). The cell lysate was centrifuged at 16,000g for 30 min, and the supernatant was filtered and applied to a HisTrap column (GE Healthcare). The column was washed with lysis buffer supplemented with 100 mM imidazole, and the protein was then eluted with 300 mM imidazole. The fractions containing the target protein were pooled and dialyzed overnight in 20 mM Tris (pH 8.0) and 100 mM NaCl. The dialyzed sample was further analyzed by a Superdex 200 size exclusion column (Amersham Pharmacia Biotech) on a fast protein liquid chromatography system. A small peak eluting at the void volume was discarded, whereas a major peak, with an apparent molecular weight of ~600 kDa, was collected. For the purpose of crystallization, the protein sample was concentrated to ~30 to 40 mg/ml.
Crystallization, data collection, and data processing
Crystals were grown at room temperature by hanging-drop vapor diffusion. The I222 crystal form of PCquad was grown in 0.1 M sodium citrate (pH 4.4), 11% polyethylene glycol, molecular weight 3000 (PEG 3,000), and 200 mM NaCl. Dimethyl sulfoxide (25%) was used as cryoprotectant. The P21212 form of the quadruple structure was grown in 0.1 M tris (pH 7.0), 10% PEG 8,000, and 200 mM magnesium chloride with 3% trehalose as additive. Glycerol (25%) was used as cryoprotectant. The P212121 form of the quadruple structure was grown in 0.1 M Na/K phosphate (pH 5.8), 10% PEG 8,000, and 200 mM NaCl. Glycerol was added to a concentration of 30% as cryoprotectant. The data sets for the I222 and P21212 forms were collected using the APS beamline 24-ID-C, and the P212121 data set was collected in-house from a rotating anode x-ray machine (Rigaku FRE+ with HTC detector). All data sets were indexed and scaled using XDS (36).
Molecular replacement and structure refinement
The I222 crystal form contains three protein chains (each is a fusion of two protein domains) in the asymmetric unit. By using a trimer of the trimeric domain (PDB ID: 1BRO) and a monomer of the dimeric domain [PDB ID: 1AA7 (37)] as searching models, the molecular replacement software Phaser (38) identified two complete protein chains and a partial chain containing only a trimeric domain. At this stage, a rigid-body refinement by the REFMAC program (39) gave Rwork/Rfree factors of 0.367 and 0.336. The last dimeric domain was located by the electron density map searching routine implemented in MOLREP (SAPTF+Local Phased RF+Phased TF) (40). After a limited rigid-body refinement, the helix linkers between the trimeric domains and the dimeric domains were built by extracting the most similar linker conformation from existing crystal structures of the other cage variants; only the polyalanine backbone was kept. A final round of restrained all-atom refinement was carried out in REFMAC, with the local noncrystallographic symmetry (NCS) and jelly-body restraints turned on. The final Rwork/Rfree factors are 0.251 and 0.295. The structure in the asymmetric unit represents one-quarter of a cage.
The P21212 crystal form contains six protein chains in the asymmetric unit. By using the native trimeric domains (a complete trimer was used) and the native dimeric domain (either a complete dimer or an individual monomer) as searching models, Phaser could identify all six trimeric domains (as two trimers) and five dimeric domains (as one dimer and three monomers). After rigid-body refinement, the Rwork/Rfree factors were 0.374 and 0.371, and the resulting electron density map showed the density for the missing dimeric domain. The last dimeric domain was located by the electron density map searching algorithm in MOLREP (SAPTF+Local RF+Phased TF). After one round of rigid-body refinement, the helix linkers (as polyalanine) were built by extracting the most similar linker conformation from existing cage structures. A final round of restrained all-atom refinement with NCS, but not the jelly-body option, resulted in the final Rwork/Rfree factors of 0.271 and 0.324. The six chains in the asymmetric unit represent a half cage.
The P212121 crystal form contains 12 protein chains in the asymmetric unit, representing a complete cage. The Phaser program could successfully place 12 trimeric domains (as 4 trimers) and 8 dimeric domains (as 4 dimers). One round of rigid-body refinement resulted in Rwork/Rfree factors of 0.359 and 0.356. The electron density map was used to search for the missing dimeric domains. Only two dimeric domains (as in one dimer) were located by the RF+Phased TF routines in MOLREP. However, after another round of rigid-body refinement, the improved electron density map allowed the identification of the last two dimeric domains (as one dimer) by the RF+Phased TF routines. The helix linkers were then built by extracting the most similar linker from all existing cage structures. A final round of restrained all-atom refinement with NCS restraints led to Rwork/Rfree factors of 0.288 and 0.339. We noted that this crystal structure was the only one with all intact dimeric interfaces. In contrast, all other cage structures (from three cage variants) contained different numbers of dissociated dimeric domains.
SAXS measurements
SAXS data were collected at the SIBYLS beamline (12.3.1) (41) at the Advanced Light Source in Lawrence Berkeley National Laboratory. SIBYLS has implemented a high-throughput data collection strategy coupling synchrotron light with liquid-handling robotics (27). Samples of 18-μl volumes are transferred sequentially from a 96-well plate to the sample holder, which is then exposed to a focused beam of x-rays. The sample-to-detector distance is fixed at 1.5 m. The wavelength was 1 Å. The flux was 1013 photons per second. The beam size at the sample was 4 mm × 1 mm converging to a 100-μm spot at the detector. The sample thickness was fixed at 1 mm. Four exposures were collected from each sample: 0.5, 1, 2, and 5 s. The temperature of data collection was 20°C. A MAR165 detector was used, resulting in the collection of q values ranging 0.01 < q < 0.32 Å−1. Buffer with no protein was collected both before and after sample collection, enabling two subtractions for reduced error in subtraction (42). The MAR165 area detector was concentric, with the beam providing multiple measurements of equivalent q values. Each image collected was circularly integrated and normalized for beam intensity during collection. The one-dimensional profiles were buffer-subtracted using a beamline software specific for 12.3.1 (43).
SAXS data were merged for the highest signal to noise and minimized influence from radiation damage. For the merging, we used the program Scatter. In addition, the Guinier function in Scatter was used to extract the radius of gyration reported in tables S2 and S3.
Sample preparation for SAXS measurements
Using the 96-well plate format for SIBYLS, we collected 32 conditions for each protein cage variant in two separate plates. Plates were prepared at the Yeates laboratory and shipped overnight to SIBYLS. Upon arrival to SIBYLS, they were spun down and stored at 4°C until data collection. Samples were loaded in the order of buffer-sample-buffer. For modifying conditions, we loaded 2-μl volume of concentrated protein stock or protein buffer controls into each well and diluted with 25 μl of buffer of the desired salt and pH. Stock protein was ~30 mg/ml in 20 mM Tris (pH 8.0) and 100 mM NaCl. The diluting buffer was modified to maintain specific pH values: pH 4 to 6, 7 to 9, and 10 to 11 were prepared in MES, tris, and CAPS, respectively. Thus, the initial protein sample in any given well on a plate was identical but then modified by the changing solution environment. Protein concentration for measurement was held constant between wells at ~2.2 mg/ml.
SAXS metrics of similarity
The SAXS heat map or structural conformation map was previously reported (30). The primary metric for comparing profiles was the VR metric defined as
where R is the ratio of the intensities at qi. The VR metric is calculated by taking the ratio of two SAXS profiles, normalizing the ratio so that the average over the range is 1 and binning the resulting ratio at a minimal frequency [Δq = π/d, where q is a function of the scattering angle θ and x-ray wavelength λ and q = 4π[sin(θ/2)]/λ]. By assuming a maximum dimension d < 40 nm, the number of bins N is 25 for q < 0.2 Å−1. The volatility of the binned ratio is then calculated by taking the sum of the absolute value of the difference between sequential bins divided by their average. Volatility is commonly applied for the characterization of time-dependent financial trends. Since first reported, there has been a small practical change in the implementation in that the data are scaled so that all points in the scattering profile are above 1. This is required because VR uses a ratio, and division by values equal or close to 0 leads to singularities when taking the ratio. This had no impact on the data sets reported here because all data were already above this threshold.
The primary rationale for using VR rather than the SAXS standard χ2 is that a ratio is more effective for visually comparing exponentially decaying scattering data than differences. Overall, primary trends of disagreement and agreement are correlated between VR and χ2, as shown in figs. S5 and S6. The χ2 metric uses the sum of the difference between points in a scattering curve with several unwanted consequences for visualization. Small differences in small q strongly outweigh differences in high q in a χ2 comparison. By retaining the exponential decay and dividing by the error in the experiment, χ2 is subject to marked changes in values that exceed the dynamic range needed for effective visualization with human readable colorimetric maps. To provide information for quick interpretation, colorimetric maps are constrained to a range within human discernable gradients. Additional findings for using VR as a target function in search applications are described below in the “Fitting of SAXS data” section.
To test how well VR and χ2 scores of similarity between SAXS curves agree with structural changes that can be measured, we compared the trends of the similarity metrics with RMSD (fig. S6). We used the 20 snapshots of our morph model trajectory that transition from our most compact crystal structure to our idealized open and symmetric structure, as shown in movie S1. Twenty atomic coordinates of the full cage are available, so RMSD was calculated between the first most compact structure and all subsequent structures along the trajectory using Chimera. All 20 models were further input into the SAXS calculator FoXS so that SAXS curves can be compared using VR and χ2. The RMSD ranges from 1.5 (first structure compared to the second) to 30.8 Å (first structure compared to the last). The values of VR range from 3.9 to 46. The values of χ2 range from 1.5 to 157. For visualization purposes, a scale factor that normalizes the minimum value to be equivalent to the minimum RMSD was found for VR and χ2 and applied throughout their ranges.
As shown, the overall magnitude of VR change was similar to that of RMSD, whereas χ2 is one order of magnitude higher. Therefore, in a force plot using χ2, the force of opposition between the first and the last structure is more than an order of magnitude higher, explaining why the two are forced further apart with this metric (fig. S6). VR tracks almost perfectly with RMSD until the 14th structure, after which the relative rate of increase softens a bit. Thus, VR appears to be better at discerning differences when they are smaller. The force of opposition between the first structure and the latter ones is similar, and thus, the distance between the node representing the first and the nodes representing the later structures is similar, creating a cup shape.
SAXS heat map and force plot analysis
The web-accessible map application can be found at sibyls.als.lbl.gov/saxs_similarity and is free for use. The application has been significantly enhanced since first reported. The SAXS similarity web application is a single-page web application powered by jQuery and D3 JavaScript libraries on the front end and PHP on the server. Instructions and a video tutorial are available on the website. The site was used for the analysis reported here.
The main data visualization is a color-coded matrix showing the level of similarity between each pair of scattering curves represented as a color or shade within a specified range. The user has the ability to select from one of the following four similarity metrics: volatility of ratio (default), χ2, Pearson’s coefficient, and Sokolova metric. The user can also select a color range, define the q range for which to calculate the similarity metric (default q range is 0.015 to 0.200 Å−1), and dynamically sort the order of the data set. Sorting methods include a manual sort using click-and-drag behavior, a fast sort using a greedy algorithm, and a slow sort using a rigorous branch and bound algorithm. Each time one of these values changes, the matrix colors are recalculated via pure JavaScript. By doing all the computations on the front end, the responsiveness of the application is still fast even when the internet signal is weak. By clicking on one of the matrix cells, the radii of gyrations of the two scattering profiles being compared are displayed, and the δ value is shown inside the cell. A graph of the two profiles is also displayed under the color matrix. Scattering files can be uploaded by dragging and dropping them into a prominently displayed drop box. On the PHP server, the uploaded scattering profiles are parsed for their q values, scattering intensity, and error. They are interpolated using a spline interpolation to standardize the q values. Only the q values common among all the profiles are returned to the browser. The resulting color matrix and its scattering profile labels can be converted to a PNG image.
The second data visualization tool, the force plot, displays scattering curves represented as circular nodes on a D3 force-directed graph layout implemented using a position Verlet integration to allow simple constraints (https://github.com/d3/d3/blob/master/API.md#forces-d3-force). This layout contains a number of forces that continuously act on nodes in the layout. Charges attract or repel nodes, pseudogravity pulls nodes to the center of the diagram, and links between nodes drive them to have specified distances from each other. Additional custom forces may be defined. The following quantifies the nondefault values of force layout options: charge, −5; linkDistance, linearly scaled to the similarity metric; α, 0.001 (this defines the overall energy); linkStrength, 0.2; friction, 0.95; size, (650 pixels × 500 pixels).
The web application is initially based on the code available in the D3 force layout GitHub page in the previous citation and further developed with the described features. A key is displayed to the left of the force plot, showing the name of each SAXS profile with its node color. The force layout is plotted in an SVG container, with dimensions of 650 pixels × 500 pixels. Node radii are proportional to the radius of gyration of the SAXS profile. The radius is linearly scaled, so the total node area equals 20% of the plot’s area, accounting for data sets with different sizes. Scaling in this way allows focus to be drawn to the differences in the Rg values within any given data set. A link is drawn between each pair of SAXS profiles to represent the user-specified metric of similarity [VR, χ2 (44), Pearson (45), or Sokolova (46)] within the q range defined in the color matrix visualization. The shorter the link is, the more similar the two profiles are. Link distances are linearly scaled from 20 pixels (most similar) to 80% of the force plot width. The user-defined order of scattering profiles is preserved in the force layout in terms of their z index or overlap. The colors of the nodes are assigned by their order. A predefined D3 ordinal color scale, category10, was used to assign colors to nodes (https://github.com/d3/d3/blob/master/API.md#ordinal-scales).
For user interaction, nodes have click-and-drag behavior to manually manipulate the position of nodes on the force layout. This is useful to coax the nodes into alternate local minima configurations in the force layout. Hovering over the key will highlight the associated node in the force layout. Likewise, clicking on any node in the force layout will highlight the associated file name in the key. Hovering over nodes in the force layout will display the file name in a tooltip. Changing the similarity metric smoothly updates the linker lengths between nodes, updating the visualization on the fly. The force plot can be exported as a PNG image.
Fitting of SAXS data
SAXS data were fit by scaling five scattering curves chosen from a 500-member ensemble of curves calculated from a set of atomic models. The search for scale factors applied to the five scattering curves was conducted through an altered form of the genetic algorithm Minimal Ensemble Search (MES) (47), described further below. The atomic models used in the fitting were derived from eight crystal structures plus the idealized model. All models were modified to include a 9–amino acid His tag per monomer. The His tag was added using the program MODELLER (48). Once His tags were added to the eight crystal structures, they were aligned using the “Match Maker” feature in Chimera (31). Twenty morph structures were created from the six distinct crystal structures using the “Morph Conformations” feature in Chimera. Smaller cages were created from crystal structures including five monomers, dimers, trimers, hexamers, and nonamers. Finally, larger structures were created on the basis of crystal packing, including five dimers of cages, cage plus trimer, and cage plus hexamer.
Scattering profiles were calculated by FoXS (26). Because we used the VR as a target/optimization function, there was no need to recalculate the SAXS data for each fit. In contrast, χ2 uses a difference, so each fitting procedure requires scaling to the experimental profile adding to search variables. Given the size of the cage (500 kDa), not needing to recalculate all 500 scattering profiles for all 64 experiments resulted in a substantial saving in computation time. An additional saving in computation time stems from defining VR with Shannon samples, whereas rigorous χ2 involves the entire data set. FoXS was run once, fitting the hydration layer to the PCtrip condition of 100 mM NaCl (pH 7.0). Thus, the scattering curves calculated were used to fit all experimental profiles, removing flexible hydration layer adjustment parameters.
Once the ensemble of curves was calculated, the genetic algorithm MES was applied. MES was altered to optimize for a minimum in VR over the q range of 0.02 to 0.15, capturing the first three maxima and two minima in the SAXS profiles characteristic of the cages. Optimal fits were attained by searching for combinations of the five models. With smaller sets, fits were often of poorer quality, whereas larger sets were of equivalent or poorer quality. Over multiple runs, the five selected members of the set were nearly always of equivalent composition, suggesting that global optima were obtained. Because χ2 is a well-recognized function, we report χ2 values for fits rather than VR.
The minimal ensembles are unlikely to represent a complete description of the true constitution of the population, as previously described (46). There are likely many minimal ensembles with nearly equivalent fits to the data. To provide a perspective on the degree of degeneracy in the minimal ensemble fits, we performed a more detailed analysis on one of the SAXS experiments: PCquad at 500 mM NaCl (pH 7). In this analysis, we repeated the following two-step cycle: (i) find the best-fitting five-member minimal ensemble from our basis set of model scattering curves and (ii) remove the cage component of the newly identified scattering curves from the basis set, shrinking it for the next round. In this way, we found three ensembles with nearly equivalent fits to the data. The first is 97% composed of one conformation, the second with two of nearly equivalent weights to one another, and the third with three significant contributors. Statistically, there is a small difference between these fits, with χ2 agreements of 1.800, 1.806, and 1.811, respectively. These small differences are not sufficiently convincing to distinguish a single state conformation or a distribution with a central conformation. However, they do provide a perspective on the kinds and limits of degeneracy inherent in fitting SAXS data with a minimalist ensemble. The results of this analysis are shown in fig. S9.
Supplementary Material
Acknowledgments
We thank M. Sawaya, D. Cascio, and M. Collazo for contributions to crystallization and in-house x-ray data collection. We thank the staff at APS synchrotron beamline 24-ID-C for support (P41 GM103403, S10 RR029205, and DE-AC02-06CH11357). We thank I. Antselovich and Y. Liu for assistance with SEC experiments. We thank T. Ogorzalek for discussion and proofing. SAXS data collection and analysis at SIBYLS BL12.3.1 at the Advanced Light Source (ALS) was supported by the Integrated Diffraction Analysis Technologies (IDAT) program [U.S. Department of Education (DOE)/Biological and Environmental Research (BER)], by DOE contract DE-AC02-05CH11231, and by NIH MINOS (R01GM105404). Funding: This work was supported by NSF grant CHE-1332907 (T.O.Y.) and by the BER program of the DOE Office of Science (DE-FC02-02ER63421). J.A.T. is supported by the Robert A. Welch Distinguished Chair in Chemistry. J.A.T. acknowledges startup funds from the Cancer Prevention and Research Institute of Texas, and the University of Texas STARs program. Author contributions: All authors contributed to the conceptualization and design of the experiments. Y.-T.L. performed the protein design and crystallographic experiments. G.L.H. and J.A.T. performed the SAXS experiments. K.N.D., G.L.H., H.Y.H.T., and J.A.T. developed the SAXS analysis tools. Y.-T.L., G.L.H., J.A.T., and T.O.Y. wrote the manuscript. Competing interests: The authors declare that they have no competing interests. Data and materials availability: Atomic coordinates have been deposited in the Protein Data Bank under accession codes 4QES, 4QF0, and 4QFF. The heat map and force plot web application is available at http://sibyls.als.lbl.gov/saxs_similarity, along with the SAXS data used in this article. Correspondence and requests for materials should be addressed to T.O.Y. (yeates@mbi.ucla.edu) or J.A.T. (jatainer@lbl.gov).
SUPPLEMENTARY MATERIALS
Supplementary material for this article is available at http://advances.sciencemag.org/cgi/content/full/2/12/e1501855/DC1
fig. S1. Position of the Y51A mutation in PCquad.
fig. S2. Crystallographic density maps of PCquad as found in PDB entry 4QF0.
fig. S3. Testing the concentration dependence of the cage systems.
fig. S4. Scattering profiles and their fits.
fig. S5. Heat map and force plot analysis using VR and χ2.
fig. S6. Comparing RMSD changes measured from atomic models to the similarity of SAXS calculated from the same atomic models.
fig. S7. Purity of PCtrip and PCquad after affinity purification and SEC.
fig. S8. PCtrip multimerization as a function of pH as probed by SEC.
fig. S9. Minimalist ensembles with nearly equivalent fits to SAXS data.
table S1. SAXS-related parameters estimated from crystal structures.
table S2. Summary of buffer effects on SAXS parameters of PCtrip.
table S3. Summary of buffer effects on SAXS parameters of PCquad.
table S4. Multimeric composition from fitting SAXS results from PCtrip.
table S5. Multimeric composition from fitting SAXS results from PCquad.
movie S1. Structural morphing between idealized symmetric structure and most compact asymmetric crystal structure.
REFERENCES AND NOTES
- 1.Bahar I., Lezon T. R., Yang L.-W., Eyal E., Global dynamics of proteins: Bridging between structure and function. Annu. Rev. Biophys. 39, 23–42 (2010). [DOI] [PMC free article] [PubMed] [Google Scholar]
- 2.Rueda M., Ferrer-Costa C., Meyer T., Pérez A., Camps J., Hospital A., Gelpí J. L., Orozco M., A consensus view of protein dynamics. Proc. Natl. Acad. Sci. U.S.A. 104, 796–801 (2007). [DOI] [PMC free article] [PubMed] [Google Scholar]
- 3.Tokuriki N., Tawfik D. S., Protein dynamism and evolvability. Science 324, 203–207 (2009). [DOI] [PubMed] [Google Scholar]
- 4.Božič S., Doles T., Gradišar H., Jerala R., New designed protein assemblies. Curr. Opin. Chem. Biol. 17, 940–945 (2013). [DOI] [PubMed] [Google Scholar]
- 5.Howorka S., Rationally engineering natural protein assemblies in nanobiotechnology. Curr. Opin. Biotechnol. 22, 485–491 (2011). [DOI] [PubMed] [Google Scholar]
- 6.Lai Y.-T., King N. P., Yeates T. O., Principles for designing ordered protein assemblies. Trends Cell Biol. 22, 653–661 (2012). [DOI] [PubMed] [Google Scholar]
- 7.King N. P., Lai Y.-T., Practical approaches to designing novel protein assemblies. Curr. Opin. Struct. Biol. 23, 632–638 (2013). [DOI] [PubMed] [Google Scholar]
- 8.Hoersch D., Roh S.-H., Chiu W., Kortemme T., Reprogramming an ATP-driven protein machine into a light-gated nanocage. Nat. Nanotechnol. 8, 928–932 (2013). [DOI] [PMC free article] [PubMed] [Google Scholar]
- 9.Kobayashi N., Yanase K., Sato T., Unzai S., Hecht M. H., Arai R., Self-assembling nano-architectures created from a protein nano-building block using an intermolecularly folded dimeric de novo protein. J. Am. Chem. Soc. 137, 11285–11293 (2015). [DOI] [PubMed] [Google Scholar]
- 10.Beck T., Tetter S., Künzle M., Hilvert D., Construction of Matryoshka-type structures from supercharged protein nanocages. Angew. Chem. Int. Ed. Engl. 54, 937–940 (2015). [DOI] [PubMed] [Google Scholar]
- 11.Fletcher J. M., Harniman R. L., Barnes F. R. H., Boyle A. L., Collins A., Mantell J., Sharp T. H., Antognozzi M., Booth P. J., Linden N., Miles M. J., Sessions R. B., Verkade P., Woolfson D. N., Self-assembling cages from coiled-coil peptide modules. Science 340, 595–599 (2013). [DOI] [PMC free article] [PubMed] [Google Scholar]
- 12.Lai Y.-T., Reading E., Hura G. L., Tsai K.-L., Laganowsky A., Asturias F. J., Tainer J. A., Robinson C. V., Yeates T. O., Structure of a designed protein cage that self-assembles into a highly porous cube. Nat. Chem. 6, 1065–1071 (2014). [DOI] [PMC free article] [PubMed] [Google Scholar]
- 13.King N. P., Sheffler W., Sawaya M. R., Vollmar B. S., Sumida J. P., André I., Gonen T., Yeates T. O., Baker D., Computational design of self-assembling protein nanomaterials with atomic level accuracy. Science 336, 1171–1174 (2012). [DOI] [PMC free article] [PubMed] [Google Scholar]
- 14.Lai Y.-T., Cascio D., Yeates T. O., Structure of a 16-nm cage designed by using protein oligomers. Science 336, 1129 (2012). [DOI] [PubMed] [Google Scholar]
- 15.Padilla J. E., Colovos C., Yeates T. O., Nanohedra: Using symmetry to design self assembling protein cages, layers, crystals, and filaments. Proc. Natl. Acad. Sci. U.S.A. 98, 2217–2221 (2001). [DOI] [PMC free article] [PubMed] [Google Scholar]
- 16.Song W. J., Tezcan F. A., A designed supramolecular protein assembly with in vivo enzymatic activity. Science 346, 1525–1528 (2014). [DOI] [PubMed] [Google Scholar]
- 17.Lai Y.-T., Tsai K.-L., Sawaya M. R., Asturias F. J., Yeates T. O., Structure and flexibility of nanoscale protein cages designed by symmetric self-assembly. J. Am. Chem. Soc. 135, 7738–7743 (2013). [DOI] [PMC free article] [PubMed] [Google Scholar]
- 18.Ward A. B., Sali A., Wilson I. A., Integrative structural biology. Science 339, 913–915 (2013). [DOI] [PMC free article] [PubMed] [Google Scholar]
- 19.Putnam C. D., Hammel M., Hura G. L., Tainer J. A., X-ray solution scattering (SAXS) combined with crystallography and computation: Defining accurate macromolecular structures, conformations and assemblies in solution. Q. Rev. Biophys. 40, 191–285 (2007). [DOI] [PubMed] [Google Scholar]
- 20.Usselman R. J., Walter E. D., Willits D., Douglas T., Young M., Singel D. J., Monitoring structural transitions in icosahedral virus protein cages by site-directed spin labeling. J. Am. Chem. Soc. 133, 4156–4159 (2011). [DOI] [PubMed] [Google Scholar]
- 21.Shi J., Koteiche H. A., McHaourab H. S., Stewart P. L., Cryoelectron microscopy and EPR analysis of engineered symmetric and polydisperse Hsp16.5 assemblies reveal determinants of polydispersity and substrate binding. J. Biol. Chem. 281, 40420–40428 (2006). [DOI] [PubMed] [Google Scholar]
- 22.Round A., Felisaz F., Fodinger L., Gobbo A., Huet J., Villard C., Blanchet C. E., Pernot P., McSweeney S., Roessle M., Svergun D. I., Cipriani F., BioSAXS sample changer: A robotic sample changer for rapid and reliable high-throughput X-ray solution scattering experiments. Acta Crystallogr. D Biol. Crystallogr. 71, 67–75 (2015). [DOI] [PMC free article] [PubMed] [Google Scholar]
- 23.Franke D., Kikhney A. G., Svergun D. I., Automated acquisition and analysis of small angle X-ray scattering data. Nucl. Instrum. Methods Phys. Res. A 689, 52–59 (2012). [Google Scholar]
- 24.Nielsen S. S., Møller M., Gillilan R. E., High-throughput biological small-angle X-ray scattering with a robotically loaded capillary cell. J. Appl. Crystallogr. 45, 213–223 (2012). [DOI] [PMC free article] [PubMed] [Google Scholar]
- 25.Martel A., Liu P., Weiss T. M., Niebuhr M., Tsuruta H., An integrated high-throughput data acquisition system for biological solution X-ray scattering studies. J. Synchrotron Radiat. 19, 431–434 (2012). [DOI] [PMC free article] [PubMed] [Google Scholar]
- 26.Schneidman-Duhovny D., Hammel M., Tainer J. A., Sali A., Accurate SAXS profile computation and its assessment by contrast variation experiments. Biophys. J. 105, 962–974 (2013). [DOI] [PMC free article] [PubMed] [Google Scholar]
- 27.Hura G. L., Menon A. L., Hammel M., Rambo R. P., Poole F. L. II, Tsutakawa S. E., Jenney F. E. Jr, Classen S., Frankel K. A., Hopkins R. C., Yang S.-j., Scott J. W., Dillard B. D., Adams M. W. W., Tainer J. A., Robust, high-throughput solution structural analyses by small angle X-ray scattering (SAXS). Nat. Methods 6, 606–612 (2009). [DOI] [PMC free article] [PubMed] [Google Scholar]
- 28.Rambo R. P., Tainer J. A., Characterizing flexible and intrinsically unstructured biological macromolecules by SAS using the Porod-Debye law. Biopolymers 95, 559–571 (2011). [DOI] [PMC free article] [PubMed] [Google Scholar]
- 29.Rambo R. P., Tainer J. A., Accurate assessment of mass, models and resolution by small-angle scattering. Nature 496, 477−481 (2013). [DOI] [PMC free article] [PubMed] [Google Scholar]
- 30.Hura G. L., Budworth H., Dyer K. N., Rambo R. P., Hammel M., McMurray C. T., Tainer J. A., Comprehensive macromolecular conformations mapped by quantitative SAXS analyses. Nat. Methods 10, 453–454 (2013). [DOI] [PMC free article] [PubMed] [Google Scholar]
- 31.Pettersen E. F., Goddard T. D., Huang C. C., Couch G. S., Greenblatt D. M., Meng E. C., Ferrin T. E., UCSF chimera—A visualization system for exploratory research and analysis. J. Comput. Chem. 25, 1605–1612 (2004). [DOI] [PubMed] [Google Scholar]
- 32.Franke D., Jeffries C. M., Svergun D. I., Correlation map, a goodness-of-fit test for one-dimensional X-ray scattering spectra. Nat. Methods 12, 419−422 (2015). [DOI] [PubMed] [Google Scholar]
- 33.Hammel M., Yu Y., Mahaney B. L., Cai B., Ye R., Phipps B. M., Rambo R. P., Hura G. L., Pelikan M., So S., Abolfath R. M., Chen D. J., Lees-Miller S. P., Tainer J. A., Ku and DNA-dependent protein kinase dynamic conformations and assembly regulate DNA binding and the initial non-homologous end joining complex. J. Biol. Chem. 285, 1414–1423 (2010). [DOI] [PMC free article] [PubMed] [Google Scholar]
- 34.Deshpande R. A., Williams G. J., Limbo O., Scott Williams R., Kuhnlein J., Lee J.-H., Classen S., Guenther G., Russell P., Tainer J. A., Paull T. T., ATP-driven Rad50 conformations regulate DNA tethering, end resection, and ATM checkpoint signaling. EMBO J. 33, 482–500 (2014). [DOI] [PMC free article] [PubMed] [Google Scholar]
- 35.Lai Y.-T., Jiang L., Chen W., Yeates T. O., On the predictability of the orientation of protein domains joined by a spanning alpha-helical linker. Protein Eng. Des. Sel. 28, 491–500 (2015). [DOI] [PubMed] [Google Scholar]
- 36.Kabsch W., XDS. Acta Crystallogr. D Biol. Crystallogr. 66, 125–132 (2010). [DOI] [PMC free article] [PubMed] [Google Scholar]
- 37.Sha B. D., Luo M., Structure of a bifunctional membrane-RNA binding protein, influenza virus matrix protein M1. Nat. Struct. Biol. 4, 239–244 (1997). [DOI] [PubMed] [Google Scholar]
- 38.Mccoy A. J., Grosse-Kunstleve R. W., Adams P. D., Winn M. D., Storoni L. C., Read R. J., Phaser crystallographic software. J. Appl. Crystallogr. 40, 658–674 (2007). [DOI] [PMC free article] [PubMed] [Google Scholar]
- 39.Vagin A. A., Steiner R. A., Lebedev A. A., Potterton L., McNicholas S., Long F., Murshudov G. N., REFMAC5 dictionary: Organization of prior chemical knowledge and guidelines for its use. Acta Crystallogr. D Biol. Crystallogr. 60, 2184–2195 (2004). [DOI] [PubMed] [Google Scholar]
- 40.Vagin A., Teplyakov A., MOLREP: An automated program for molecular replacement. J. Appl. Crystallogr. 30, 1022–1025 (1997). [Google Scholar]
- 41.Classen S., Hura G. L., Holton J. M., Rambo R. P., Rodic I., McGuire P. J., Dyer K., Hammel M., Meigs G., Frankel K. A., Tainer J. A., Implementation and performance of SIBYLS: A dual endstation small-angle X-ray scattering and macromolecular crystallography beamline at the advanced light source. J. Appl. Crystallogr. 46, 1–13 (2013). [DOI] [PMC free article] [PubMed] [Google Scholar]
- 42.Classen S., Rodic I., Holton J., Hura G. L., Hammela M., Tainera J. A., Software for the high-throughput collection of SAXS data using an enhanced Blu-Ice/DCS control system. J. Synchrotron Radiat. 17, 774–781 (2010). [DOI] [PMC free article] [PubMed] [Google Scholar]
- 43.Dyer K. N., Hammel M., Rambo R. P., Tsutakawa S. E., Rodic I., Classen S., Tainer J. A., Hura G. L., High-throughput SAXS for the characterization of biomolecules in solution: A practical approach. Methods Mol. Biol. 1091, 245–258 (2014). [DOI] [PMC free article] [PubMed] [Google Scholar]
- 44.Svergun D. I., Barberato C., Koch M. H. J., CRYSOL—A program to evaluate x-ray solution scattering of biological macromolecules from atomic coordinates. J. Appl. Crystallogr. 28, 768–773 (1995). [Google Scholar]
- 45.Yang Y. D., Faraggi E., Zhao H. Y., Zhou Y. Q., Improving protein fold recognition and template-based modeling by employing probabilistic-based matching between predicted one-dimensional structural properties of query and corresponding native properties of templates. Bioinformatics 27, 2076–2082 (2011). [DOI] [PMC free article] [PubMed] [Google Scholar]
- 46.Sokolova A. V., Volkov V. V., Svergun D. I., Database for rapid protein classification based on small-angle X-ray scattering data. Crystallogr. Rep. 48, 959–965 (2003). [Google Scholar]
- 47.Pelikan M., Hura G. L., Hammel M., Structure and flexibility within proteins as identified through small angle X-ray scattering. Gen. Physiol. Biophys. 28, 174–189 (2009). [DOI] [PMC free article] [PubMed] [Google Scholar]
- 48.Marti-Renom M. A., Stuart A. C., Fiser A., Sánchez R., Melo F., Šali A., Comparative protein structure modeling of genes and genomes. Annu. Rev. Biophys. Biomol. Struct. 29, 291–325 (2000). [DOI] [PubMed] [Google Scholar]
Associated Data
This section collects any data citations, data availability statements, or supplementary materials included in this article.
Supplementary Materials
Supplementary material for this article is available at http://advances.sciencemag.org/cgi/content/full/2/12/e1501855/DC1
fig. S1. Position of the Y51A mutation in PCquad.
fig. S2. Crystallographic density maps of PCquad as found in PDB entry 4QF0.
fig. S3. Testing the concentration dependence of the cage systems.
fig. S4. Scattering profiles and their fits.
fig. S5. Heat map and force plot analysis using VR and χ2.
fig. S6. Comparing RMSD changes measured from atomic models to the similarity of SAXS calculated from the same atomic models.
fig. S7. Purity of PCtrip and PCquad after affinity purification and SEC.
fig. S8. PCtrip multimerization as a function of pH as probed by SEC.
fig. S9. Minimalist ensembles with nearly equivalent fits to SAXS data.
table S1. SAXS-related parameters estimated from crystal structures.
table S2. Summary of buffer effects on SAXS parameters of PCtrip.
table S3. Summary of buffer effects on SAXS parameters of PCquad.
table S4. Multimeric composition from fitting SAXS results from PCtrip.
table S5. Multimeric composition from fitting SAXS results from PCquad.
movie S1. Structural morphing between idealized symmetric structure and most compact asymmetric crystal structure.