Abstract
Purpose
The presence of vascular calcifications helps to determine percutaneous access for interventional vascular procedures and has prognostic value for future cardiovascular events. Unlike CT, standard MRI techniques are insensitive to vascular calcifications. In this prospective study, we tested a proton density-weighted, in-phase (PDIP) 3D stack-of-stars gradient-echo pulse sequence with approximately 1 mm3 isotropic spatial resolution at 1.5 Tesla and 3 Tesla to detect ilio-femoral peripheral vascular calcifications and correlated MR-determined lesion volumes with CT angiography.
Methods
The study was approved by the Institutional Review Board. The prototype PDIP stack-of-stars pulse sequence was applied in 12 patients with ilio-femoral peripheral vascular calcifications who had undergone CT angiography.
Results
Vascular calcifications were well visualized in all subjects, excluding segments near prostheses or stents. The location, size and shape of the calcifications were similar to CTA. Quantitative analysis showed excellent correlation (r2 = 0.84, p<0.0001) between MR- and CT-based measures of calcification volume. In one subject in whom three pulse sequences were compared, PDIP stack-of-stars outperformed Cartesian 3D gradient-echo and PETRA.
Conclusion
In this pilot study, a PDIP 3D stack-of-stars gradient-echo pulse sequence with high spatial resolution provided excellent image quality and accurately depicted the location and volume of ilio-femoral vascular calcifications.
Keywords: vascular calcifications, stack-of-stars radial, quiescent-interval slice-selective, MR angiography
INTRODUCTION
The presence of calcifications in atherosclerotic plaques or within the arterial media is common in the older population, particularly in those with diabetes, chronic renal disease or peripheral vascular disease (PAD) (1,2). Demonstration of vascular calcifications is desirable for several reasons, including guidance of percutaneous access for interventional vascular procedures and as a biomarker for future cardiovascular adverse events (3–5). Cross-sectional imaging of vascular calcifications relies on the use of computed tomography (CT). However, CT has the drawbacks of blooming artifact from dense calcifications and exposure to ionizing radiation. For CT angiography (CTA), the need for iodinated contrast media precludes its use in patients with impaired renal function.
Arterial calcifications are poorly visualized using standard MRI and MR angiographic (MRA) techniques. Nevertheless, it was recently reported that projection images of vascular calcifications can be demonstrated in patients with PAD (6). In that study, vascular calcifications were depicted using a prototype ultra-short TE sequence (3D point-wise encoding time reduction with radial acquisition - PETRA) (7), as well as a Cartesian-based 3D gradient-echo sequence. However, each of these techniques has limitations. For instance, the use of a spatially non-selective excitation renders the PETRA acquisition sensitive to motion arising from moving tissues anywhere within the imaging volume, which introduces blurring. 3D Cartesian gradient-echo sequences suffer from chemical shift-related dark band artifacts at fat/water interfaces that can mimic or obscure vascular calcifications on minimum intensity projection images.
With these limitations in mind, we developed an alternative MR approach utilizing a proton density-weighted, in-phase (PDIP) 3D stack-of-stars gradient-echo pulse sequence to detect peripheral vascular calcifications. We evaluated the accuracy of the technique for measuring calcification volumes in a two-center pilot study using CTA as the reference standard.
METHODS
This pilot study was approved by the Institutional Review Boards of two academic centers and informed consent was obtained.
Patient recruitment
For patient recruitment, standard-of-care CTAs from May 2015 to March 2016 that included the ilio-femoral arteries were reviewed. 12 patients (age range 51 - 85, 5 females) who had undergone within the prior 6 months a CTA that demonstrated vascular calcifications of the ilio-femoral arteries were enrolled. Patients were excluded if they had bilateral femoral prostheses or a vascular intervention between the time of the CTA and MR.
CT angiography
The CTA studies were performed using three different scanners: SOMATOM Force, SOMATOM Definition AS and SOMATOM Definition (all Siemens AG, Erlangen, Germany). kVp was selected according to the pre-determined BMI-based institutional protocol. One patient was scanned at 80kVp, 6 at 100 kVp and 5 at 120 kVp. Automatic tube current modulation was applied in all subjects. Mean reference mAs was 204. Reconstruction kernel varied, but in 9 patients iterative reconstruction was applied (I30f/I31f/I40f/Br32d) and 2 had filtered back projection applied (B20f). Six patients had 0.6-mm slice thickness reconstructions, 3 patients had 1-mm slice thickness reconstructions and 3 patients had 2-mm slice thickness reconstructions available.
MR imaging
The prototype PDIP 3D stack-of-stars gradient-echo pulse sequence was performed at one institution using a 1.5 Tesla MAGNETOM Aera and at the second institution using a 3 Tesla MAGNETOM Verio (Siemens Healthcare, Erlangen, Germany). Images were acquired in an oblique coronal plane parallel to the vessels. Scan time was approximately 7 to 8 minutes. Chemical shift artifact at fat/water interfaces was minimized by the combination of a radial k-space trajectory for in-plane spatial encoding and an in-phase echo time. The in-plane radial k-space trajectory also helped to minimize motion and flow-related artifacts (8). As in prior work (6), a flip angle close to the Ernst angle of blood and muscle was selected to produce a proton density-weighted image so that all tissues except calcifications (which appear dark due to the combination of low mobile proton density and very short T2*) will have similar signal intensities. Pulse sequence parameters for the PDIP protocols at 1.5 Tesla and 3 Tesla are summarized in Table 1. Quiescent-interval slice-selective (QISS) MRA (9) of the ilio-femoral vessels was also acquired in all subjects. The QISS MRA was processed using a full-thickness maximum intensity projection, whereas the PDIP stack-of-stars images were generally processed using a minimum intensity projection and slab thickness of 12 to 24 mm. Gray-scale inversion of the minimum intensity projections rendered the vascular calcifications as bright structures to facilitate comparisons with CTA.
Table 1.
PDIP 3D stack-of-stars gradient-echo imaging parameters for 1.5 Tesla and 3 Tesla.
| Magnetic field strength | 1.5 Tesla | 3 Tesla |
| Scan time (min) | 8.2 | 7.4 |
| Reconstructed / acquired slice thickness (mm) | 1.0 / 1.3 | 0.5 / 1.0 |
| Slice oversampling (%) | 25 | 25 |
| Reconstructed / acquired slices per slab | 128/98 | 128/64 |
| Partial Fourier (slice) | 7/8 | 7/8 |
| Signal averages | 1 | 2 |
| TR (ms) | 7.61 | 4.82 |
| TE (ms) | 4.77 | 2.46 |
| Flip angle (degrees) | 3.5 | 2.5 |
| Fat suppression | none | none |
| Radial views | 600 | 660 |
| Matrix | 384 | 416 |
| Field of view (mm) | 416 | 416 |
| In-plane spatial resolution (mm) | 1.08 | 1.00 |
| Bandwidth (Hz/pixel) | 300 | 460 |
In one subject imaged at 3 Tesla, an additional stack-of-stars sequence was acquired using a partially out-of-phase TE of 1.63 ms, sampling bandwidth of 800 Hz/pixel, and otherwise similar sequence parameters to the in-phase sequence. In another subject imaged at 3 Tesla, PDIP stack-of-stars was compared with Cartesian 3D gradient-echo using similar sequence parameters and in-phase echo time, as well as with a prototype PETRA sequence using TR/TE/flip angle = 4.82 ms/0.07 ms/2.5 degrees, acquisition matrix = 416, field of view = 416 mm, 80000 views, scan time 7.1 minutes.
Quantitative Image Analysis
Calcification volumes were quantified for two segments of the femoral artery: (1) from the femoral artery bifurcation to 5-cm above (segment 1), and (2) to 5-cm below (segment 2). The analysis used in-house software based on Image J (National Institutes of Health, Bethesda, USA). A script was written to segment a volume with a diameter of 15-mm around the center of the arterial lumen, identified from seed points placed manually in the ilio-femoral region on the CTA or stack-of-stars MR. The script processed the images to volumetrically segment the calcifications based on Hounsfield units for CT and signal intensity for MR. Bicubic interpolation was used to scale all MR and CT data to 0.5 mm isotropic resolution before measurement of calcification volume. Due to the need to exclude the contrast-enhanced lumen, only CTA voxels with Hounsfield units ≥530 were classified as calcifications (10). On the MR images, voxels having signal intensities less than three standard deviations below the mean were classified as calcifications. Correlation between volume of vascular calcification shown by PDIP stack-of-stars MR and CTA was assessed by linear regression.
Qualitative Image Analysis
A cardiovascular radiology fellow with more than 5 years of experience in vascular imaging qualitatively reviewed source images and multi-planar reformats for both CT and MR, which were reviewed together. Image quality was scored on a 5-point Likert scale as: 1 - very poor, very low degree of confidence to detect calcifications; 2 - poor; 3 - fair; 4 - good; 5 - excellent, very high degree of confidence to detect calcifications. Discrepancies in the size, shape, or location of the calcifications were noted.
RESULTS
Of the 12 subjects, 4 were imaged at 1.5 Tesla and 8 at 3 Tesla. Vessel segments that were ipsilateral to a hip prosthesis or contained stents were excluded from evaluation. This left a total of 44 arterial segments available for analysis. Standard-of-care CTA was performed for evaluation of peripheral vascular disease (n=7), pre-procedural planning for transcatheter aortic valve replacement (TAVR) (n=3) and aorto-iliac aneurysm follow up (n=2).
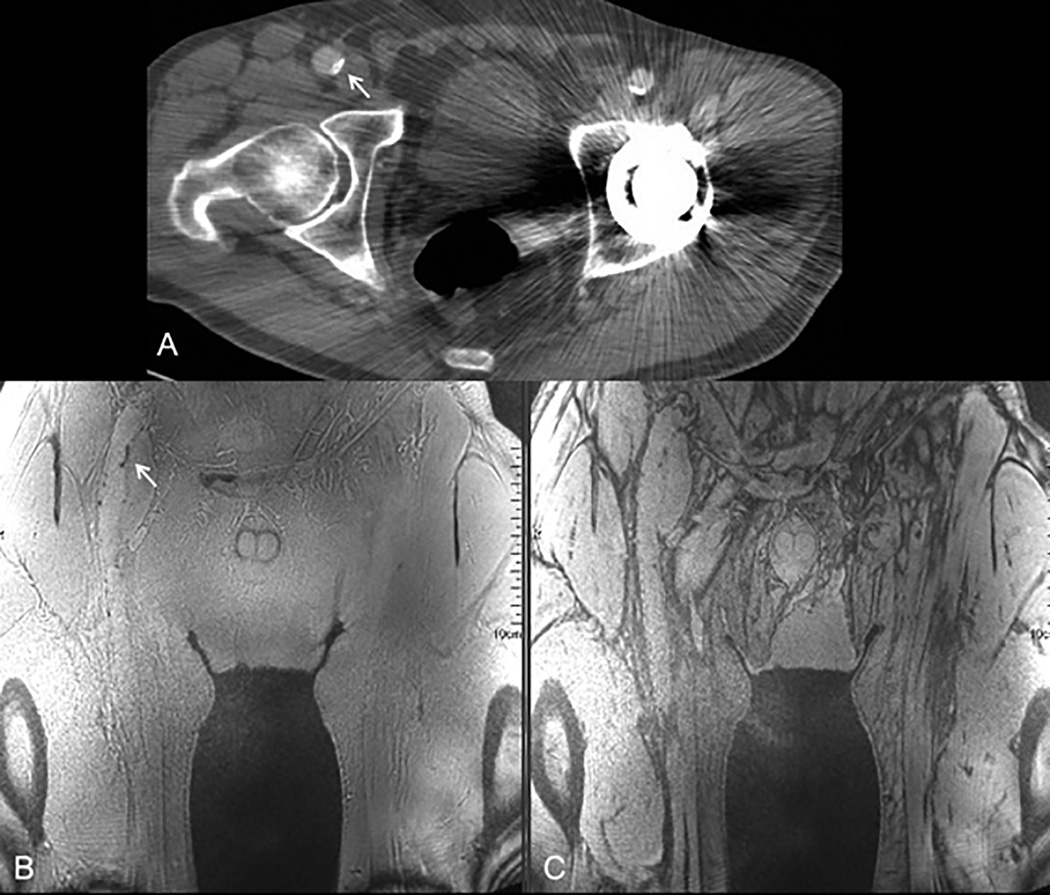
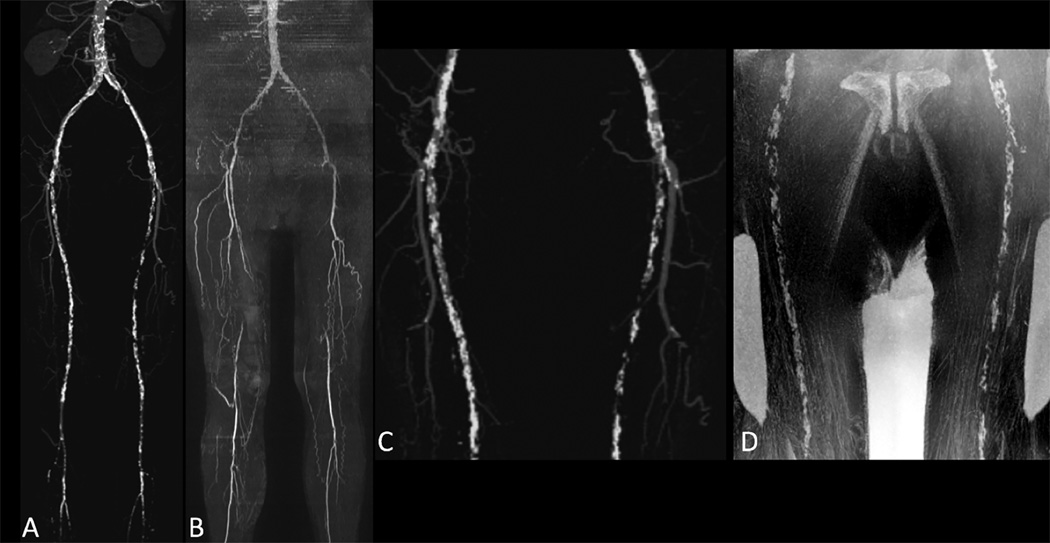
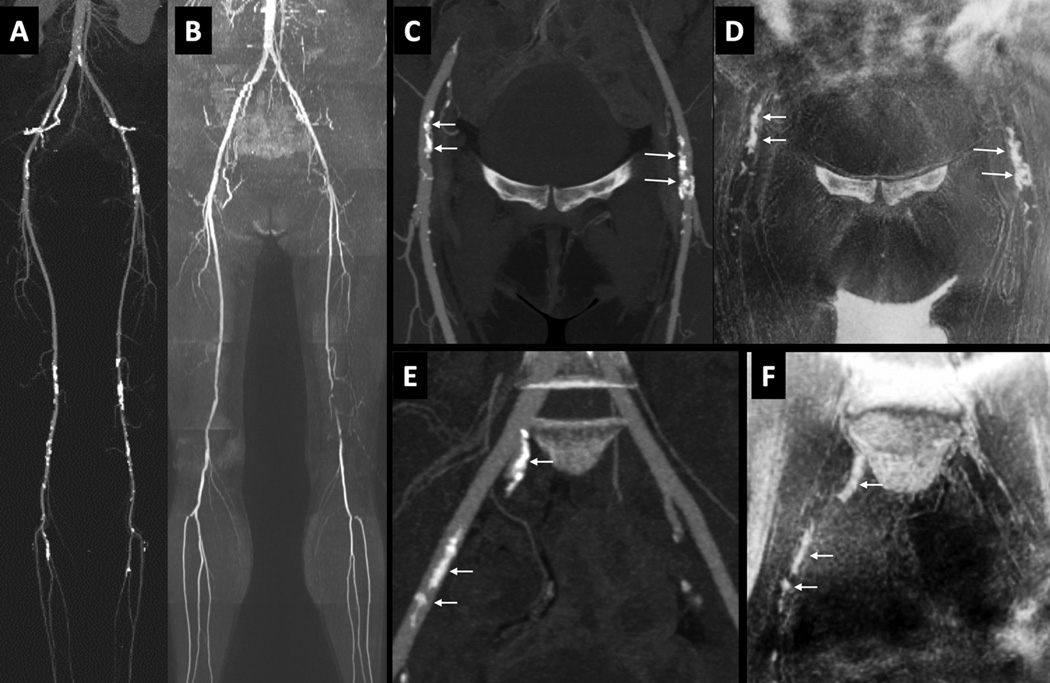
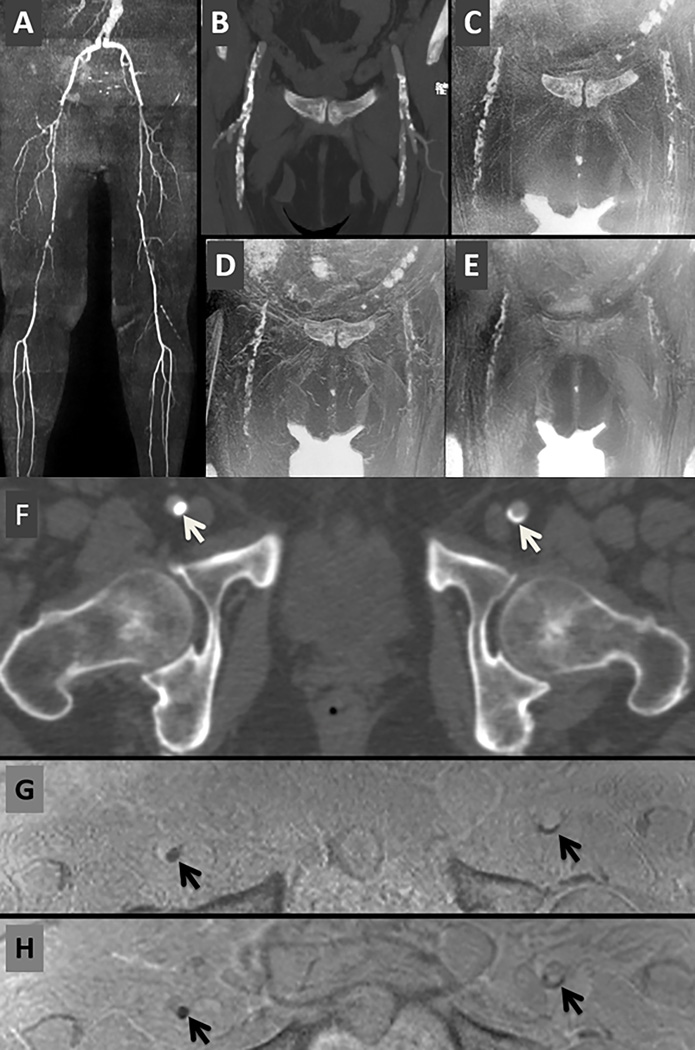
Peripheral vascular calcifications were visualized in all individuals utilizing the PDIP stack-of-stars sequence. The use of an in-phase TE was found to be essential for creating a uniform background signal without dark band artifacts at fat/water interfaces, which improved confidence in detecting dark vascular calcifications (Figure 1). Qualitatively, there was good-to-excellent confidence to detect vascular calcifications by MRI with a mean score of 4.5 (range 3–5). The location, size and shape of the calcifications were similar to CTA (Figure 2 and Figure 3). Blooming artifact was observed in PDIP stack-of-stars around surgical clips and vascular occluders, but was negligible for vascular calcifications (Figure 4). In the one subject in whom stack-of-stars, Cartesian 3D gradient-echo and PETRA were all acquired, the best image quality was obtained with stack-of-stars (Figure 5). A minor drawback of stack-of-stars was radial streak artifact radiating from air-containing bowel loops in the pelvis, which was not observed with the Cartesian 3D technique. However, the Cartesian images showed less uniform arterial signal and dark bands at fat/water interfaces. With PETRA, dark band artifacts were minimized as were susceptibility artifacts from air-containing bowel loops in the pelvis. However, the vascular calcifications appeared smaller than with the other two techniques and punctate calcifications were less conspicuous.
Figure 1.
Importance of using an in-phase TE with PDIP stack-of-stars. (A) Source image from CTA in a 65-year old male with PAD shows a small focus of calcification in the wall of the right common femoral artery (arrow) and streak artifacts from a left hip prosthesis. (B) In-phase stack-of-stars image acquired with TE of 2.46 ms at 3 Tesla shows uniform background signal without dark band artifacts at fat/water interfaces. The small vascular calcification (arrow) is easily detected. (C) Out-of-phase stack-of-stars image acquired with TE of 1.63 ms shows extensive dark band artifacts, undermining confidence in identifying vascular calcifications.
Figure 2.
76-year old male with history of smoking and hyperlipidemia. Maximum intensity projections from CTA (A) and QISS MRA acquired at 3 Tesla (B) show bilateral superficial femoral artery occlusions. There is excellent correlation of vascular calcifications as shown on maximum intensity projection from CTA (C) and minimum intensity projection (b/w inverted) from PDIP stack-of-stars (D).
Figure 3.
51-year old female with disabling claudication involving the left lower extremity. (A) CTA. (B) QISS MRA, showing multi-focal atherosclerotic disease including a segmental occlusion of the distal left superficial femoral artery. (C) Maximum intensity projection from CTA focused to the ilio-femoral vessels. (D) Corresponding minimum intensity projection (b/w inverted) from PDIP stack-of-stars. (E) Maximum intensity projection from CTA focused to the pelvic vessels. [Note that the pelvic arteries were not included in the formal image analysis.] (F) Corresponding minimum intensity projection (b/w inverted) from PDIP stack-of-stars. There is excellent correspondence in the appearance of the vascular calcifications (arrows) in both regions. Bright signal in the corners of images (D) and (F) represent air-filled bowel loops.
Figure 4.
76-year old male. Minimum intensity projection (b/w inverted) of PDIP stack-of-stars acquired at 1.5 Tesla (left) and maximum intensity projection of CTA (right). Note the excellent correlation between PDIP stack-of-stars and CTA for the calcifications involving the ilio-femoral arteries bilaterally. A surgical clip (arrow) appears much larger in the MRI than CTA due to blooming artifact, which is not observed with vascular calcifications.
Figure 5.
71-year old female with multi-focal PAD. (A) QISS MRA (full-thickness maximum intensity projection). (B) CTA (24-mm thick maximum intensity projection). (C) Stack-of-stars. (D) Cartesian 3D. (E) PETRA. [C, D, and E show b/w inverted 24-mm thick minimum intensity projections,] (F) CTA axial image. (G) Axial reformat from stack-of-stars. (H) Axial reformat from Cartesian 3D shows artifactual thin dark bands at fat/water interfaces that are absent with stack-of-stars. Compared with the other two techniques, the vascular calcifications are least conspicuous with PETRA. [Arrows = vascular calcifications.]
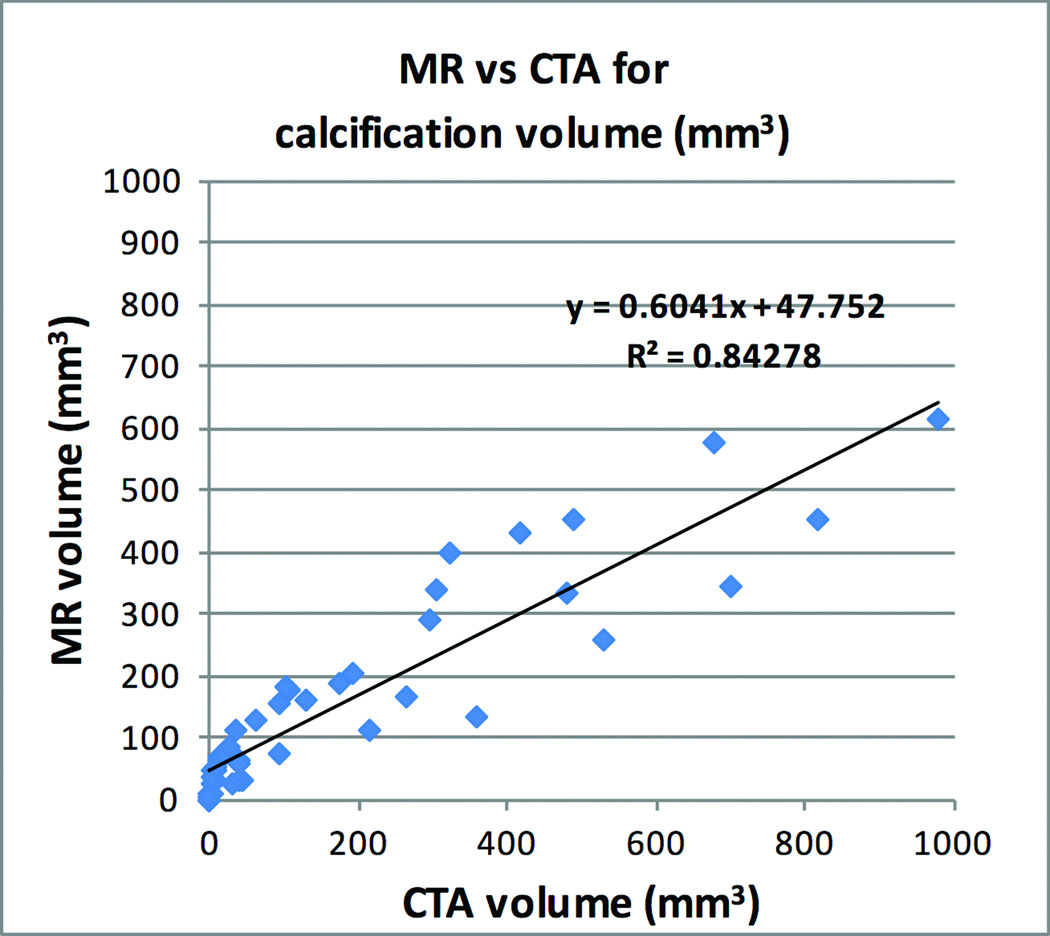
There was excellent correlation (r2 = 0.84, P<0.0001) between PDIP stack-of-stars MR and CT-based measures of calcification volume (Figure 6). The average volume of the vascular calcifications was 184 mm3 (range 0 – 978 mm3) by CTA and 159 mm3 (range 0 – 612 mm3) by MR.
Figure 6.
Linear regression demonstrating excellent correlation between volume of calcified plaque for PDIP stack-of-stars MR and CTA.
DISCUSSION
We found that a high-resolution PDIP 3D stack-of-stars gradient-echo pulse sequence faithfully depicted vascular calcifications involving the ilio-femoral arteries over a wide range of lesion sizes using CTA as the reference standard. There was excellent correlation between MR and CT-determined calcification volumes. Image quality was sufficient with the PDIP stack-of-stars technique that the analysis of lesion volumes could be automated, in contrast to our experience with previously described MR approaches.
The stack-of-stars 3D k-space trajectory, which applies Cartesian encoding for the through-plane direction along with radial encoding for the in-plane direction, has long been recognized to reduce motion sensitivity compared with a fully Cartesian 3D trajectory (11). In addition to reduced sensitivity to motion artifacts, a major impetus for using a stack-of-stars pulse sequence was the suppression of chemical shift-related dark bands at fat/water interfaces. These dark bands can mimic or obscure dark calcifications on minimum intensity projection images. Unlike a fully Cartesian-based pulse sequence, fat/water interfaces appear blurred with a radial acquisition; no dark bands are present at the fat/water interfaces so long as an in-phase echo time is selected. The blurring is minimized by the acquisition of a high number of radial spokes.
As with prior work (6), we used a low flip angle RF excitation in order to minimize signal intensity differences among tissues relating to variations in T1 relaxation times. The resultant proton density-weighted images provided a uniform background, which helped to improve the conspicuity of dark calcifications and confidence in their detection. Unlike the case with PETRA, ligaments and tendons appear dark using the stack-of-stars technique. Air-filled bowel loops will also appear dark. Consequently, it is essential to cross-reference the source stack-of-stars images with a vascular roadmap, such as QISS or contrast-enhanced MRA, and not to rely solely on minimum intensity projection images. In principle, the PDIP stack-of-stars technique should remain effective after contrast administration for contrast-enhanced MRA, but we did not test this hypothesis in our study.
Surgical clips and vascular occluders appeared dark in PDIP stack-of-stars images, as did vascular calcifications. Unlike vascular calcifications, they appeared substantially larger with MR than CT due to paramagnetic-related blooming artifact. Using the PDIP stack-of-stars technique, diamagnetic-related blooming artifact from vascular calcifications was not observed. In addition to observing blooming artifact to differentiate clips from vascular calcifications, it can be helpful to correlate the location of signal voids in the PDIP stack-of-stars images with the vessel location as depicted by QISS MRA. It has also been shown that use of quantitative magnetic susceptibility imaging techniques can differentiate clips from calcifications, although such techniques can be challenging to implement in the body (6).
The scan time for the PDIP stack-of-stars sequence in this study was approximately 7 to 8 minutes at both 1.5 Tesla and 3 Tesla. However, the 1.5 Tesla images were acquired with a voxel that was 52% larger than at 3 Tesla. If the 3 Tesla scans were acquired at the slightly lower spatial resolution used at 1.5 Tesla, then one could reduce scan time to approximately 2.5 minutes while preserving the signal-to-noise ratio of the lengthier, higher-resolution scans used in our study. Further evaluation is needed to determine the optimal level of spatial resolution needed to detect clinically significant vascular calcifications.
A limitation of this study was the small number of subjects. Nonetheless, the number of vascular segments evaluated was sufficient to obtain a highly significant correlation of calcification volumes between MR and CT. Also, we did not attempt to differentiate between medial calcification and atherosclerotic plaque calcification, which remains challenging by any imaging modality. Finally, we did not perform a systematic comparison of the PDIP stack-of-stars approach with previously described Cartesian 3D gradient-echo and PETRA techniques.
In conclusion, we have demonstrated in this pilot study that a PDIP 3D stack-of-stars gradient-echo pulse sequence using ≈1-mm3 isotropic spatial resolution provides excellent image quality and can accurately depict the location and volume of ilio-femoral vascular calcifications. Further studies will be needed to determine the clinical utility of the technique.
Acknowledgments
Study was funded in part by R21 NIH grant HL 126015. We would like to thank Dr. Alto Stemmer (Siemens Healthcare GmbH, Erlangen Germany) for providing the prototype stack-of-stars pulse sequence.
REFERENCES
- 1.Amann K. Media calcification and intima calcification are distinct entities in chronic kidney disease. Clin J Am Soc Nephrol. 2008;3:1599–1605. doi: 10.2215/CJN.02120508. [DOI] [PubMed] [Google Scholar]
- 2.Youssef G, Guo M, McClelland RL, Shavelle DM, Nasir K, Rivera J, Carr JJ, Wong ND, Budoff MJ. Risk Factors for the Development and Progression of Thoracic Aorta Calcification: The Multi-Ethnic Study of Atherosclerosis. Acad Radiol. 2015;22:1536–1545. doi: 10.1016/j.acra.2015.08.017. [DOI] [PMC free article] [PubMed] [Google Scholar]
- 3.Toggweiler S, Leipsic J, Binder RK, Freeman M, Barbanti M, Heijmen RH, Wood DA, Webb JG. Management of vascular access in transcatheter aortic valve replacement: part 2: Vascular complications. JACC Cardiovasc Interv. 2013;6:767–776. doi: 10.1016/j.jcin.2013.05.004. [DOI] [PubMed] [Google Scholar]
- 4.Vigili de Kreutzenberg S, Fadini GP, Guzzinati S, Mazzucato M, Volpi A, Coracina A, Avogaro A. Carotid plaque calcification predicts future cardiovascular events in type 2 diabetes. Diabetes Care. 2015;38:1937–1944. doi: 10.2337/dc15-0327. [DOI] [PubMed] [Google Scholar]
- 5.Geronemus AR, Pena CS. Peripheral Vascular Disease. Semin Intervent Radiol. 2009;26:303–314. doi: 10.1055/s-0029-1242203. [DOI] [PMC free article] [PubMed] [Google Scholar]
- 6.Edelman RR, Flanagan O, Grodzki D, Giri S, Gupta N, Koktzoglou I. Projection MR imaging of peripheral arterial calcifications. Magn Reson Med. 2015;73:1939–1945. doi: 10.1002/mrm.25320. [DOI] [PubMed] [Google Scholar]
- 7.Grodzki DM, Jakob PM, Heismann B. Ultrashort echo time imaging using pointwise encoding time reduction with radial acquisition (PETRA) Magn Reson Med. 2012;67:510–518. doi: 10.1002/mrm.23017. [DOI] [PubMed] [Google Scholar]
- 8.Glover GH, Pauly JM. Projection reconstruction techniques for reduction of motion effects in MRI. Magn Reson Med. 1992;28:275–289. doi: 10.1002/mrm.1910280209. [DOI] [PubMed] [Google Scholar]
- 9.Edelman RR, Sheehan JJ, Dunkle E, Schindler N, Carr J, Koktzoglou I. Quiescent-interval single-shot unenhanced magnetic resonance angiography of peripheral vascular disease: technical considerations and clinical feasibility. Magn Reson Med. 2010;63:951–958. doi: 10.1002/mrm.22287. [DOI] [PMC free article] [PubMed] [Google Scholar]
- 10.Bischoff B, Kantert C, Meyer T, Hadamitzky M, Martinoff S, Schömig A, Hausleiter J. Cardiovascular risk assessment based on the quantification of coronary calcium in contrast-enhanced coronary computed tomography angiography. Eur Heart J Cardiovasc Imaging. 2012;13:468–475. doi: 10.1093/ejechocard/jer261. [DOI] [PubMed] [Google Scholar]
- 11.Spuentrup E, Katoh M, Buecker A, Manning WJ, Schaeffter T, Nguyen TH, Kühl HP, Stuber M, Botnar RM, Günther RW. Free-breathing 3D steady-state free precession coronary MR angiography with radial k-space sampling: comparison with cartesian k-space sampling and cartesian gradient-echo coronary MR angiography--pilot study. Radiology. 2004;231:581–586. doi: 10.1148/radiol.2312030451. [DOI] [PubMed] [Google Scholar]


