Abstract
(β-)Arrestins are important regulators of G-protein-coupled receptors (GPCRs)1–3. They bind to active, phosphorylated GPCRs and thereby shut off ‘classical’ signalling to G proteins3,4, trigger internalization of GPCRs via interaction with the clathrin machinery5–7 and mediate signalling via ‘non-classical’ pathways1,2. In addition to two visual arrestins that bind to rod and cone photoreceptors (termed arrestin1 and arrestin4), there are only two (non-visual) β-arrestin proteins (β-arrestin1 and β-arrestin2, also termed arrestin2 and arrestin3), which regulate hundreds of different (non-visual) GPCRs. Binding of these proteins to GPCRs usually requires the active form of the receptors plus their phosphorylation by G-protein-coupled receptor kinases (GRKs)1,3,4. The binding of receptors or their carboxy terminus as well as certain truncations induce active conformations of (β-)arrestins that have recently been solved by X-ray crystallography8–10. Here we investigate both the interaction of β-arrestin with GPCRs, and the β-arrestin conformational changes in real time and in living human cells, using a series of fluorescence resonance energy transfer (FRET)-based β-arrestin2 biosensors. We observe receptor-specific patterns of conformational changes in β-arrestin2 that occur rapidly after the receptor–β-arrestin2 interaction. After agonist removal, these changes persist for longer than the direct receptor interaction. Our data indicate a rapid, receptor-type-specific, two-step binding and activation process between GPCRs and β-arrestins. They further indicate that β-arrestins remain active after dissociation from receptors, allowing them to remain at the cell surface and presumably signal independently. Thus, GPCRs trigger a rapid, receptor-specific activation/deactivation cycle of β-arrestins, which permits their active signalling.
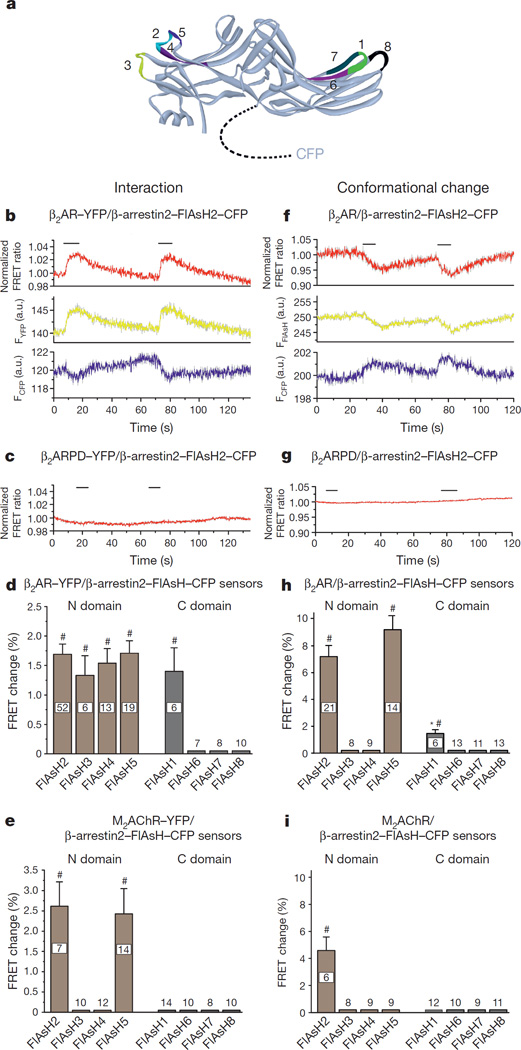
Several lines of evidence suggest that GPCRs induce active conformations of (β-)arrestins, which facilitate interactions with effector proteins11–15. X-ray crystallography of such active conformations revealed movements in the central loops that interact with GPCRs, plus a 20° twisting of the amino- versus carboxy-terminal domain8–10. An intramolecular bioluminescence resonance energy transfer (BRET) sensor for β-arrestin2 activation showed activation over minutes, suggesting that it reports interactions with effectors rather than β-arrestin2 conformational changes16. Therefore, we set out to study the dynamics and the role and potential specificity of GPCRs in β-arrestin activation in living cells by FRET17. We generated eight different FRET-based β-arrestin2 biosensors by attaching an invariant cyan fluorescent protein (CFP) at the C terminus, and inserting a binding motif (CCPGCC) for the fluorescein arsenical hairpin (FlAsH) binder into different positions at the periphery of the N and C domains that were unlikely to be directly involved in receptor–β-arrestin interactions but might report conformational changes18 (Fig. 1a and Extended Data Table 1).
Figure 1. FRET sensors for the β-arrestin2–receptor interaction and receptor-dependent conformational changes in β-arrestin2.
a, FRET-based β-arrestin2 biosensors. Schematic representation of the β-arrestin2–FlAsH constructs used in this study derived from the crystal structure (Protein Data Bank (PDB) code 3P2D). CFP was attached C-terminally, and the FlAsH binding motif (CCPGCC) was inserted in different positions. Positions of the FlAsH binding motif are highlighted in the structure and specified in Extended Data Table 1. The sensors were termed β-arrestin2–FlAsH1–8–CFP (abbreviated: FlAsH1–8). b–i, Monitoring the β-arrestin2–receptor interaction and receptor-dependent conformational changes in β-arrestin2 by FRET. b, c, f, g, Representative traces of isoproterenol-induced changes in CFP (FCFP, cyan) and YFP or FlAsH (FYFP or FFlAsH, yellow) emissions and the corresponding normalized FRET ratio (FYFP or FFlAsH/FCFP) recorded from a single HEK293 cell expressing either YFP-fused β2AR (b) or β2AR (f) and the FlAsH-labelled β-arrestin2–FlAsH2–CFP. Isoproterenol application (100 µM) is indicated. Intermolecular (c) and intramolecular (g) FRET detected upon stimulation of a phosphorylation-deficient β2AR mutant (β2ARPD) in HEK293 cells co-expressing β-arrestin2–FlAsH2–CFP; these experiments were repeated more then ten times with similarly negative results. d, e, h, i, Quantification of agonist-evoked FRET changes. Shown are maximal FRET changes (percentage) for the interaction of β2AR–YFP (d) or M2AChR–YFP (e) and the β-arrestin2–FlAsH–CFP sensors, or by conformational changes detected with the β-arrestin2 sensors after stimulation of β2AR with 100 µM isoproterenol (h) or M2AChR with 100 µM acetylcholine (i). Data represent mean ± s.e.m., for n independent experiments (biological replicates) as indicated. #P < 0.01 (versus no effect); *P < 0.05 (versus FlAsH2 and FlAsH5).
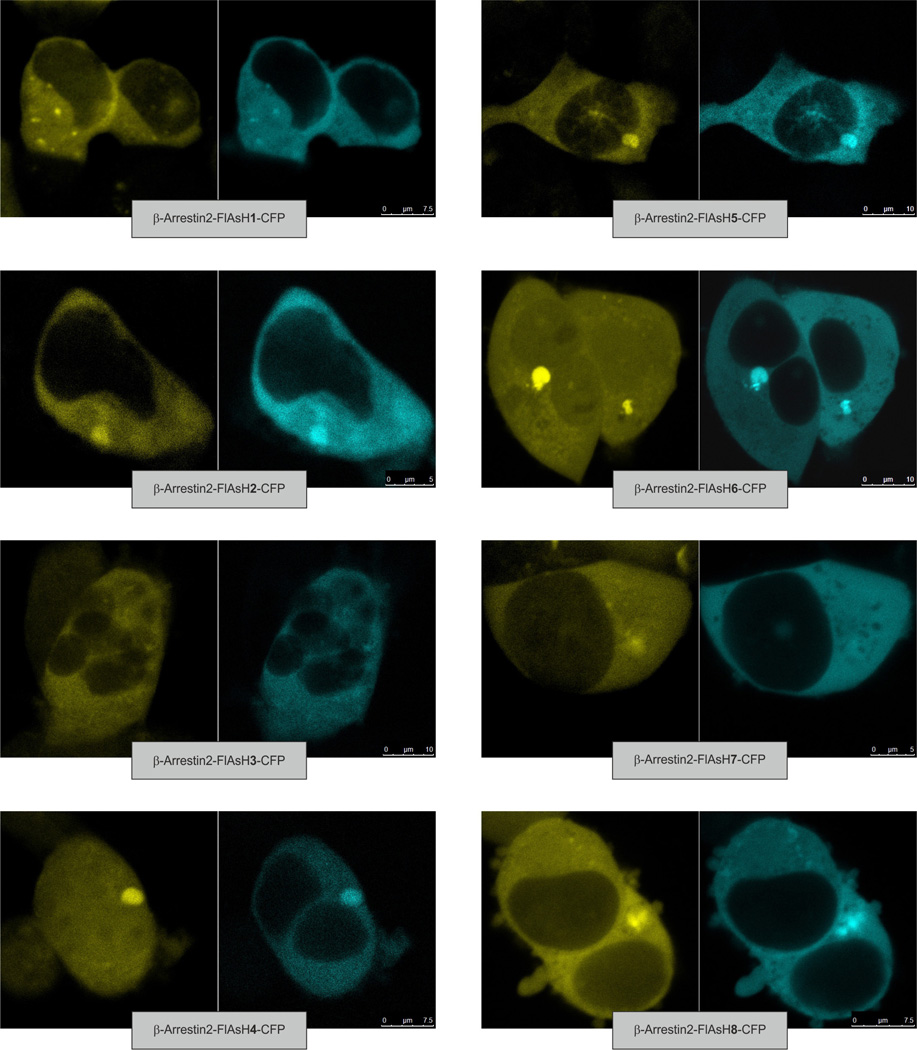
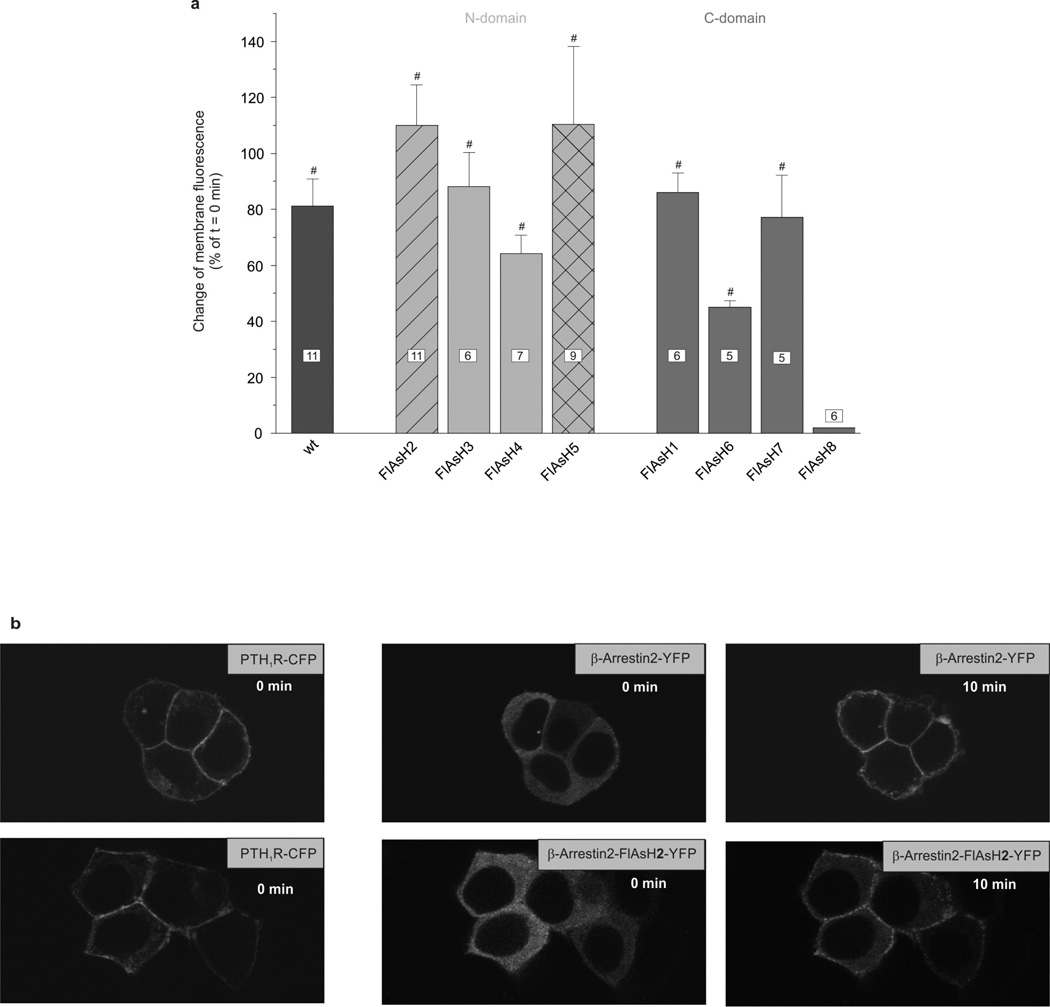
Confocal microscopy of transfected HEK293 cells showed that all β-arrestin2 sensors were expressed in the cytosol and labelled with FlAsH19 (Extended Data Fig. 1). With the exception of β-arrestin2–FlAsH8, all were rapidly recruited to the cell surface after stimulation of co-transfected parathyroid hormone type 1 receptors (PTH1Rs; Extended Data Fig. 2), a receptor known to induce robust β-arrestin2 interactions20.
For kinetic experiments, we used the β2-adrenergic receptor (β2AR), because its agonists have rapid on and off rates21,22. The interaction was monitored by measuring FRET between the C-terminal CFP in the β-arrestin2 sensors and a C-terminal yellow fluorescent protein (YFP) in the co-transfected β2AR21,23. Stimulation of the β2AR with 100 µM isoproterenol promoted a β-arrestin–receptor interaction and increased FRET between CFP in the β-arrestin2 sensors and β2AR–YFP21,23 (Fig. 1b).
A phosphorylation-deficient β2AR–YFP construct21 failed to trigger such recruitment (Fig. 1c), indicating a high-affinity GRK-dependent β-arrestin–receptor interaction24,25. Requirement for GRK-mediated phosphorylation made the interaction slower for the first than for subsequent stimuli (Fig. 1b), when receptors are already pre-phosphorylated21. Therefore, all further analyses refer to second stimuli, eliminating GRK-dependent phosphorylation as a potential issue.
Since the measurement of this interaction relied on the invariant CFP in all β-arrestin2 sensors, the receptor interactions of the different constructs can be directly compared (Fig. 1d). All β-arrestin2 sensors bearing FlAsH sequences in the N domain showed robust and quantitatively similar interactions with β2AR–YFP, whereas of those with C-domain FlAsH sequences, only the FlAsH1 construct showed a similar interaction. The interaction of the FlAsH6/7 constructs with PTH1R but not β2AR indicates a distinct selectivity for β-arrestin2 between GPCRs. Receptor specificity was further suggested by an analogous M2 muscarinic acetylcholine receptor (M2AChR) construct stimulated with 100 µM acetylcholine (Fig. 1e). Here, only β-arrestin2–FlAsH2 and β-arrestin2–FlAsH5 showed a similar receptor interaction, whereas all other constructs exhibited no detectable interaction.
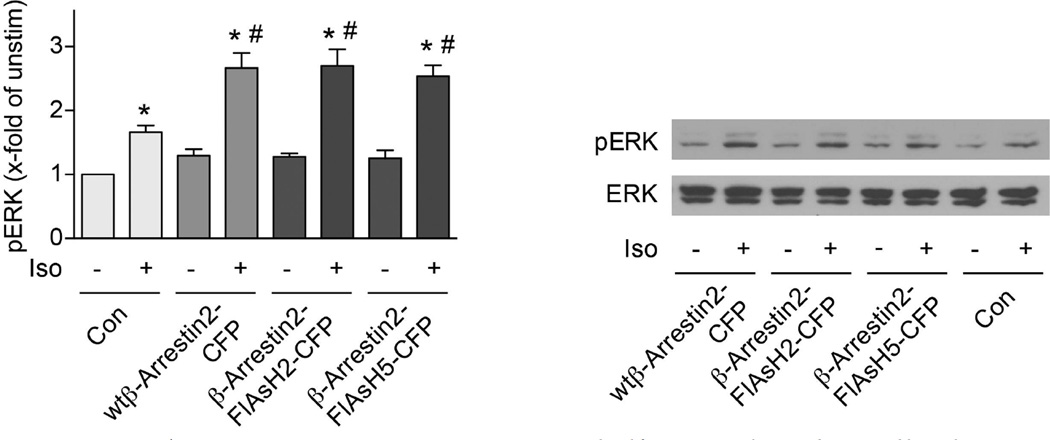
Conformational changes within the β-arrestin2 sensors were investigated via intramolecular FRET between the CFP and FlAsH label (Fig. 1f–i), initially again using β-arrestin2–FlAsH2–CFP and the β2AR. Receptor stimulation caused a reversible reduction of intramolecular FRET in β-arrestin2–FlAsH2–CFP (Fig. 1f), which was, again, absent for the phosphorylation-deficient β2AR construct (Fig. 1g), indicating that agonist- and phosphorylation-dependent high-affinity receptor-binding was required for the conformational change. Only three β-arrestin2 sensors showed conformational changes after β2AR stimulation (Fig. 1h). FlAsH3 and FlAsH4, which showed ligand-dependent receptor interactions (Fig. 1d), revealed no β-arrestin2 conformational changes, and FlAsH1 showed only minor changes (Fig. 1h). This suggests that only distinct subdomains of β-arrestin2 move relative to its C terminus, and that the loop containing positions 2 and 5 (amino acids 154–158) is particularly sensitive. In line with their ability to report receptor-dependent activation, FlAsH2 and FlAsH5 increased isoproterenol-stimulated ERK phosphorylation in transfected HEK293 cells as much as wild-type β-arrestin2–CFP (Extended Data Fig. 3).
In analogous experiments with M2AChR stimulated by 100 µM acetylcholine (Fig. 1i), only β-arrestin2–FlAsH2–CFP showed an agonist-induced signal—that is, neither FlAsH5, which interacted with M2AChR (Fig. 1e), nor FlAsH1, which changed conformation upon β2AR stimulation (Fig. 1h), responded to M2AChR stimulation. Thus, both receptor interactions and conformational changes in β-arrestin2 occur in distinct receptor-specific manners.
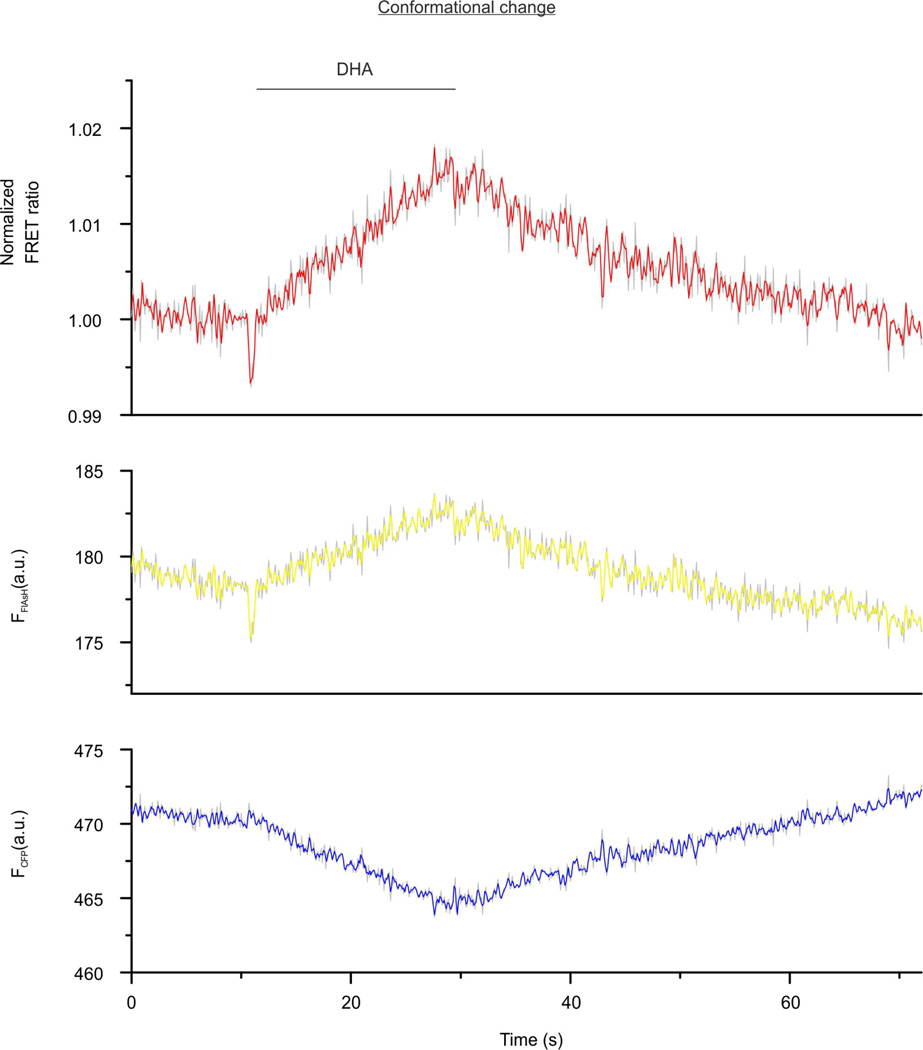
Further evidence for receptor-specificity was illustrated by a FRET increase in β-arrestin2–FlAsH2 triggered by the free fatty acid receptor FFA4R (Extended Data Fig. 4), and by specific β-arrestin-mediated downstream signalling to kinases (Extended Data Fig. 5). In line with their different effects on β-arrestin2–FRET, M2AChR caused significantly higher ERK1/2 activation than β2AR, and FFA4R was the only receptor causing no significant Src-kinase activation.
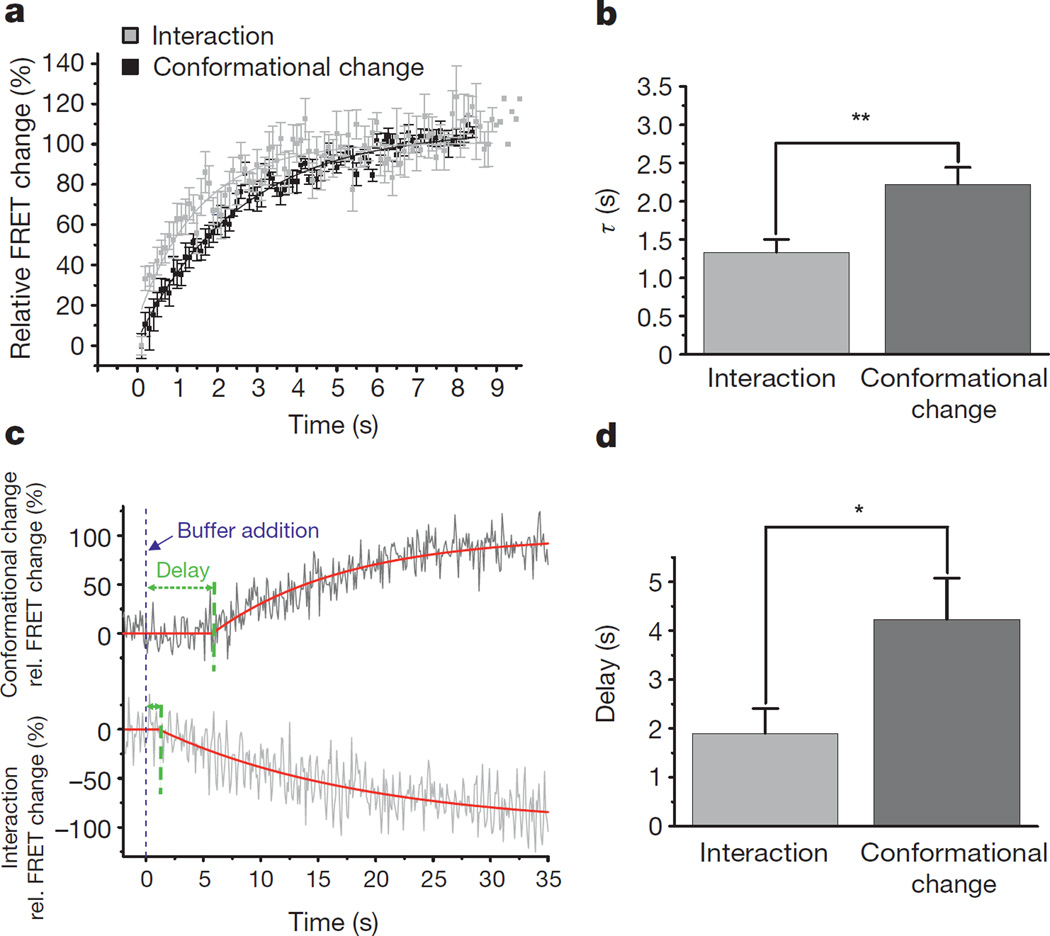
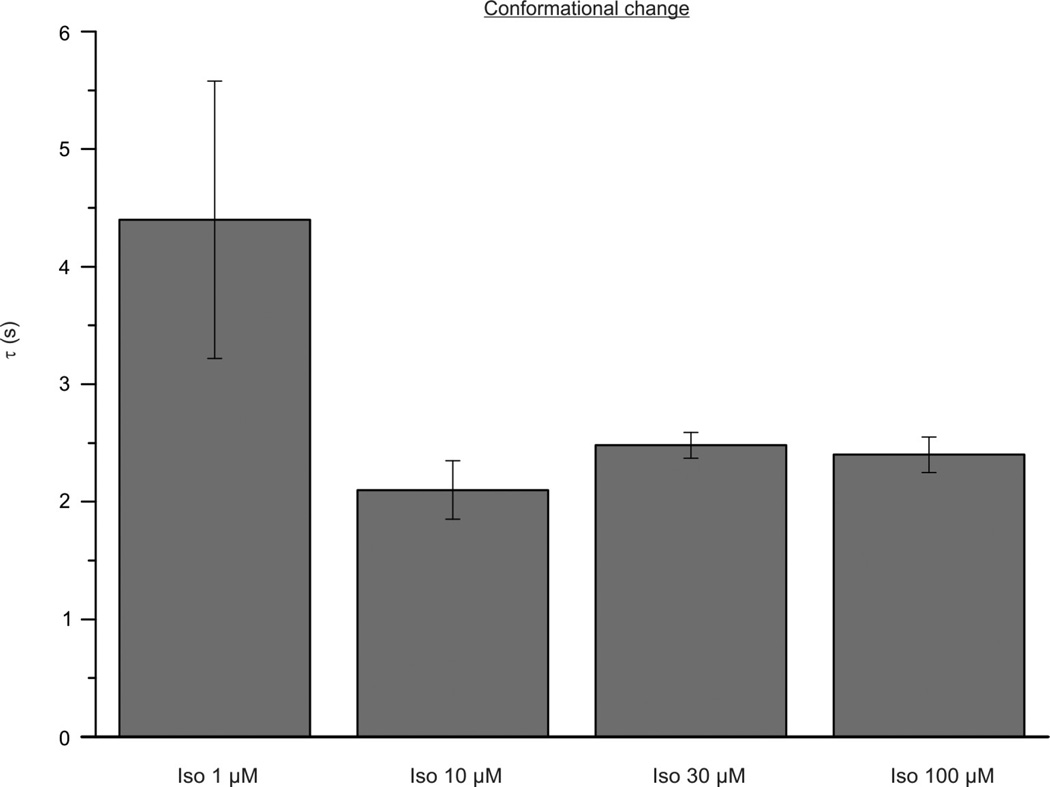
A comparison of the kinetics of the β2AR–β-arrestin2 interaction and of β-arrestin2 conformational changes in β-arrestin2–FlAsH2–CFP illustrates that the interaction step is faster (and thus precedes) the conformational change (Fig. 2a, b). While both processes began without an apparent lag period after agonist addition, the β2AR–β-arrestin2 interaction was clearly faster (rate constant τ = 1.3 ± 0.17 s (mean ± s.e.m.)) than the conformational change (τ = 2.2 ± 0.22 s; P < 0.01). Analysis with various isoproterenol concentrations revealed that these values represent maximal speeds (Extended Data Fig. 6).
Figure 2. Kinetics of the interaction of β-arrestin2 with β2AR and its conformational movements.
a, Kinetics of the agonist (100 µM isoproterenol)-induced interaction of β-arrestin2–FlAsH2–CFP with β2AR (light grey) and its conformational changes (dark grey). Interaction and conformational changes (inverted to facilitate comparison) were quantified by FRET as in Fig. 1. FRET changes were plotted against time and analysed by exponential fitting to yield time constants (τ). Maximal values were set to 100%. Data represent mean ± s.e.m. of n = 17 (interaction) or 23 (conformational change) independent experiments (biological replicates). b, Bar graph of the time constants for the β2AR-agonist-induced interaction (τ = 1.3 ± 0.17 s) and the conformational changes detected with β-arrestin2–FlAsH2–CFP (τ = 2.2 ± 0.22 s). Data represent mean ± s.e.m. of n = 17 (interaction) or 23 (conformational change) independent experiments (biological replicates). **P < 0.01 (Mann–Whitney U test). c, Kinetics of FRET changes after agonist removal. FRET signals were recorded after termination of exposure to the agonist (100 µM isoproterenol; switch to buffer indicated by blue line). Traces are from a representative experiment showing distinct delays in the intermolecular FRET signal indicating β-arrestin2–receptor dissociation, and the intramolecular FRET signal indicating reversal of the active β-arrestin conformation. The rate constants of the two processes were not different (τ = 22 ± 4.2 s versus 23 ± 2.1 s). d, Bar graph of the delays for the agonist-induced β-arrestin–receptor dissociation (1.9 ± 0.51 s), and the reversal of the β-arrestin2 conformational changes from experiments as shown in c (τ = 4.2 ± 0.85 s). Data represent mean ± s.e.m. of n = 12 independent experiments (biological replicates). *P < 0.05 (Mann–Whitney U test).
When the superfusion system (which has a delay time of <10 ms) was switched from isoproterenol (100 µM) to buffer alone, both the β2AR–β-arrestin2 interaction and the β-arrestin2 conformational changes reverted (Fig. 2c), albeit with significantly different delays. This delay was 1.9 ± 0.51 s for the interaction, but 4.2 ± 0.85 s for the conformational change (P < 0.05; Fig. 2d). This difference indicates that β-arrestin2 remains in an active conformation after dissociation from the receptor. If β-arrestins continue to signal to effectors after their dissociation from receptors, this would allow signal amplification analogous to the well-established signal amplification occurring in G-protein-mediated signalling26.
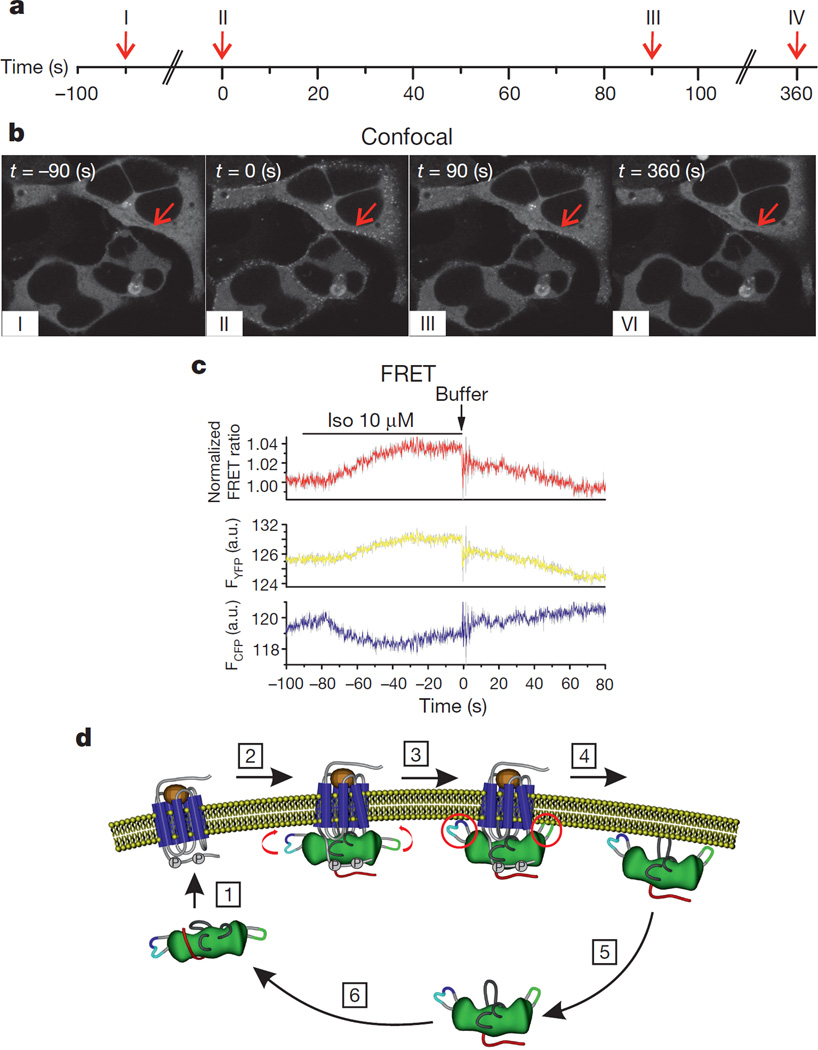
To assess whether these different delays might indeed be functionally relevant, we compared β2AR-induced translocation of β-arrestin2–YFP by confocal microscopy with the β2AR–β-arrestin2 interaction monitored under identical conditions by FRET (Fig. 3a–c). Because technical reasons prevented the use of the rapid perfusion system, these experiments were performed with direct application of isoproterenol to coverslips and subsequent washout with a peristaltic pump; thus, the two sets of experiments can be compared with one other, but not with the preceding experiments. After agonist washout, the translocation of β-arrestin2–YFP to the cell membrane lasted much longer than the direct β2AR–β-arrestin2 interaction (FRET). The latter was completely reversed 90 s after buffer addition (Fig. 3c), while the former clearly persisted at this time and took four times as long to reverse (Fig. 3b). This would be consistent with the hypothesis of an active, cell-surface-localized state of β-arrestin2–YFP lasting longer than the direct association with β2AR. Whether the cell surface retention is due to binding to lipids or to additional proteins, for example, clathrin5,7, or is related to a biochemical modification remains to be determined.
Figure 3. Kinetics of β-arrestin2 translocation between cytosol and cell membrane after β2AR stimulation.
a, Timeline of the experimental set up. HEK293 cells co-expressing β-arrestin2–YFP and β2AR were stimulated with isoproterenol (Iso 10 µM) added to the coverslip, followed by washout with a peristaltic pump (flow rate 1.4 ml min−1). Translocation of β-arrestin2–YFP to the cell membrane and subsequent dissociation upon washout were determined by confocal microscopy. Images were taken every 15 s. The experiment is representative of six independent experiments. b, Confocal images before and after ligand addition. I, β-Arrestin2–YFP was diffusely cytosolic before agonist stimulation (t = −90 s). II, Maximal β-arrestin2 translocation to the cell membrane was observed 90 s after isoproterenol addition (t = 0 s; begin of washout). III, β-Arrestin2 movement back to the cytosol occurs after washout, but cell-surface localization is still clearly visible at 90 s after the beginning of washout (t = 90 s). IV, Translocation back to the cytosol is complete after 360 s of washout (t = 360 s). The images are representative of 4 independent experiments (biological replicates). c, Kinetics of the β-arrestin2–β2AR interaction after β2AR stimulation and ligand washout measured by FRET. HEK293 cells were transfected with β2AR–YFP and β-arrestin2–CFP. Isoproterenol (10 µM) was added for 90 s and then washed out as above. Changes in CFP (FCFP, cyan) and YFP (FYFP, yellow) emissions and the corresponding normalized FRET ratio (FYFP/FCFP, red) were recorded from a single HEK293 cell. Note the artefact caused by switching on the pump for washout (t = 0 s). The traces are representative of 7 independent experiments (biological replicates). d, Model of an activation/deactivation and translocation cycle of β-arrestin2. After binding to an active phosphorylated receptor (1), β-arrestin2 adopts an activated conformation (2) that might facilitate fitting to the activated, phosphorylated receptor surface. Parts of C and/or N domain (labelled with FlAsH in our studies) undergo further movements (3) to bring β-arrestin2 into a receptor-specific activated conformation. After agonist removal, β-arrestin2 dissociates from the receptor (4) and remains active for some time (5) before its active state is reversed (6). The major rearrangements in the loops associated with β-arrestin2 activation are schematically illustrated. Structural elements of β-arrestin2 are coloured as follows in each step: N and C domains, green; C-tail, red; FlAsH2, cyan; FlAsH5, blue; FlAsH1, light green; finger, middle and gate loops, light grey.
Our data illustrate that GPCRs induce a complex, multi-step activation/deactivation cycle for β-arrestins that rapidly follows the well-known G-protein cycle. Provided sufficient GRK is present21, the rapid interaction between β-arrestins and receptors terminates G-protein activation long before downstream second messenger levels reach their new, receptor-triggered equilibrium27.
Second, the distinct kinetics of receptor interaction versus conformational change (activation) of β-arrestin2 are consistent with the two-step activation model, which requires receptor phosphorylation and binding of the receptors’ C terminus for β-arrestin activation by GPCRs12,15. The time course of these steps reveals that GPCRs are as much β-arrestin-coupled receptors as they are G-protein-coupled receptors. Comparison of our β-arrestin2 sensors indicates that both steps occur in a receptor-specific manner. Thus, different activated forms of β-arrestins might exist that would allow signalling bias. The very recent determination of the X-ray structure of a rhodopsin–arrestin fusion protein10 is compatible with such a stepwise activation model as predicted from earlier structures of pre-activated (β-) arrestins8,9. The stepwise activation would also allow active (β-) arrestins to dissociate from a GPCR.
Third, the persistence of active β-arrestin2 after dissociation from receptors has several important implications. It would allow signal amplification at this step, because a receptor becomes available for the activation of a subsequent β-arrestin while the first remains in an active state. It would allow β-arrestin coupling to its effectors at a site distinct from the cellular localization of the receptor, thus permitting distant β-arrestin-mediated signalling and thus making this process more versatile than previously thought.
While this work was in progress, we became aware of a complementary approach demonstrating β-arrestin conformational changes with BRET sensors and confirming the relevance of different active states of β-arrestin2 for downstream kinase signalling28.
In summary, β-arrestins may orchestrate GPCR signalling by temporally and spatially segregating different, receptor-specific signalling ‘waves’29,30, each lasting for a few seconds: first, G-protein-mediated signals from the cell surface, second, β-arrestin-mediated signals in its receptor-bound states, third, β-arrestin-mediated signals after dissociation from receptors, and finally signals from internal sites after β-arrestin-mediated receptor internalization. Thus, the interactions of GPCRs with β-arrestins are highly versatile, rapid and dynamic, and trigger an array of diverse, receptor-specific signals in space and in time.
METHODS
Reagents
Chemicals were purchased from the following sources: acetylcholine and isoproterenol from Sigma-Aldrich; penicillin (100 U ml−1), streptomycin (100 µg ml−1), l-glutamine and G-418 from Invitrogen; Effectene transfection reagent from Qiagen. PCR primers were synthesized by MWG-Biotech, and sequencing reactions were done by Eurofins Medigenomix. DHA (all-cis-docosa-4,7,10,13,16,19-hexaenoic acid; 22:6(n-3)) was purchased from Sigma.
Molecular biology
FRET-based biosensors for β-arrestin2 were designed such that they would be able to interact with receptors and at the same time pick up conformational changes occurring during β-arrestin2 activation, based on work by Gurevich and co-workers12,13,31,32. To achieve this, cDNA encoding the six-amino-acid FlAsH motif CCPGCC was inserted in different positions in the N or C domain of bovine β-arrestin2 cDNA, resulting in constructs β-arrestin2–FlAsH1–FlAsH8 (Fig. 1a and Extended Data Table 1). The enhanced variants of CFP or YFP, respectively (BD Bioscience Clontech) were fused to the C termini of the human M2AChR, β2AR or the β-arrestin2–FlAsH sensors by standard PCR extension overlap technique33. In each case, the C-terminal stop codon of the receptor and the initial codon for methionine of the fluorescent protein were deleted. All resulting constructs were cloned into pcDNA3 (Invitrogen Life Technologies) and confirmed by sequencing.
Cell culture
HEK293 cells were cultured in DMEM supplemented with 4.5 g l−1 glucose, 10% fetal calf serum (Biochrom AG), 100 U ml−1 penicillin G, and 100 µg ml−1 streptomycin sulphate at 37 °C and 7% CO2. Cells were passaged every 2–3 days.
HEK293 cells were routinely tested for mycoplasma contamination using a primer set specific for the highly conserved 16S rRNA coding region in the mycoplasma genome. A mycoplasma-positive sample shows a distinct band at 265–278 base pairs.
Transient expression of β-arrestin2 biosensors in HEK293 cells
For fluorescence measurements, HEK293 cells were seeded on poly-d-lysine-coated coverslips in 6-well-plates 4–6 h before transfection. The cells were transfected using Effectene according to the manufacturer’s instructions. 0.3 µg of each of the following cDNAs were used per well: β2AR or PTH1R and one of the YFP-tagged β-arrestin2–FlAsH sensors (β-arrestin2 translocation); M2AChR–YFP or β2AR–YFP and one of the CFP-tagged β-arrestin2–FlAsH sensors (receptor–β-arrestin2 interaction); M2AChR, FFA4R or β2AR and one of the FlAsH-labelled CFP-tagged β-arrestin2–FlAsH constructs for measuring conformational changes. Cells were analysed 48 h after transfection.
FlAsH labelling
The labelling was done as described19,34,35. In brief, cells were washed twice, with Phenol red-free HBSS containing 1.8 g l−1 glucose (Invitrogen) and incubated at 37 °C and 7% CO2 for 1 h with 1 ml 250 nM FlAsH in HBSS supplemented with 12.5 µM 1,2-ethane dithiol (EDT). To reduce unspecific labelling, cells were washed again with HBSS, incubated for 10 min with 1 ml 250 µM EDT in HBSS, and finally washed twice with HBSS before being used for fluorescence measurements.
Confocal microscopy
Confocal microscopy experiments were performed on Leica TCS SP5 or TCS SP8 systems. Coverslips with transfected HEK29 cells were mounted using an Attofluor holder (Molecular Probes). Confocal images were taken with a 63× oil objective (numerical aperture, 1.4). CFP was excited with a diode laser at 458 nm laser line according to the manufacturer’s settings and fluorescence intensities were recorded from 470 to 550 nm. YFP and FlAsH were excited with a 514 nm laser line according to the manufacturer’s settings with the following modifications. Laser intensity was set to 2–4% and fluorescence intensities were recorded from 525 to 600 nm. Settings for recording were kept constant at 512 × 512 pixel format, line average 4, and 400 Hz. To avoid bleed through, parallel images of CFP and YFP/FlAsH were taken in sequential scan mode using the settings described above.
Time series were recorded using the standard Leica software package (LAS AF 3). Images were taken at 30-s intervals (unless stated otherwise). For quantitative analysis of the β-arrestin2 translocation, regions of interest (ROIs) were defined on the membrane and fluorescence intensities were recorded over time. To correct the images in the ROIs for possible photobleaching, control regions including the whole cells were defined. To quantify β-arrestin2 translocation the resulting fluorescence intensities were then related to the initial values. Solely for display reasons, but not for quantitative analyses, individual images were corrected for autocontrast using Photoshop software (Adobe CS6).
FRET
Dynamic FRET measurements in intact cells were performed as described previously34,36,37. In brief, HEK293 cells transfected as described above were washed with HBSS and maintained in measuring buffer (140 mM NaCl, 5 mM KCl, 2 mM CaCl2, 1 mM MgCl2, and 10 mM HEPES, pH 7.3) at room temperature. FRET measurements using FlAsH (after labelling as described above) or YFP as acceptor and CFP as donor were done with an inverted microscope (Axiovert 135; Zeiss) equipped with an oil immersion 63× objective, a dual-emission photometric system (Till Photonics), and a polychrome IV light source (Till Photonics). Signals were converted with Digidata 1321A (Science Products GmbH) and stored with Clampex 8.1 software (Science Products GmbH). To minimize photobleaching, the fluorescence signals were recorded from entire cells with a frequency of 10 Hz with 20–40 ms illumination times. FRET was monitored from the emission ratio of YFP to CFP, FYFP/FCFP (emission intensities at 535 ± 15 nm and 480 ± 20 nm, beamsplitter DCLP 505 nm) upon excitation at 436 ± 10 nm (beamsplitter DCLP 460 nm). The adjusted FRET ratio was corrected for the direct YFP or FlAsH excitation (YFP or FlAsH emission at 436 nm excitation divided by YFP emission at 480 nm excitation was 0.065). The CFP bleed-through was recorded separately and subtracted from the YFP fluorescence to give a corrected normalized ratio FYFP/FCFP. To determine dynamic changes in FRET, cells were continuously superfused with measuring buffer, and agonist was applied using a computer-assisted solenoid valve-controlled rapid superfusion device ALAVM8 (solution exchange 5–10 ms; ALA Scientific Instruments).
FRET was recorded between receptors C-terminally labelled with YFP and β-arrestin2 labelled with CFP (or vice versa) to monitor receptor–β-arrestin2 interactions, or between FlAsH bound to positions 1–8 in the various constructs and the C-terminal CFP in the β-arrestin2–FlAsH sensors. For β2AR interaction experiments, the phosphorylation-deficient β2ARPD–YFP construct21 served as a control for GRK-mediated phosphorylation. Since β-arrestin2 binding to M2AChR has been reported to have a greater contribution of non-phosphate binding elements32, phosphorylation-deficient receptor mutants could not serve as negative controls as in the case of β2AR.
Ligand washout with peristaltic pumps
To compare the kinetics of the receptor–β-arrestin interaction versus β-arrestin translocation under identical conditions the ligand addition to the coverslip was performed with a pipette. The subsequent agonist washout was done with a peristaltic pump (Ismatec IPC, IDEX Health & Science GmbH) whereby the cells were continuously superfused with measuring buffer and the solution was simultaneously withdrawn by suction. The solution exchange occurred with a flow rate of 1.4 ml min−1. Note that this results in a slower solution exchange than via the fast perfusion system used in Figs 1 and 2, but for technical reasons the latter system could not be fitted to the confocal system.
Immunoblot analysis for kinase activation
ERK1/2, Src and JNK phosphorylation were assessed in serum-starved (0.5% for 24 h) HEK293 cells expressing either the CFP-tagged wild-type β-arrestin2 or the β-arrestin2–FlAsH2/5 sensor (Extended Data Fig. 3); these cells had been also co-transfected with M2-muscarinic, β2-adrenergic or FFA4 receptors (Extended Data Fig. 5) at 80% confluence. Isoproterenol (100 µM), carbachol (100 µM) and DHA (10 µM) were added for the indicated times, and ERK1/2, Src or JNK phosphorylation was assessed by western blotting using phospho-specific antibodies (pERK, rabbit polyclonal anti-phospho-p44/42 MAPK (Thr-202/Tyr-204), Cell Signaling, 9101, 1:1,000; anti-phospho-Src (Tyr527), Cell Signaling, 2105, 1:1,000; phospho-SAPK/JNK (Thr183/Tyr185), Cell Signaling, 9251, 1:1,000). Total ERK or Gβ was quantified as loading control using a rabbit polyclonal p44/42 MAPK antibody (Cell Signaling, 9102, 1:1,000) or Gβ antibody (Santa Cruz, sc-378, 1:5,000). Quantification was done by chemiluminescence using a horseradish-peroxidase-conjugated polyclonal goat anti-rabbit antibody (Dianova, 111-035-144, 1:10,000). pERK, pSrc and pJNK bands 5–10 min after agonist stimulation represent the β-arrestin2 dependent activation of the respective kinases38.
Statistical analysis
No statistical methods were used to predetermine sample size. All data shown in bar graphs are presented as mean ± s.e.m. of n independent experiments (biological replicates, that is only one cell per coverslip was analysed). Statistical analyses were performed with the OriginLab software (version 9.1). For kinetic analysis the data were fitted with a nonlinear mathematical function (exponential decay first order:
where H(x) is the Heaviside step function) using again the Origin Lab software.
To analyse statistically significant differences of >2 independent samples of equal or different sample sizes (with unknown distributions and/or unequal variances) the Kruskal–Wallis test was used. The Mann–Whitney U test was used as post-hoc test to identify where the stochastic dominance occurs or for how many pairs of groups stochastic dominance is obtained.
Extended Data
Extended Data Figure 1. Specific labelling of FRET-based β-arrestin2 biosensors in intact cells with FlAsH.
HEK293 cells were transfected with one of the CFP-tagged β-arrestin2 biosensors, labelled with FlAsH and analysed by laser scanning microscopy. Confocal images show overlapping intracellular staining in both the CFP (blue) and the FlAsH (yellow) channels.
Extended Data Figure 2. Translocation of the β-arrestin2 biosensors.
HEK293 cells were transiently transfected with PTH1R–CFP and either wild-type β-arrestin2–YFP or one of the eight β-arrestin2–FlAsH–YFP sensors. a, Increase in membrane fluorescence 10 min after stimulation with 1 µM PTH 1–34 (N-terminal fragment) expressed as percentage increase of the initial fluorescence at t = 0 min. Data represent mean ± s.e.m. values of the indicated number of independent experiments. #P < 0.01 versus no effect (Kruskal–Wallis followed by Mann–Whitney U post-hoc analysis). b, Confocal images of the CFP-tagged PTH1R (left) and wild-type β-arrestin2–YFP (top), or β-arrestin2–FlAsH2–YFP (bottom) before (middle) and 10 min after PTH stimulation (right).
Extended Data Figure 3. β-Arrestin-dependent ERK1/2 phosphorylation.
HEK293 cells were transiently transfected with the indicated constructs or control vector (pcDNA3; Con) and treated without or with isoproterenol for 10 min (10 µM) as indicated. Cell lysates were analysed for pERK1/2 and ERK1/2 by immunoblot analysis. Data represent mean ± s.e.m., n = 6 independent experiments. *P < 0.05 versus unstimulated samples; #P < 0.05 versus isoproterenol-stimulated control (Kruskal–Wallis followed by Mann–Whitney U post-hoc analysis).
Extended Data Figure 4. Conformational changes in the β-arrestin2–FlAsH2 biosensor after FFA4R stimulation.
Representative traces of docosahexaenoic acid (DHA)-induced changes in the normalized FRET ratio (FFlAsH/FCFP) and the corresponding CFP (FCFP, cyan) or FlAsH (FFlAsH, yellow) emission recorded from one single HEK293 cell expressing the FFA4R and the FlAsH-labelled β-arrestin2–FlAsH2–CFP sensor. Application of 100 µM DHA is indicated. Representative trace of 10 experiments.
Extended Data Figure 5. β-Arrestin-mediated downstream signalling to kinases for M2-muscarinic, β2-adrenergic and FFA4 receptors.
HEK293 cells were transfected with β2AR, M2-muscarinic or FFA4 receptors and stimulated with respective agonists at saturating concentrations (isoproterenol, 100 µM; carbachol (CCH), 100 µM; docosahexaenoic acid, 10 µM) for 10 min. β-Arrestin downstream signalling was evaluated by phospho-specific antibodies for pSrc, pERK1/2 and pJNK. Gβ was used as loading control. Data represent mean ± s.e.m. of n = 12 independent experiments. *P < 0.05 versus unstimulated control; #P < 0.05 versus indicated column (Kruskal–Wallis followed by Mann–Whitney U post-hoc analysis).
Extended Data Figure 6. Concentration dependency of the kinetics of the conformational changes in β-arrestin upon β2AR stimulation.
HEK293 cells were co-transfected with the β2AR and β-arrestin2–FlAsH2–CFP and stimulated with different concentrations of isoproterenol. Kinetics of the agonist evoked intramolecular FRET changes were analysed by curve fitting according to Fig. 2. The bar graph shows the rate constants τ (s) for conformational changes detected with the β-arrestin2–FlAsH2 sensor upon stimulation with 1, 10, 30 or 100 µM isoproterenol, respectively. Data represent mean ± s.e.m. of n ≥ 3 independent experiments. The values are not significantly different (P < 0.05).
Extended Data Table 1.
FRET β-arrestin2 sensor constructs used in this study
| Abbreviation | Construct | FlAsH binding motif |
|---|---|---|
| FlAsH1 | β-Arrestin2-FlAsH1 | 331CCPGCC332 |
| FlAsH2 | β-Arrestin2-FlAsH2 | 154CCPGCC155 |
| FlAsH3 | β-Arrestin2-FlAsH3 | 49CCPGCC50 |
| FlAsH4 | β-Arrestin2-FlAsH4 | 150CCPGCC151 |
| FlAsH5 | β-Arrestin2-FlAsH5 | 157CCPGCC158 |
| FlAsH6 | β-Arrestin2-FlAsH6 | 326CCPGCC327 |
| FlAsH7 | β-Arrestin2-FlAsH7 | 335CCPGCC336 |
| FlAsH8 | β-Arrestin2-FlAsH8 | 193CCPGCC194 |
Insertion sites for the FlAsH-binding motif CCPGCC are denoted in single letter code with the amino acid positions in the β-arrestin2 sequence.
Acknowledgments
We thank N. Ziegler, N. Yurdagül-Hemmrich and M. Fischer for technical assistance and C. Krasel for discussions. This work was supported by the Deutsche Forschungsgemeinschaft grants SFB-487 TPA1 and SFB-TR166 (M.J.L. and C.H.), the Bundesministerium für Bildung und Forschung grant OptiMAR (M.J.L.), the ERC grants Topas and Fresca and the NIH grant 1 R01 DA038882 (M.J.L.), the Biotechnology and Biological Sciences Research Council (grant BB/K019864/1 to G.M.)
Footnotes
Online Content Methods, along with any additional Extended Data display items and Source Data, are available in the online version of the paper; references unique to these sections appear only in the online paper.
Author Contributions Contributed new reagents or analytical tools: S.N., U.Z., A.N., G.M. and A.B.T. Conducted experiments: S.N. (FRET, microscopy), U.Z. (cloning) and K.L. (kinase assays). Performed data analysis: S.N., A.N. and K.L. Wrote and contributed to writing of the manuscript: S.N., M.J.L. and C.H. Participated in research design: S.N., M.J.L. and C.H. Initiation of the project: C.H.
The authors declare no competing financial interests.
References
- 1.Lohse MJ, Hoffmann C. Arrestin interactions with G protein-coupled receptors. Handb. Exp. Pharmacol. 2014;219:15–56. doi: 10.1007/978-3-642-41199-1_2. [DOI] [PubMed] [Google Scholar]
- 2.Shukla AK, Xiao K, Lefkowitz RJ. Emerging paradigms of β-arrestin-dependent seven transmembrane receptor signaling. Trends Biochem. Sci. 2011;36:457–469. doi: 10.1016/j.tibs.2011.06.003. [DOI] [PMC free article] [PubMed] [Google Scholar]
- 3.Lohse MJ, Benovic JL, Codina J, Caron MG, Lefkowitz RJ. β-Arrestin: a protein that regulates β-adrenergic receptor function. Science. 1990;248:1547–1550. doi: 10.1126/science.2163110. [DOI] [PubMed] [Google Scholar]
- 4.Wilden U, Hall SW, Kühn H. Phosphodiesterase activation by photoexcited rhodopsin is quenched when rhodopsin is phosphorylated and binds the intrinsic 48-kDa protein of rod outer segments. Proc. Natl Acad. Sci. USA. 1986;83:1174–1178. doi: 10.1073/pnas.83.5.1174. [DOI] [PMC free article] [PubMed] [Google Scholar]
- 5.Goodman OB, et al. β-Arrestin acts as a clathrin adaptor in endocytosis of the β2-adrenergic receptor. Nature. 1996;383:447–450. doi: 10.1038/383447a0. [DOI] [PubMed] [Google Scholar]
- 6.Ferguson SS, et al. Role of β-arrestin in mediating agonist-promoted G protein-coupled receptor internalization. Science. 1996;271:363–366. doi: 10.1126/science.271.5247.363. [DOI] [PubMed] [Google Scholar]
- 7.Kang DS, Tian X, Benovic JL. β-Arrestins and G protein-coupled receptor trafficking. Methods Enzymol. 2013;521:91–108. doi: 10.1016/B978-0-12-391862-8.00005-3. [DOI] [PubMed] [Google Scholar]
- 8.Shukla AK, et al. Structure of active β-arrestin-1 bound to a G-protein-coupled receptor phosphopeptide. Nature. 2013;497:137–141. doi: 10.1038/nature12120. [DOI] [PMC free article] [PubMed] [Google Scholar]
- 9.Kim YJ, et al. Crystal structure of pre-activated arrestin p44. Nature. 2013;497:142–146. doi: 10.1038/nature12133. [DOI] [PubMed] [Google Scholar]
- 10.Kang Y, et al. Crystal structure of rhodopsin bound to arrestin by femtosecond X-ray laser. Nature. 2015;523:561–567. doi: 10.1038/nature14656. [DOI] [PMC free article] [PubMed] [Google Scholar]
- 11.Schleicher A, Kühn H, Hofmann KP. Kinetics, binding constant, and activation energy of the 48-kDa protein-rhodopsin complex by extra-metarhodopsin II. Biochemistry. 1989;28:1770–1775. doi: 10.1021/bi00430a052. [DOI] [PubMed] [Google Scholar]
- 12.Gurevich VV, Gurevich EV. The structural basis of arrestin-mediated regulation of G-protein-coupled receptors. Pharmacol. Ther. 2006;110:465–502. doi: 10.1016/j.pharmthera.2005.09.008. [DOI] [PMC free article] [PubMed] [Google Scholar]
- 13.Hanson SM, et al. Differential interaction of spin-labeled arrestin with inactive and active phosphorhodopsin. Proc. Natl Acad. Sci. USA. 2006;103:4900–4905. doi: 10.1073/pnas.0600733103. [DOI] [PMC free article] [PubMed] [Google Scholar]
- 14.Vishnivetskiy SA, et al. The role of arrestin α-helix I in receptor binding. J. Mol. Biol. 2010;395:42–54. doi: 10.1016/j.jmb.2009.10.058. [DOI] [PMC free article] [PubMed] [Google Scholar]
- 15.Xiao K, Shenoy SK, Nobles K, Lefkowitz RJ. Activation-dependent conformational changes in β-arrestin 2. J. Biol. Chem. 2004;279:55744–55753. doi: 10.1074/jbc.M409785200. [DOI] [PubMed] [Google Scholar]
- 16.Charest PG, Terrillon S, Bouvier M. Monitoring agonist-promoted conformational changes of β-arrestin in living cells by intramolecular BRET. EMBO Rep. 2005;6:334–340. doi: 10.1038/sj.embor.7400373. [DOI] [PMC free article] [PubMed] [Google Scholar]
- 17.Lohse MJ, Nuber S, Hoffmann C. Fluorescence/bioluminescence resonance energy transfer techniques to study G-protein-coupled receptor activation and signaling. Pharmacol. Rev. 2012;64:299–336. doi: 10.1124/pr.110.004309. [DOI] [PubMed] [Google Scholar]
- 18.Hanson SM, Gurevich VV. The differential engagement of arrestin surface charges by the various functional forms of the receptor. J. Biol. Chem. 2006;281:3458–3462. doi: 10.1074/jbc.M512148200. [DOI] [PMC free article] [PubMed] [Google Scholar]
- 19.Hoffmann C, et al. Fluorescent labeling of tetracysteine-tagged proteins in intact cells. Nature Protocols. 2010;5:1666–1677. doi: 10.1038/nprot.2010.129. [DOI] [PMC free article] [PubMed] [Google Scholar]
- 20.Klenk C, et al. Formation of a ternary complex among NHERF1, β-arrestin, and parathyroid hormone receptor. J. Biol. Chem. 2010;285:30355–30362. doi: 10.1074/jbc.M110.114900. [DOI] [PMC free article] [PubMed] [Google Scholar]
- 21.Krasel C, Bünemann M, Lorenz K, Lohse MJ. β-Arrestin binding to the β2-adrenergic receptor requires both receptor phosphorylation and receptor activation. J. Biol. Chem. 2005;280:9528–9535. doi: 10.1074/jbc.M413078200. [DOI] [PubMed] [Google Scholar]
- 22.Sykes DA, et al. Observed drug-receptor association rates are governed by membrane affinity: the importance of establishing “micro-pharmacokinetic/pharmacodynamic relationships” at the β2-adrenoceptor. Mol. Pharmacol. 2014;85:608–617. doi: 10.1124/mol.113.090209. [DOI] [PubMed] [Google Scholar]
- 23.Krasel C, et al. Dual role of the β2-adrenergic receptor C terminus for the binding of β-arrestin and receptor internalization. J. Biol. Chem. 2008;283:31840–31848. doi: 10.1074/jbc.M806086200. [DOI] [PubMed] [Google Scholar]
- 24.Söhlemann P, Hekman M, Puzicha M, Buchen C, Lohse MJ. Binding of purified recombinant β-arrestin to guanine-nucleotide-binding-protein-coupled receptors. Eur. J. Biochem. 1995;232:464–472. [PubMed] [Google Scholar]
- 25.Violin JD, Ren X-R, Lefkowitz RJ. G-protein-coupled receptor kinase specificity for β-arrestin recruitment to the β2-adrenergic receptor revealed by fluorescence resonance energy transfer. J. Biol. Chem. 2006;281:20577–20588. doi: 10.1074/jbc.M513605200. [DOI] [PubMed] [Google Scholar]
- 26.Hein P, Bünemann M. Coupling mode of receptors and G proteins. Naunyn Schmiedebergs Arch. Pharmacol. 2009;379:435–443. doi: 10.1007/s00210-008-0383-7. [DOI] [PubMed] [Google Scholar]
- 27.Lohse MJ, et al. Optical techniques to analyze real-time activation and signaling of G-protein-coupled receptors. Trends Pharmacol. Sci. 2008;29:159–165. doi: 10.1016/j.tips.2007.12.002. [DOI] [PubMed] [Google Scholar]
- 28.Lee M-H, et al. The conformational signature of β-arrestin2 predicts its trafficking and signalling functions. Nature. doi: 10.1038/nature17154. http://dx.doi.org/10.1038/nature17154 (this issue) [DOI] [PMC free article] [PubMed] [Google Scholar]
- 29.Lohse MJ, Calebiro D. Cell biology: Receptor signals come in waves. Nature. 2013;495:457–458. doi: 10.1038/nature12086. [DOI] [PubMed] [Google Scholar]
- 30.Irannejad R, et al. Conformational biosensors reveal GPCR signalling from endosomes. Nature. 2013;495:534–538. doi: 10.1038/nature12000. [DOI] [PMC free article] [PubMed] [Google Scholar]
References
- 31.Gurevich VV, Gurevich EV. The new face of active receptor bound arrestin attracts new partners. Structure. 2003;11:1037–1042. doi: 10.1016/s0969-2126(03)00184-9. [DOI] [PubMed] [Google Scholar]
- 32.Vishnivetskiy SA, et al. Few residues within an extensive binding interface drive receptor interaction and determine the specificity of arrestin proteins. J. Biol. Chem. 2011;286:24288–24299. doi: 10.1074/jbc.M110.213835. [DOI] [PMC free article] [PubMed] [Google Scholar]
- 33.Ho SN, Hunt HD, Horton RM, Pullen JK, Pease LR. Site-directed mutagenesis by overlap extension using the polymerase chain reaction. Gene. 1989;77:51–59. doi: 10.1016/0378-1119(89)90358-2. [DOI] [PubMed] [Google Scholar]
- 34.Hoffmann C, et al. A FlAsH-based FRET approach to determine G protein-coupled receptor activation in living cells. Nature Methods. 2005;2:171–176. doi: 10.1038/nmeth742. [DOI] [PubMed] [Google Scholar]
- 35.Zürn A, et al. Site-specific, orthogonal labeling of proteins in intact cells with two small biarsenical fluorophores. Bioconjug. Chem. 2010;21:853–859. doi: 10.1021/bc900394j. [DOI] [PubMed] [Google Scholar]
- 36.Vilardaga J-P, Bünemann M, Krasel C, Castro M, Lohse MJ. Measurement of the millisecond activation switch of G protein-coupled receptors in living cells. Nature Biotechnol. 2003;21:807–812. doi: 10.1038/nbt838. [DOI] [PubMed] [Google Scholar]
- 37.Hein P, Frank M, Hoffmann C, Lohse MJ, Bünemann M. Dynamics of receptor/G protein coupling in living cells. EMBO J. 2005;24:4106–4114. doi: 10.1038/sj.emboj.7600870. [DOI] [PMC free article] [PubMed] [Google Scholar]
- 38.Shenoy SK, et al. β-Arrestin-dependent, G protein-independent ERK1/2 activation by the β2-adrenergic receptor. J. Biol. Chem. 2006;281:1261–1273. doi: 10.1074/jbc.M506576200. [DOI] [PubMed] [Google Scholar]


