

Abstract
Aims
Circulating angiogenic cells (CACs) promote revascularization of ischaemic tissues although their underlying mechanism of action and the consequences of delivering varying number of these cells for therapy remain unknown. This study investigates molecular mechanisms underpinning CAC modulation of blood vessel formation.
Methods and results
CACs at low (2 × 10⁵ cells/mL) and mid (2 × 10⁶ cells/mL) cellular densities significantly enhanced endothelial cell tube formation in vitro, while high density (HD) CACs (2 × 10⁷ cells/mL) significantly inhibited this angiogenic process. In vivo, Matrigel-based angiogenesis assays confirmed mid-density CACs as pro-angiogenic and HD CACs as anti-angiogenic. Secretome characterization of CAC-EC conditioned media identified pentraxin 3 (PTX3) as only present in the HD CAC-EC co-culture. Recombinant PTX3 inhibited endothelial tube formation in vitro and in vivo. Importantly, our data revealed that the anti-angiogenic effect observed in HD CAC-EC co-cultures was significantly abrogated when PTX3 bioactivity was blocked using neutralizing antibodies or PTX3 siRNA in endothelial cells. We show evidence for an endothelial source of PTX3, triggered by exposure to HD CACs. In addition, we confirmed that PTX3 inhibits fibroblast growth factor (FGF) 2-mediated angiogenesis, and that the PTX3 N-terminus, containing the FGF-binding site, is responsible for such anti-angiogenic effects.
Conclusion
Endothelium, when exposed to HD CACs, releases PTX3 which markedly impairs the vascular regenerative response in an autocrine manner. Therefore, CAC density and accompanying release of angiocrine PTX3 are critical considerations when using these cells as a cell therapy for ischaemic disease.
Keywords: Vascular repair, Cell therapy, Ischaemia, PTX3, Circulating angiogenic cell
1. Introduction
Cell therapy to promote vascular regeneration in ischaemic tissues is an emergent therapeutic strategy and there are already clinical trials for acute myocardial infarction1 and critical limb ischaemia.2 These clinical trials have shown such cytotherapies to be safe, tolerable, and feasible; however, clinical efficacy outcomes have been inconsistent. Therefore the development of an efficacious cytotherapy requires a better understanding of the biology of the cells used, the most effective dosage, and precise mechanisms of action. We have previously characterized two distinct types of human endothelial progenitor cells (EPCs): endothelial colony forming cells (ECFCs) and circulating angiogenic cells (CACs).3 CACs, also called early EPCs or myeloid angiogenic cells, are isolated from human peripheral blood and have been shown to assist vascular repair through paracrine mechanisms, partly explained by IL8 secretion resulting in VEGFR2 transactivation.4 While CACs represent candidate cells for cytotherapy, their intrinsic haematopoietic nature requires further understanding of the molecular mechanisms that dictate endothelial cell responses.
Cell populations with similar phenotypes to CACs, are currently being clinically trialled as a therapy for acute myocardial infarction5 and pulmonary arterial hypertension.6 Other similar cell therapy trials such as TOPCARE-AMI,7 BOOST,8 and Repair-AMI9 have used autologous bone marrow (BM)-derived cells. These have shown some beneficial effects in improving left ventricular ejection fraction although their effectiveness has been challenged by the acute myocardial infarction bone marrow-derived stem cell (BMSC)10 and the autologous stem cell transplantation in acute myocardial infarction (ASTAMI)11 trials which showed no significant improvement in ejection fraction at 4 and 6 month follow-up. It is important to highlight that these studies delivered very different cell densities in their clinical protocols. Indeed, the minimum therapeutic dose is a critical factor that must be addressed in appropriately designed dose-escalating clinical trials. In addition, the ceiling effect, well demonstrated in the field of mesenchymal stromal cells, whereby increasing cell number reaches a threshold where higher cell numbers fail to provide additional therapeutic effect,12 also needs to be considered. As CAC-based cytotherapy translates into the clinical setting, safety dose-escalating studies such as the PHACeT6 trial are warranted, and it is essential to understand the impact of cellular density on CACs vasoreparative function. This investigation uses various experimental models to determine how CAC cell dose modulates endothelial function.
Pentraxin 3 (PTX3) is a soluble pattern recognition protein, produced and released by endothelial and myeloid cells, in response to inflammatory stimuli such as IL-1β, TNF-α, and lipopolysaccharide (LPS).13 Besides the classical role for PTX3 in the innate immune response, this protein has also been shown to inhibit blood vessel formation.14 Our data identified PTX3 as a critical modulator of angiogenesis in high density (HD) CAC-endothelial cell co-cultures. Here, we present evidence to demonstrate that the cross-talk between abundant CACs and endothelial cells induces PTX3 expression and release. This endothelium-derived PTX3 has an autocrine anti-angiogenic effect, mediated by fibroblast growth factor 2 (FGF2) binding and neutralization that explains why high-CAC numbers, do not facilitate but in fact, impair the vasoreparative process.
2. Methods
Detailed methods are available in online supplement.
2.1 Cell isolation and culture
Human peripheral blood was obtained under full ethical approval granted by Queen’s University Research Ethical Committee Ref 14.44v2. Appropriate consent was obtained from healthy volunteers aged 18–50 years, in accordance with the declaration of Helsinki. The mononuclear cell (MNC) fraction was isolated and cells seeded at a density of 2 × 10⁶ cells/mL in fibronectin-coated flasks and cultured in EGM2-MV medium (Lonza) supplemented with 10% FBS.
2.2 RNA extraction and RT-qPCR
Total RNA was extracted and cDNA was synthesized using High-Capacity RNA-to-cDNA Kit (Life Technologies). Quantitative real-time PCR was performed for 50 cycles in a LightCycler 480 (Roche). Primer sequences are shown in Supplementary material online, Table S1.
2.3 siRNA knockdown
Cells were transfected at 80% confluence with 10 nm siRNA using Lipofectamine 2000 for 16 h, passaged and used for experimental analysis within 24–48 h. PTX3 siRNA (s11585) and control siRNA were purchased from Life Technologies.
2.4 Western blotting
Protein was extracted by lysing cells in radioimmunoprecipitation assay (RIPA) buffer containing protease and phosphatase inhibitors (Thermo Scientific). 30 µg of protein was loaded onto sodium dodecyl sulfate (SDS) gels. After electrophoresis, proteins were transferred onto polyvinylidene difluoride (PVDF) membranes, which were incubated overnight at 4 °C with rabbit PTX3 antibody (Abcam). Next, membranes were washed and incubated with secondary antibodies (Advansta). Blots were developed using chemiluminescent horseradish peroxidase (HRP) substrate (Millipore).
2.5 Immunocytochemistry
CACs were fixed in 4% paraformaldehyde (PFA), blocked and incubated overnight at 4°C with primary antibodies. After washing in phosphate buffered saline (PBS), cells were incubated in appropriate secondary antibodies for 1 h at room temperature and observed under a confocal fluorescence microscope (Nikon). Primary antibodies used were against Vimentin (Dako), CD31 (Abcam), VEGFR2, and CD14 (Santa Cruz). Respective anti-mouse/anti-rat and anti-rabbit Alexa Flour 488 and 568 IgGs (Molecular Probes, Invitrogen) were used as secondary antibodies.
2.6 Flow cytometry
Live cells were incubated with antibodies against CD3, CD14, CD16, CD20, CD45, CD16, CD163, CD235 (eBioscience), CD66b (Abcam), and CD206 (BD Biosciences). After a wash in PBS, cells were resuspended in 1 mL of staining buffer for analysis using an Attune acoustic cytometer (Life Technologies). At least 20 000 events were acquired for each sample and FlowJo software was used for data analysis.
2.7 In vitro tubulogenesis assay
CACs and microvascular endothelial cells (MECs) were labelled with PKH fluorescent cell linker kit (Sigma) prior to experiments. CACs were mixed at a low density (LD) 5 × 10³−1 × 10⁴, a medium density (MD) 5 × 10⁴−1 × 10⁵ and a HD 5 × 10⁵−1 × 10⁶ with 1 × 10⁵ MECs. Cell suspensions in 25 µL were mixed with 25 µL of growth factor-reduced Matrigel (Corning) and the final 50 μL aliquots were spotted onto a 24-well plate. After polymerization, spots were covered with Dulbecco’s modified Eagle’s medium (DMEM) containing 5% porcine serum. After 24–72 h, wells were assessed for the presence of tubules. In a different set of experiments, conditioned medium (CM) taken from CAC-MEC co-cultures was used in this tubulogenesis model with MECs.
2.8 In vivo Matrigel subcutaneous implant assay
All animal experiments were performed in conformity to UK Home Office Regulations (PPL2729) and with authorization from Queen’s University Belfast Animal Welfare and Ethical Review Body (AWERB). Eight week-old male Athymic nude mice (Harlan Laboratories) were used. CACs were mixed at a LD 2 × 10⁴, a MD 2 × 10⁵, and a HD 2 × 10⁶ with 2 × 10⁵ MECs, diluted in 10 µL of phenol red-free DMEM and resuspended in 90 µL of growth factor-reduced Matrigel (Corning) and injected subcutaneously. After 8 days, mice were sacrificed using intraperitoneal (IP) administration of sodium pentobarbital at 200 mg/kg, and implants were removed and fixed in 4% formaldehyde overnight. Fixed Matrigel implants were then embedded in paraffin and 10 µm sections were prepared for staining.
2.9 Oxygen induced retinopathy (OIR) model
All animal experiments were performed in conformity to UK Home Office Regulations (PPL2729) and with authorization from Queen’s University Belfast AWERB. P7 newborn mice and their nursing dams were exposed to 75% oxygen (Pro-Ox 110 Chamber Controller, Biospherix) for 5 days. At P12, they were transferred back to room air. At P13, mice received a 1 μL intravitreal injection of 100 ng/mL recombinant human PTX3 in the left eye. Phenol red-free DMEM without growth factors and serum (GIBCO®) was used as vehicle and injected in the contralateral right eye of each pup as a control. All pups were euthanized at P16 and eyes fixed in 4% PFA with sodium pentobarbital at 200 mg/Kg. Flat-mounted retinas were stained with isolectin B4 (Sigma) and streptavidin-AlexaFlour488 (Invitrogen).
2.10 Human angiogenesis antibody array
Conditioned media was analysed using the proteome profiler human angiogenesis array (R&D Systems) in accordance with manufacturer guidelines. Membranes were incubated with streptavidin–horseradish peroxidase secondary antibody and spots were detected using a UVP bioimaging system. Densitometry was performed using Image J software.
2.11 PTX3 ELISA
The human PTX3 ELISA kit (MyBiosource) was used according to the manufacturer instructions.
2.12 Cell viability assay
Cell viability was assessed using the LIVE/DEAD viability/cytotoxicity kit (Invitrogen). As a positive control, to induce cell death we treated some co-cultures with 70% ethanol prior to Calcein/EthD-1 staining.
2.13 Clonogenic assay
ECFCs were seeded onto 6 well plates at a density of 100 cells/mL and wells monitored for the formation of colonies. After 10 days, cells were fixed with glutaraldehyde 6.0% (vol/vol), stained with crystal violet 0.5% (wt/vol) in distilled water for 30 min at room temperature, and washed by immersion in a bath of water. The percentage of area occupied by crystal violet was quantified using Image J software.
2.14 In vitro migration assay
Gelatin-coated 24 well plates were labelled with traced lines so as the same regions were photographed at different time points. MECs were seeded, and when confluent, the cell monolayer was scraped in a straight line to create a ‘scratch’ with a p200 pipette tip. CACs at low, mid, and HDs were layered on top of MEC monolayers. Images were taken immediately after the scratch and after 12 h using a phase-contrast microscope. Cell migration was quantified by comparing denuded area at 0 and 12 h.
2.15 Statistical analysis
Statistical significance for comparison between two groups was evaluated using Prism software and unpaired two tailed t-test analysis. For multiple comparisons, we used one way analysis of variance (ANOVA). For the Oxygen induced retinopathy (OIR) study, data were evaluated using Prism software and paired two tailed t-test analysis. Data visualization was performed using the R package ggplot2 and represented as individual data points together with means and standard error of the mean (SEM).
3. Results
3.1 Cultured CACs are different from density gradient-enriched MNCs
After 7 days in culture, CACs exhibited spindle-shaped and spherical morphologies for the main and minor populations, respectively. CACs used in this study were characterized by the positive expression of vimentin, CD31, VEGFR2, and CD14 (Figure 1A). Immunophenotyping was performed to further distinguish various blood cell populations within CACs (green histograms) from MNCs (orange histograms) and whole blood cells (red histograms). While whole blood was mainly composed of erythrocytes (97%), MNCs obtained by density gradient fractionation displayed minor erythrocyte contamination (3%), and CACs were completely devoid of erythrocytes (0%). CD45 was highly expressed at a similar level (97%) by both MNCs and CACs, while the myeloid marker CD14 was enriched in CACs (82%) when compared to MNCs (20%) (Figure 1B). This characterization also indicated that the T cell marker CD3 was highly expressed on MNCs (61%), while minor expression was found on CACs (3%). Similarly, the B lymphocyte marker CD20 was completely absent in CACs (0%) while present in 2% of MNCs. CAC cultures were also devoid of granulocytes (0%) which represented 19% of MNCs as demonstrated by quantification of CD66b positive cells. CACs display some characteristics shared with M2 macrophages such as high expression of CD163 (71%) and CD206 (56%). These M2 markers were present on MNCs at lower levels (21 and 1% respectively) (Figure 1C). These findings indicate that CACs are a highly enriched population of myeloid cells, devoid of erythrocytes, B lymphocytes, and granulocytes, with an immunophenotype akin to M2 macrophages.
Figure 1.

CACs isolated from human blood are enriched for myeloid cells. (A) Phase contrast image of CACs at Day 7 of culture. Scale bar 100 μm. Representative immunocytochemistry images for Vimentin, CD31, VEGFR2, and CD14 in green. Nuclei stained with DAPI in blue. Magnification ×10 is shown in upper panel and ×40 in lower panel. (B) Flow cytometry immunophenotyping of whole blood, MNCs, and CACs. Red histograms show whole blood cells, orange histograms MNCs and green histograms CACs. Respective isotype controls shown as grey histograms. (C) Flow cytometry quantification of cell surface marker expression for T & B lymphocytes, granulocytes, and macrophages on MNCs and CACs. Orange histograms represent MNCs and green histograms CACs. Respective isotype controls shown as grey histograms.
3.2 Cellular density determines CACs vasoreparative potential
To address whether the cellular density of CACs is an important factor in determining their therapeutic potential, we used two well-established angiogenesis assays, an in vitro Matrigel-based 3D tube formation assay and an in vivo Matrigel subcutaneous implant assay. Taking into account the cell dosage utilized by previous human clinical trials which have delivered cells directly into myocardium and vitreous, we selected a range of CAC cell densities that are clinically-relevant. MECs were labelled in green and CACs in red prior to co-culture. MECs formed a network of tube-like structures within 72 h (Figure 2A). While CACs did not incorporate into these tubes and remained adjacent to the MEC vascular network, addition of LD-CACs increased MEC tube formation when compared to MECs alone/controls (Figure 2A and B). A 10-fold increase in the cellular density of CACs to a mid-density (MD) led to further significant enhancement of MEC tubulogenesis when compared to controls (P < 0.01) (Figure 2A and B). Surprisingly, the addition of an even HD of CACs (a 100-fold increase) to the co-culture system dramatically reduced MEC tube formation when compared to controls (P < 0.01) (Figure 2A and B). These results were confirmed in five different clones of CACs (see Supplementary material online, Figure S1). Although the extent of angiogenesis inhibition varied from clone to clone, HD-CACs consistently diminished CACs pro-angiogenic effect. CM from co-culture experiments demonstrated similar outcomes, with CM from HD-CACs significantly inhibiting MEC tube formation capacity (Figure 2C). This indicated the presence of a soluble factor in the CM from HD-CACs + MECs co-cultures which was responsible for the observed suppressive effect on endothelial tube formation. A live/dead cytotoxicity assay demonstrated no significant cell death (red nuclei) among the co-cultures with different CAC cellular densities (Figure 2D). All these in vitro results highlighted that cellular density of CACs is a critical factor in determining their angiogenic potential and revealed that a high cellular density of CACs significantly inhibited endothelial cell tube forming capacity. Similar results were seen in a MEC scratch wound assay, which revealed a significant increase in MEC migration with the addition of LD-CACs (P < 0.01), while HD-CACs resulted in a significant reduction in MEC migration (P < 0.001) (see Supplementary material online, Figure S2).
Figure 2.

The angiogenic potential of CACs is affected by their cellular density. (A) Representative images of green-labelled MECs and red-labelled CACs co-culture after 72 h in the 3D Matrigel tube formation assay. Scale bar 250 μm. (B) Quantification and statistical analysis of tube areas for experimental groups depicted in A (n = 3–4, one way-ANOVA, **P < 0.01 vs. control, ###P < 0.001 vs. MD-CACs). (C) Evaluation of the effect for the CACs CM at different densities on MEC tube forming capacity (n = 3, one-way ANOVA, *P < 0.05 vs. control, ##P < 0.01 vs. LD-CACs). (D) Representative images for cell death assessment using the LIVE/DEAD kit. Dead cells shown in red by EthD-1 and live cells in green by calcein. Scale bar 250 μm. Quantification of number of dead cells per field of vision (FOV), (n = 8; unpaired t-test; ns , not significant). (E) Representative images of paraffin sections from the in vivo Matrigel angiogenesis model in nude mice stained for the endothelial marker CD31 in red. Nuclei are stained in blue with DAPI. Matrigel implants are surrounded by yellow dotted line. Scale bar 250 μm. Quantification and statistical analysis of CD31 positive areas within Matrigel implants (data visualized as boxplots, n = 11–21, one-way ANOVA, ***P < 0.001 vs. control, *P < 0.05 vs. control; ns, not significant vs. control; #P < 0.05 vs. MD-CACs).
A Matrigel subcutaneous implant model was used as an in vivo model to test the relevance of CAC cell density on angiogenesis. Following the same protocols and conditions as for the previous in vitro co-culture studies, MECs were mixed with different densities of CACs in Matrigel and implanted subcutaneously into the dorsal flank region of nude mice. After 8 days, Matrigel implants were sampled and assessed for the degree of vascularity by CD31 immunofluorescent staining. MD-CACs + MECs showed the highest vascularity, when compared to other experimental groups (Figure 2E). On the contrary, Matrigel implants containing HD-CACs + MECs showed significantly decreased CD31+ staining when compared to the MD group (P < 0.05) (Figure 2E). These in vivo data support in vitro findings in demonstrating the loss of pro-angiogenic potential of CACs at high cellular densities.
3.3 The secretome profile of CAC + MECs is altered by high-cellular density
Since HD-CACs-induced anti-angiogenic effects on MECs through release of a soluble factor, we examined the secretome profiles of CACs + MECs co-cultures by characterizing conditioned media from previous in vitro co-culture experiments and profiling 55 secreted angiogenesis-related proteins. Endothelin 1 was identified in the CM from MECs alone (Figure 3A). In the LD-CACs + MECs co-culture, four different proteins were secreted including IL8, TIMP-1, Endothelin 1, and MMP-9. In the MD-CACs + MECs co-culture media, eight different proteins were found, including MCP-1 and PAI-1. Overall, as expected, there was an increase in the amount of protein with increasing cellular density of CACs. However, in the HD-CACs + MECs co-culture, despite the higher number of CACs, there was a significant decrease in IL8. In addition, two proteins were identified exclusively in the HD-CAC + MEC co-culture media: angiogenin and PTX3 (Figure 3A). Therefore subsequent experiments focused on these two proteins to identify the angiogenesis inhibitor. Recombinant human angiogenin did not show any inhibition of angiogenesis on MEC cultures; on the contrary, angiogenin significantly enhanced MEC tubulogenesis (see Supplementary material online, Figure S3). Similar experiments were performed with recombinant human PTX3, which significantly reduced MEC tubulogenic capacity (P < 0.001) (Figure 3B). Consequently, we decided to focus on PTX3 as the soluble factor that modulates the anti-angiogenic effects seen in HD-CAC + MEC co-cultures.
Figure 3.
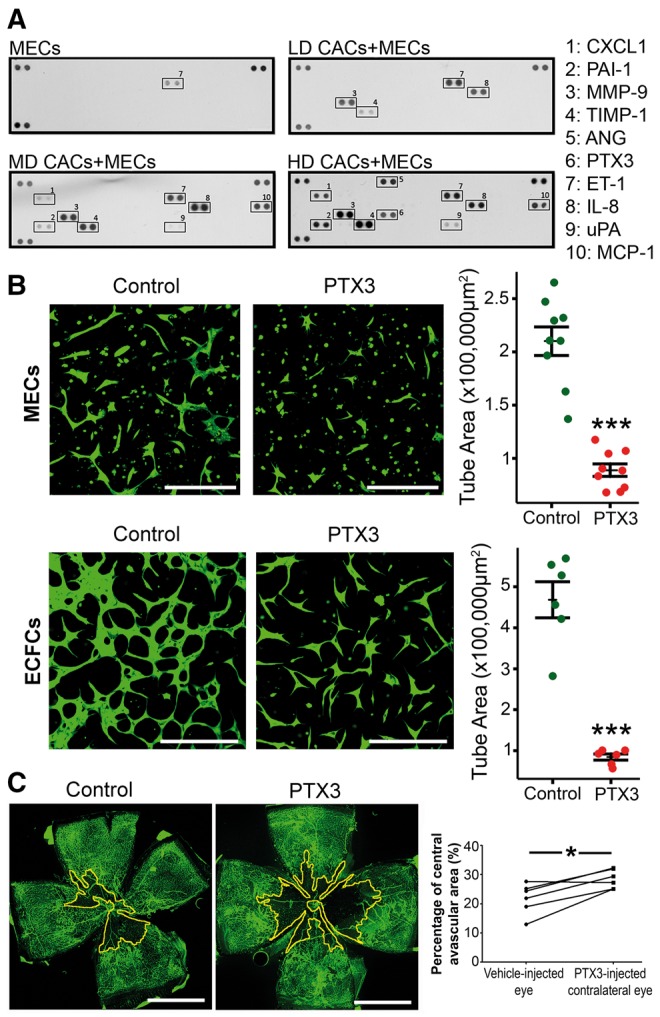
PTX3 is identified exclusively in the HD-CACs + MECs co-culture and has anti-angiogenic function. (A) Proteome profiler for CM characterization. Positive control protein spots are shown in top left, top right, and bottom left corners. Negative control spots are on the bottom right corner (n = 2). (B) Representative fluorescent microscope images for the in vitro Matrigel-based 3D tube formation assay with bovine MECs or human ECFCs labelled in green with Calcein, with and without exposure to 500 ng/mL PTX3. Scale bar 250 μm. Statistical comparison of tube areas between groups (n = 6–9, unpaired t-test, ***P < 0.001 vs. control). (C) Representative flat-mounted retinas of C57BL/6 mice that received an intravitreal injection of 1 μL PTX3 at 100 ng/mL or 1 µL of vehicle. Lectin staining in green identifies retinal vasculature. Avascular regions are surrounded by a yellow line. Scale bar 1 mm. Quantification of avascular areas (n = 6, paired t-test, *P < 0.05 comparing vehicle-treated and PTX3-treated eyes).
3.4 PTX3 blocks angiogenesis in vitro and in vivo
We next evaluated whether PTX3 was responsible for the anti-angiogenic effects observed in HD-CAC cultures. MECs exposed to PTX3 showed a significant reduction in tube formation when compared to non-treated cells (P < 0.001) (Figure 3B). This effect of PTX3 was not restricted to MECs, as human ECFCs and human aortic endothelial cells also demonstrated a significant reduction in tubulogenesis induced by PTX3 (P < 0.001) (Figure 3B and Supplementary material online, Figure S4). In addition, ECFCs exhibited a significant reduction in cell migration (P < 0.01) when treated with PTX3 (500 ng/mL) in the scratch wound assay (see Supplementary material online, Figure S5).
To further test the effect of PTX3 in an in vivo disease-relevant setting, we used the OIR model. OIR produces defined retinal ischaemia and has been widely used to examine vascular repair. Recombinant PTX3 was delivered intravitreally at post-natal day 13 (P13), the time point in which the retina experiences primary hypoxic insult. After 72 h (P16), the retinas were harvested and stained with isolectin B4 (green) to visualize the retinal vasculature. It was observed that intravitreal injection of PTX3 did not induce intra-retinal angiogenesis but significantly halted retinal blood vessel formation as demonstrated by the significant increase in avascular areas (P < 0.05) when compared to the retina in vehicle-injected contralateral eyes (Figure 3C). Taken together, these findings indicate that PTX3 suppresses endothelial function in vitro and in vivo and, importantly, in a disease-relevant model of retinal ischaemia.
3.5 PTX3 mediates HD-CACs driven anti-angiogenic effects on endothelial cells
To further test PTX3 role inhibiting angiogenesis in HD-CAC + MEC co-cultures, an antibody against PTX3 was used. Since PTX3 is comprised of a C-terminal domain shared with C-reactive protein and a unique N-terminal domain, two specific monoclonal antibodies, 16B5 and MNB4, were used to target the PTX3 C-terminus and N-terminus domains respectively. MECs were labelled with green PKH and CACs with red PKH before co-culturing in the 3D in vitro Matrigel model. In agreement with the previous results, while LD-CACs increased MEC tube formation from 100% in MEC controls to 182% (Figure 4A and E), co-culture with HD-CACs led to a significant reduction in MEC tubule area (P < 0.001) to 51% of MEC controls (Figure 4B and E). Interestingly, this effect was significantly abrogated (P < 0.001) by blocking the N-terminus of PTX3 using a MNB4 antibody (Figure 4D) and MECs tube area increased to 111% of MEC controls (Figure 4E). However, when we used a 16B5 antibody that targets the C-terminus of PTX3, there was no significant change on HD-CACs anti-angiogenic effects (Figure 4C and E), and MECs tube area remained at a similar level as HD-CAC + MECs (52%). A rat IgG2a isotype control was used to account for any off-target effects and this had no significant effect on HD-CACs + MEC co-cultures (see Supplementary material online, Figure S6). These data reveal that specifically the N-terminus of PTX3, mediates HD-CACs + MECs impairment of endothelial tube forming capacity.
Figure 4.
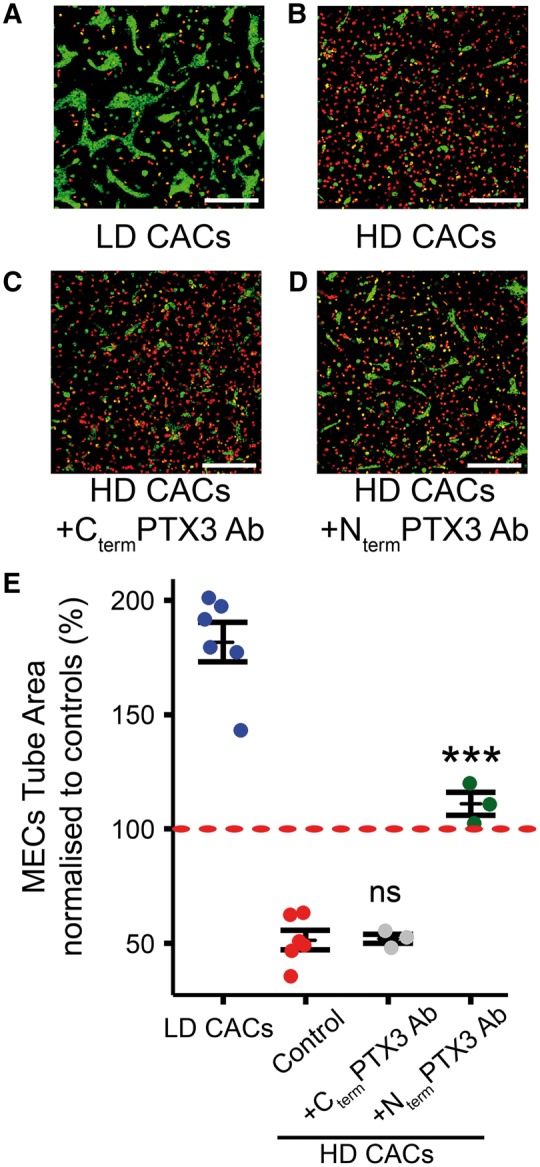
PTX3 mediates HD-CACs anti-angiogenic effects on MECs. (A) Representative image for 3D Matrigel tubulogenesis model showing LD CACs in red and MECs in green. (B) Representative image showing HD CACs in red inhibited MECs tubule formation. (C and D) PTX3 antibodies targeting the C-terminus (Cterm) and the N-terminus (Nterm) were added to the co-culture system. Scale bars 300 μm. (E) Quantification of MEC tube area after normalizing to MEC control (red dashed line at 100%) (Data visualized as stripcharts n = 3–6; one-way ANOVA; ***P < 0.001; ns, not significant).
3.6 Endothelium-derived PTX3 is sufficient and necessary for HD-CACs induced inhibition of MEC tube formation
As PTX3 was identified only in our HD co-culture system which contained both HD-CACs and MECs, we investigated which of these two cell types was the main source of PTX3. Analysis of conditioned media collected from CACs and MECs by ELISA, confirmed that both these cells release PTX3 under basal conditions although MECs released significantly greater levels of PTX3 than CACs (see Supplementary material online, Figure S7). Real-time quantitative PCR (RT-qPCR) of RNA harvested from human CAC and bovine MEC co-cultures using human or bovine specific primers for PTX3 revealed high expression of PTX3 in the HD-CACs + MECs group with bovine-specific primers and not with human-specific primers (Figure 5A). These data visualized in a heatmap suggested that PTX3 was primarily being released by MECs and not CACs (Figure 5A). Western blot analysis in human cells also confirmed that human ECFCs express higher levels of PTX3 than human CACs (Figure 5B). This was evident in four different biological replicates. To further corroborate the finding that endothelial cells were the primary source of PTX3 in our HD-CAC + MECs co-culture and to explore the functional significance of endothelial-derived PTX3 in our system, PTX3 expression was knocked-down in ECFCs using siRNA technology. ECFCs transfected with PTX3 siRNA showed a significant decrease in PTX3 mRNA expression when compared to scrambled siRNA-transfected ECFCs (Figure 5C). Additionally, PTX3 knockdown in ECFCs was also confirmed at the protein level by western blot (Figure 5D). These PTX3 siRNA-transfected ECFCs and the corresponding scrambled siRNA-transfected controls where co-cultured with HD-CACs (Figure 5E). In agreement with the earlier results, HD-CACs led to a significant reduction in endothelial tubule area in scrambled siRNA-transfected control ECFCs (P < 0.001), however this inhibition of endothelial tube forming capacity was significantly abrogated when PTX3 was knocked-down in endothelial cells (P < 0.001) (Figure 5F). These results confirmed that endothelial cells, in the presence of HD-CACs, are the primary source of PTX3 which inhibits vascular tubule formation.
Figure 5.

PTX3 produced by endothelial cells in response to HD-CACs acts in an autocrine anti-angiogenic manner. (A) PTX3 expression analysis using qRT-PCR and bovine or human-specific primers, visualized in a heatmap for three biological replicates. (B) Protein expression analysis in human cell lysates from CACs and ECFCs for four biological replicates. (C) RT-qPCR to evaluate PTX3-siRNA knockdown efficiency (n = 9, one-way ANOVA, ***P < 0.001). (D) Western blot to assess level of PTX3-siRNA knockdown in ECFCs. (E) Representative images of in vitro 3D Matrigel-based tube formation assay showing CACs in red and ECFCs in green. Scale bars 300 μm (F) Quantification and statistical analysis of ECFC tube areas (n = 9, one-way ANOVA, data visualized as a stripchart, ***P < 0.001 vs. control siRNA-ECFCs, ###P < 0.001 vs. control siRNA-ECFCs + HD-CACs).
3.7 The FGF pathway is targeted by endothelium-derived PTX3
It has previously been reported that the N-terminus of PTX3 binds to FGF2 and inhibits its pro-angiogenic activity.15 To investigate if this mechanism was responsible for the observed PTX3 effects, we performed clonogenic assays using ECFCs in a modified cell culture media with low serum and containing FGF2 as the only added angiogenic factor. Human recombinant FGF2 stimulated colony formation and growth in ECFCs (Figure 6A and B), and addition of PTX3 to FGF2-treated ECFCs significantly inhibited the FGF2 positive effect on endothelial proliferation (P < 0.001) (Figure 6A and B). We also examined the role of PTX3 in FGF2-induced angiogenesis using the in vitro 3D Matrigel tubulogenesis assay. ECFCs labelled green with calcein were cultured in Matrigel in the presence or absence of FGF2 and PTX3 (Figure 6C). After 48 h, ECFCs formed a vascular tube network (Figure 6C) and following FGF2 addition there was a significant enhancement of ECFC tubulogenesis (P < 0.01) (Figure 6D). When PTX3 was added to this culture system, FGF2 promotion of tube formation was inhibited (P < 0.001) and led to a further significant decrease in ECFC tube formation below control levels (Figure 6C and D). To gain further insight into this PTX3/FGF2 interaction, we used TNF-stimulated gene 6 protein (TSG6), a ligand for PTX3. Both TSG6 and FGF2 bind to PTX3 with similar affinities. Interestingly, when TSG6 was added to medium in the presence of PTX3 and FGF2, it significantly reversed the inhibitory effect of PTX3, and restored ECFC tubule formation to control levels (P < 0.01) (Figure 6C and D). These data demonstrate that PTX3 exerts an anti-angiogenic effect on endothelial cells by targeting FGF2 signalling.
Figure 6.

PTX3 impairs FGF2-mediated endothelial cell function. (A) Representative images from clonogenic assay. ECFC colonies were stained with crystal violet. Scale bars 250 μm. (B) Quantification and statistical analysis of FGF2 and PTX3 effects on ECFC clonogenic potential quantified as the percentage (%) of total surface area covered by crystal violet staining (n = 9, one-way ANOVA, data visualized as a stripchart, ***P < 0.001 vs. control, ###P < 0.001 vs. FGF). (C) Representative images for 3D Matrigel in vitro model showing tubule formation by ECFCs in green. FGF2 (5 ng/mL), human recombinant PTX3 (500 ng/mL) and TSG6 (1 µg/mL). Scale bars 200 μm. (D) Quantification of tube areas (n = 8–10, one-way ANOVA, data visualized as a stripchart, **P < 0.01 vs. control, ###P < 0.001 vs. FGF, $$P < 0.01 vs. FGF + PTX3).
3.8 Inflammatory cytokines elevated in HD-CAC + MEC co-cultures trigger PTX3 upregulation in endothelial cells
To elucidate the molecular mechanisms driving PTX3 upregulation and release in our HD-CAC + MEC experimental model, we examined the inflammatory cytokine profiles in CACs at different cellular densities. RT-qPCR analysis of RNA harvested from CAC + MEC co-cultures revealed a significant increase in expression of inflammatory cytokines IL1β (Figure 7A) and TNFα (Figure 7B) in HD-CAC + MEC co-culture. Notably, MEC cultures under basal conditions showed no detectable expression of IL1β and TNFα (Figure 7A and B). We then examined whether stimulation of endothelial cells with IL1β and TNFα would increase PTX3 expression. ECFCs were treated with 20 ng/mL IL1β or 40 ng/mL TNFα, and protein was harvested after 5 h exposure. LPS (500 ng/mL) was used as a classical pro-inflammatory positive control stimulant. It was observed that ECFCs stimulated with inflammatory cytokines IL1β, TNFα, and LPS expressed significantly higher levels of PTX3 protein when compared to non-stimulated cells (Figure 7C). PTX3 upregulation as a response of CAC-exposure to IL1β was consistent among three different biological replicates (see Supplementary material online, Figure S8). According to our data, we propose a mechanism whereby HD of CACs causes an increase in the expression of inflammatory cytokines IL1β and TNFα which induces endothelial expression and release of PTX3 that ultimately acts in an autocrine manner by inhibiting the FGF2 pathway and impairing endothelial cell function (Figure 7D).
Figure 7.

CACs at high-cellular density induce upregulation of IL1β and TNFα which increase PTX3 expression in endothelial cells. (A) Evaluation of IL1β expression by qRT-PCR in co-cultures. ND, not detectable (n = 6, one way-ANOVA). (B) TNFα expression assessed by qRT-PCR. ND, not detectable (n = 3, one-way ANOVA). Data expressed as mean ± SEM. ***P < 0.001 vs. LD-CACs + MECs, ###P < 0.001 vs. MD-CACs + MECs, **P < 0.01 vs. LD-CACs + MECs, and #P < 0.05 vs. MD-CACs + MECs. (C) Western blot for PTX3 expression in ECFCs treated for 5 h with 20 ng/mL IL1β, or 40 ng/mL TNFα, or 500 ng/mL LPS. (D) Schematic diagram for proposed mechanistic model: HD-CACs upregulate expression of inflammatory cytokines IL1β and TNFα, which induces endothelial expression and release of PTX3 that ultimately impairs FGF2-induced angiogenesis.
4. Discussion
The major finding of this study was the consistent switch in CACs angiogenic potential from being facilitators to inhibitors at different cellular densities. This is of critical clinical relevance when considering CACs or comparable cell-types for use in cellular therapies. Although previous work from our group and others has demonstrated CACs exert pro-angiogenic effects through the secretion of proangiogenic growth factors and cytokines, the current investigation is the first to highlight that a HD of CACs significantly inhibits vascular repair. Although dose-escalation methods are essential components of clinical trials to ensure safety, it is evident that marked variability exists between studies. In the case of ischaemic heart disease, numbers of CD34+/MNCs administered via intracoronary infusion varies from 4.3 × 10⁶ cells per patient16 to numbers as high as 3.4 ± 1.2 × 10⁹ per patient.17 This 103-fold difference underscores the need to understand the biology associated with changes in cellular densities used for cell therapies.
Since CACs exert their effects through paracrine mechanisms, it is assumed that a larger number of cells will be associated with enhanced therapeutic benefit. Our data strongly rebut this idea and demonstrate that high-cellular densities of CACs trigger anti-angiogenic responses. A recent cell therapy clinical trial testing cells with considerable similarity to CACs for pulmonary arterial hypertension used escalating doses from 7 × 10⁶ to 50 × 106 cells. Although this cell therapy was reported as well-tolerated, there was one serious adverse event which resulted in the death of a patient treated with 23 × 106 cells and there was a suggested ‘possible’ link to cell treatment.6 This underscores the importance and clinical relevance of our research data indicating that CACs phenotype and functionality is greatly impacted by their cellular density. A limitation in the mouse OIR model was the maximum feasible cell therapy dose of 1 µL containing at most 100 000 cells which did not allow the testing of HDs used in the murine Matrigel plug angiogenesis assay and the in vitro experiments. As an alternative approach, the protein produced by HD CACs, PTX3, was delivered intravitreally and shown to impair vascular repair in the OIR model.
Isolation of CACs by culturing MNCs in endothelial growth medium for ≥1 week clearly drives the cell phenotype into a highly enriched myeloid cell population with M2 macrophage characteristics. Our data support earlier observations indicating that CACs offer a more homogenous cell choice than the use of unselected MNCs for clinical applications.18 Indeed, trials testing the clinical potential of CAC-like cells such as TOPCARE AMI,7 the autologous ‘EPC’ trial for AMI and IPAH,19 and PHACeT6 have already shown feasibility, safety and some beneficial outcomes. Safety concerns have been raised with the use of unfractionated BM cells because it was reported that they induced significant intramyocardial calcification.20 Furthermore, results from some recent clinical trials testing various BM populations have been in disagreement with earlier positive results and showed no therapeutic benefit.21 This discrepancy indicates that there is a need for better characterized and more homogeneous cell populations.
Identification of PTX3 as the key soluble factor driving angiogenic inhibition in the HD-CACs is in agreement with previous reports demonstrating that PTX3 acts as an antagonist to FGF signalling by binding with high affinity to FGF2 and preventing its binding to the tyrosine kinase receptors FGFR1 and FGFR2.22 The blocking of FGF2 signalling by PTX3 results in inhibition of endothelial cell proliferation and in vivo vascularization in a murine Matrigel subcutaneous implant assay and a chick embryo model.23 In addition, PTX3 overexpression has also been shown to inhibit FGF8-induced neovascularization.24
It is the N-terminus of PTX3 which has previously been shown to bind specifically and with high affinity to FGF2 and FGF8b but not FGF1 or FGF4.14,15 Our data support this because blocking specifically the N-terminus of PTX3 abrogates the anti-angiogenic effects of HD-CAC + MECs. We further demonstrate that the anti-angiogenic effects of PTX3 are mediated through the N-terminus of PTX3 (FGF binding site) by the use of TSG6, a protein that competes for PTX3 binding with FGF2. TSG6 reversed the inhibitory effect of PTX3 on FGF2-related endothelial function.
Another key finding was that, rather than CACs, endothelial cells were the major source of PTX3 in HD-CAC + MEC co-cultures. This was not unexpected because PTX3 was first identified over two decades ago as an IL1β-inducible gene in human umbilical vein endothelial cells (HUVECs).25 Since then, PTX3 has been shown to be expressed in various endothelial beds upon exposure to inflammatory stimuli such as IL1β and TNFα. A link between vascular inflammation and PTX3 expression has been shown in diseases such as atherosclerosis26 and small cell vasculitis.27 We are uncertain of the specific role for basal levels of PTX3 in ECFCs, although it is recognized that PTX3 is expressed in healthy individuals at low levels (2 ng/mL) but its serum levels increased up to 100-fold following myocardial infarction. Therefore, PTX3 has been suggested as an early diagnosis and prognosis biomarker in cardiovascular disease.28,29
The species differences between CACs (human origin) and MECs (bovine origin) in our experimental model have allowed us to unequivocally determine the cellular source of PTX3. Bovine PTX3 has 81.9% sequence homology with human PTX3 and previously it was demonstrated that human PTX3 has functional effects on bovine aortic endothelial GM 7373 cells14 and in the murine vasculature.30 In agreement with this, our data showed that recombinant human PTX3 inhibited endothelial tube formation in both bovine and human cells.
In conclusion, our findings reveal that CACs represent a highly enriched population of cells and thus constitute a more-defined population for cell therapy than BM-MNCs. However, considering the myeloid nature of CACs, we highlight the need for optimal cell numbers of CACs to be carefully considered in clinical trials because we demonstrated that the use of high cell numbers has a negative impact on reparative angiogenesis. We propose a mechanistic model where CACs (and similar myeloid cells) at high-cellular densities produce a pro-inflammatory secretome which inflames endothelium that releases PTX3 with consequent autocrine inhibition of FGF2-induced vascular repair.
Supplementary material
Supplementary material is available at Cardiovascular Research online.
Acknowledgements
We thank Lynsey-Dawn Allen for support and assistance, and Dr Gerry Mahon and James Bojdo for technical advice and help with histological preparations.
Conflict of interest: none declared.
Funding
This work was supported by Juvenile Diabetes Research Foundation, Fight for Sight UK, the Sir Jules Thorn Trust, and Cluster Alisei (MEDINTECH CTN01_00177_962865).
References
- 1.de Jong R, Houtgraaf JH, Samiei S, Boersma E, Duckers HJ. Intracoronary stem cell infusion after acute myocardial infarction: a meta-analysis and update on clinical trials. Circ Cardiovasc Interv 2014;7:156–167. [DOI] [PubMed] [Google Scholar]
- 2.Fadini GP, Agostini C, Avogaro A. Autologous stem cell therapy for peripheral arterial disease meta-analysis and systematic review of the literature. Atherosclerosis 2010;209:10–17. [DOI] [PubMed] [Google Scholar]
- 3.Medina RJ, O'Neill CL, Sweeney M, Guduric-Fuchs J, Gardiner TA, Simpson DA, Stitt AW. Molecular analysis of endothelial progenitor cell (EPC) subtypes reveals two distinct cell populations with different identities. BMC Med Genomics 2010;3:18. [DOI] [PMC free article] [PubMed] [Google Scholar]
- 4.Medina RJ, O'Neill CL, O'Doherty TM, Knott H, Guduric-Fuchs J, Gardiner TA, Stitt AW. Myeloid angiogenic cells act as alternative M2 macrophages and modulate angiogenesis through interleukin-8. Mol Med 2011;17:1045–1055. [DOI] [PMC free article] [PubMed] [Google Scholar]
- 5.Taljaard M, Ward MR, Kutryk MJ, Courtman DW, Camack NJ, Goodman SG, Parker TG, Dick AJ, Galipeau J, Stewart DJ. Rationale and design of Enhanced Angiogenic Cell Therapy in Acute Myocardial Infarction (ENACT-AMI): the first randomized placebo-controlled trial of enhanced progenitor cell therapy for acute myocardial infarction. Am Heart J 2010;159:354–360. [DOI] [PubMed] [Google Scholar]
- 6.Granton J, Langleben D, Kutryk MB, Camack N, Galipeau J, Courtman DW, Stewart DJ. Endothelial NO-synthase gene-enhanced progenitor cell therapy for pulmonary arterial hypertension: the PHACeT trial. Circ Res 2015;117:645–654. [DOI] [PubMed] [Google Scholar]
- 7.Leistner DM, Fischer-Rasokat U, Honold J, Seeger FH, Schachinger V, Lehmann R, Martin H, Burck I, Urbich C, Dimmeler S, Zeiher AM, Assmus B. Transplantation of progenitor cells and regeneration enhancement in acute myocardial infarction (TOPCARE-AMI): final 5-year results suggest long-term safety and efficacy. Clin Res Cardiol 2011;100:925–934. [DOI] [PubMed] [Google Scholar]
- 8.Wollert KC, Meyer GP, Lotz J, Ringes-Lichtenberg S, Lippolt P, Breidenbach C, Fichtner S, Korte T, Hornig B, Messinger D, Arseniev L, Hertenstein B, Ganser A, Drexler H. Intracoronary autologous bone-marrow cell transfer after myocardial infarction: the BOOST randomised controlled clinical trial. Lancet 2004;364:141–148. [DOI] [PubMed] [Google Scholar]
- 9.Mills JS, Rao SV. REPAIR-AMI: stem cells for acute myocardial infarction. Future Cardiol 2007;3:137–140. [DOI] [PubMed] [Google Scholar]
- 10.Janssens S, Dubois C, Bogaert J, Theunissen K, Deroose C, Desmet W, Kalantzi M, Herbots L, Sinnaeve P, Dens J, Maertens J, Rademakers F, Dymarkowski S, Gheysens O, Van Cleemput J, Bormans G, Nuyts J, Belmans A, Mortelmans L, Boogaerts M, Van de Werf F. Autologous bone marrow-derived stem-cell transfer in patients with ST-segment elevation myocardial infarction: double-blind, randomised controlled trial. Lancet 2006;367:113–121. [DOI] [PubMed] [Google Scholar]
- 11.Lunde K, Solheim S, Aakhus S, Arnesen H, Abdelnoor M, Egeland T, Endresen K, Ilebekk A, Mangschau A, Fjeld JG, Smith HJ, Taraldsrud E, Grogaard HK, Bjornerheim R, Brekke M, Muller C, Hopp E, Ragnarsson A, Brinchmann JE, Forfang K. Intracoronary injection of mononuclear bone marrow cells in acute myocardial infarction. N Engl J Med 2006;355:1199–1209. [DOI] [PubMed] [Google Scholar]
- 12.Winkler T, von Roth P, Matziolis G, Mehta M, Perka C, Duda GN. Dose-response relationship of mesenchymal stem cell transplantation and functional regeneration after severe skeletal muscle injury in rats. Tissue Eng Part A 2009;15:487–492. [DOI] [PubMed] [Google Scholar]
- 13.Bottazzi B, Garlanda C, Salvatori G, Jeannin P, Manfredi A, Mantovani A. Pentraxins as a key component of innate immunity. Curr Opin Immunol 2006;18:10–15. [DOI] [PubMed] [Google Scholar]
- 14.Rusnati M, Camozzi M, Moroni E, Bottazzi B, Peri G, Indraccolo S, Amadori A, Mantovani A, Presta M. Selective recognition of fibroblast growth factor-2 by the long pentraxin PTX3 inhibits angiogenesis. Blood 2004;104:92–99. [DOI] [PubMed] [Google Scholar]
- 15.Camozzi M, Rusnati M, Bugatti A, Bottazzi B, Mantovani A, Bastone A, Inforzato A, Vincenti S, Bracci L, Mastroianni D, Presta M. Identification of an antiangiogenic FGF2-binding site in the N terminus of the soluble pattern recognition receptor PTX3. J Biol Chem 2006;281:22605–22613. [DOI] [PubMed] [Google Scholar]
- 16.Musialek P, Tekieli L, Kostkiewicz M, Miszalski-Jamka T, Klimeczek P, Mazur W, Szot W, Majka M, Banys RP, Jarocha D, Walter Z, Krupinski M, Pieniazek P, Olszowska M, Zmudka K, Pasowicz M, Kereiakes DJ, Tracz W, Podolec P, Wojakowski W. Infarct size determines myocardial uptake of CD34+ cells in the peri-infarct zone: results from a study of (99m)Tc-extametazime-labeled cell visualization integrated with cardiac magnetic resonance infarct imaging. Circ Cardiovasc Imaging 2013;6:320–328. [DOI] [PubMed] [Google Scholar]
- 17.Yaoita H, Takase S, Maruyama Y, Sato Y, Satokawa H, Hoshi N, Ono N, Igari T, Ohto H, Yokoyama H. Scintigraphic assessment of the effects of bone marrow-derived mononuclear cell transplantation combined with off-pump coronary artery bypass surgery in patients with ischemic heart disease. J Nucl Med 2005;46:1610–1617. [PubMed] [Google Scholar]
- 18.Sekiguchi H, Ii M, Losordo DW. The relative potency and safety of endothelial progenitor cells and unselected mononuclear cells for recovery from myocardial infarction and ischemia. J Cell Physiol 2009;219:235–242. [DOI] [PubMed] [Google Scholar]
- 19.Wang XX, Zhang FR, Shang YP, Zhu JH, Xie XD, Tao QM, Zhu JH, Chen JZ. Transplantation of autologous endothelial progenitor cells may be beneficial in patients with idiopathic pulmonary arterial hypertension: a pilot randomized controlled trial. J Am Coll Cardiol 2007;49:1566–1571. [DOI] [PubMed] [Google Scholar]
- 20.Yoon YS, Park JS, Tkebuchava T, Luedeman C, Losordo DW. Unexpected severe calcification after transplantation of bone marrow cells in acute myocardial infarction. Circulation 2004;109:3154–3157. [DOI] [PubMed] [Google Scholar]
- 21.Robbers LF, Nijveldt R, Beek AM, Hirsch A, van der Laan AM, Delewi R, van der Vleuten PA, Tio RA, Tijssen JG, Hofman MB, Piek JJ, Zijlstra F, van Rossum AC, Investigators H. Cell therapy in reperfused acute myocardial infarction does not improve the recovery of perfusion in the infarcted myocardium: a cardiac MR imaging study. Radiology 2014;272:113–122. [DOI] [PubMed] [Google Scholar]
- 22.Leali D, Bianchi R, Bugatti A, Nicoli S, Mitola S, Ragona L, Tomaselli S, Gallo G, Catello S, Rivieccio V, Zetta L, Presta M. Fibroblast growth factor 2-antagonist activity of a long-pentraxin 3-derived anti-angiogenic pentapeptide. J Cell Mol Med 2010;14:2109–2121. [DOI] [PMC free article] [PubMed] [Google Scholar]
- 23.Leali D, Inforzato A, Ronca R, Bianchi R, Belleri M, Coltrini D, Di Salle E, Sironi M, Norata GD, Bottazzi B, Garlanda C, Day AJ, Presta M. Long pentraxin 3/tumor necrosis factor-stimulated gene-6 interaction: a biological rheostat for fibroblast growth factor 2-mediated angiogenesis. Arterioscler Thromb Vasc Biol 2012;32:696–703. [DOI] [PMC free article] [PubMed] [Google Scholar]
- 24.Leali D, Alessi P, Coltrini D, Ronca R, Corsini M, Nardo G, Indraccolo S, Presta M. Long pentraxin-3 inhibits FGF8b-dependent angiogenesis and growth of steroid hormone-regulated tumors. Mol Cancer Ther 2011;10:1600–1610. [DOI] [PubMed] [Google Scholar]
- 25.Introna M, Breviario F, d'Aniello EM, Golay J, Dejana E, Mantovani A. IL-1 inducible genes in human umbilical vein endothelial cells. Eur Heart J 1993;14 Suppl K:78–81. [PubMed] [Google Scholar]
- 26.Peri G, Introna M, Corradi D, Iacuitti G, Signorini S, Avanzini F, Pizzetti F, Maggioni AP, Moccetti T, Metra M, Cas LD, Ghezzi P, Sipe JD, Re G, Olivetti G, Mantovani A, Latini R. PTX3, A prototypical long pentraxin, is an early indicator of acute myocardial infarction in humans. Circulation 2000;102:636–641. [DOI] [PubMed] [Google Scholar]
- 27.Fazzini F, Peri G, Doni A, Dell'Antonio G, Dal Cin E, Bozzolo E, D'Auria F, Praderio L, Ciboddo G, Sabbadini MG, Manfredi AA, Mantovani A, Querini PR. PTX3 in small-vessel vasculitides: an independent indicator of disease activity produced at sites of inflammation. Arthritis Rheum 2001;44:2841–2850. [DOI] [PubMed] [Google Scholar]
- 28.Suzuki S, Takeishi Y, Niizeki T, Koyama Y, Kitahara T, Sasaki T, Sagara M, Kubota I. Pentraxin 3, a new marker for vascular inflammation, predicts adverse clinical outcomes in patients with heart failure. Am Heart J 2008;155:75–81. [DOI] [PubMed] [Google Scholar]
- 29.Matsubara J, Sugiyama S, Nozaki T, Sugamura K, Konishi M, Ohba K, Matsuzawa Y, Akiyama E, Yamamoto E, Sakamoto K, Nagayoshi Y, Kaikita K, Sumida H, Kim-Mitsuyama S, Ogawa H. Pentraxin 3 is a new inflammatory marker correlated with left ventricular diastolic dysfunction and heart failure with normal ejection fraction. J Am Coll Cardiol 2011;57:861–869. [DOI] [PubMed] [Google Scholar]
- 30.Moalli F, Paroni M, Veliz Rodriguez T, Riva F, Polentarutti N, Bottazzi B, Valentino S, Mantero S, Nebuloni M, Mantovani A, Bragonzi A, Garlanda C. The therapeutic potential of the humoral pattern recognition molecule PTX3 in chronic lung infection caused by Pseudomonas aeruginosa. J Immunol 2011;186:5425–5434. [DOI] [PubMed] [Google Scholar]
Associated Data
This section collects any data citations, data availability statements, or supplementary materials included in this article.