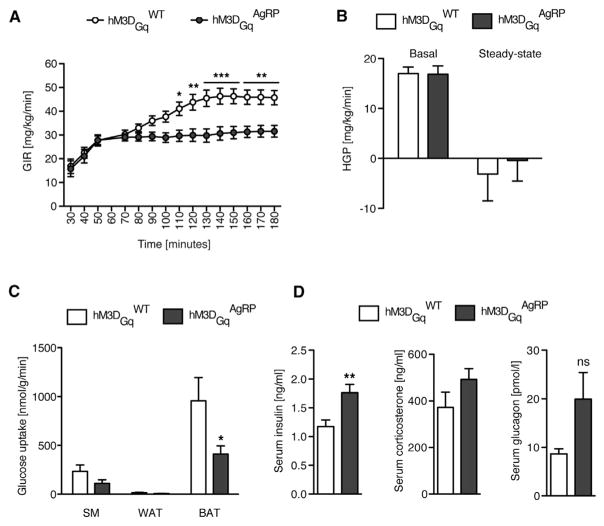
Figure 3. Chemogenetic Activation of AgRP Neurons Inhibits BAT Glucose Uptake.
(A) Glucose infusion rates (GIR) during the eugyclemic-hyperinsulinemic clamp in hM3DGqWT control littermates and hM3DGqAgRP mice (n = 23 versus 20).
(B) Hepatic glucose production (HGP) measured under basal and steady-state conditions during the clamp (n = 23 versus 20).
(C) Tissue-specific insulin-stimulated glucose uptake rates in skeletal muscle (SM), white adipose tissue (WAT), and brown adipose tissue (BAT) (n = 23 versus 18–19).
(D) Serum insulin, corticosterone, and glucagon levels of hM3DGqAgRP and hM3DGqWT 1 hr post CNO administration (n = 10 versus 10). All data are represented as mean ± SEM. *p ≤ 0.05, **p ≤ 0.01, and ***p ≤ 0.001 as determined by two-way ANOVA followed by Bonferroni post hoc test (A), one-tailed unpaired Student’s t test (C), and two-tailed unpaired Student’s t test (D).

