

Abstract
The balance between proinflammatory and regulatory CD4+ T cells is tightly controlled in lymphoid organs. In autoimmune diseases this balance is altered in the periphery and target tissue of patients. However, not much is known about the balance initiated in lymphoid organs during the development of disease. Since systemic autoimmunity is present years before the clinical manifestations of rheumatoid arthritis (RA), it is possible to study the immunoregulatory balance during the earliest (preclinical) phases of disease. Here, we report for the first time the frequency and phenotype of proinflammatory and regulatory CD4+ T cells in lymph node biopsies obtained from autoantibody positive individuals at risk for developing RA, patients with established disease and healthy controls. The frequency of proinflammatory LN Th1 cells was increased in RA patients compared with HCs, while the frequency of regulatory T cells was lower in LN biopsies of RA‐risk individuals. Upon in vitro stimulation LN CD4+ T cells produced lower levels of proinflammatory cytokines, IFN‐γ and IL‐17A, in both RA‐risk individuals and early RA patients. This study shows that already during the earliest phases of systemic autoimmunity the immunoregulatory balance between proinflammatory and regulatory CD4+ T cells is altered in LN tissue.
Keywords: Autoimmunity, Cytokines, Lymph node, Rheumatoid arthritis, T cells, Th1, Th17
Introduction
To prevent autoimmunity, self‐reactive T cells are eliminated by negative selection in the thymus 1. If T cells with a strong affinity for self‐antigens escape, tolerance is maintained by peripheral tolerance mechanisms in lymph nodes, tonsil, or spleen. Peripheral tolerance can occur through different mechanisms like induction of anergy, induction of apoptosis, or suppression through regulatory T cells. If peripheral tolerance is broken, autoimmune disease can occur 1. Accordingly, CD4+ T helper cells play an important role in the pathogenesis of autoimmune disease. Activation and differentiation of different subsets of Th cells is dependent on the type, quantity, and the affinity of the specific antigen 2 and results in differential production of cytokines specific for Th1 (interferon γ), Th2 (interleukin 4, IL‐5, and IL‐13), Th17 cells (IL‐17 and IL‐22), or Tregs (IL‐10) 3. The balance between regulatory and proinflammatory Th cells has important implications for disease pathogenesis, which can be exploited in therapeutic strategies 3, 4. A switch from regulatory to pathogenic Th cell differentiation may initiate or maintain uncontrolled immune responses. In addition, an altered balance between different Th cell subsets or impaired effector function as a result from an uncontrolled on‐going immune response may drive autoimmunity and chronic inflammation. Although the importance of LNs in ensuring a proper immune response is widely accepted, little is known about the balance between proinflammatory and Tregs in human LN tissue and whether this balance is different in patients suffering from an autoimmune disease compared with healthy individuals.
In rheumatoid arthritis (RA), peripheral tolerance seems to be broken long before the onset of the disease, since systemic autoimmunity precedes signs and symptoms of RA 5, 6, 7. This preclinical phase of systemic autoimmunity is characterized by the presence of anticitrullinated protein antibodies (ACPAs) and/or IgM rheumatoid factor (IgM‐RF) 8. However, the presence of autoantibodies by itself is not the key determinant for disease development since not all autoantibody positive individuals develop disease. Accordingly, other unidentified factors are involved in driving the disease process. We can use these individuals characterized by having systemic autoimmunity but no arthritis, as a model to study the earliest phases of systemic autoimmunity 9. Such individuals have recently been defined as being RA‐risk individuals as recommended by the Study Group for Risk Factors for RA under the auspices of the European League Against Rheumatism Standing Committee of Investigative Rheumatology 9.
Animal models have demonstrated that the onset of arthritis is preceded by phenotypic changes in lymphocytes in LNs 10, 11, 12. Most of the T‐cell studies in RA have focused on the role of CD4+ Th cells during established disease by studying inflamed joints and peripheral blood cells 13, 14, 15. However, not much is known about initial T‐cell activation, phenotype, and function in LNs during the RA‐risk and earliest phases of disease. Earlier research from our group showed that the frequencies of total LN CD4+ T cells are not different between healthy controls (HCs), RA‐risk individuals, and early RA patients 16. However, the phenotype and function of LN CD4+ T cells was not studied in that first explorative study. We hypothesize that early during the development of autoimmune disease, as a result of prolonged antigen exposure and loss of tolerance, the balance between proinflammatory and regulatory CD4+ T‐cell subsets changes. We propose that this T‐cell balance is already altered during the at‐risk phase of RA and could be critical for the subsequent progression or inhibition of disease. To examine this, we performed an extensive immunophenotyping of different Th cell subsets in LN tissue and peripheral blood samples obtained from RA‐risk individuals, early RA patients, and HCs.
Results
The frequency of CD4+CD45RO+ memory T cells is increased in LN tissue of early RA patients
The frequency of CD45RO+ (memory CD4+ T cells), CD45RA+ (naïve and late effector CD4+ T cells), and CD69+ (activated or tissue resident CD4+ T cells) cells in peripheral blood and LN cells were analyzed using flow cytometry (Fig. 1A). Total CD4+ T‐cell frequencies were on average comparable between HCs, RA‐risk individuals, and early RA patients in both peripheral blood (Fig. 1B) and LN tissue (Fig. 1C). In peripheral blood, the frequencies of CD4+CD45RO+ and CD4+CD45RA+ T cells were on average comparable between the different study groups. In LN tissue we found an increased frequency of CD4+CD45RO+ T cells in early RA patients compared with HCs (p = 0.03), which was accompanied by a decreased frequency of CD4+CD45RA+ T cells (p = 0.02; Fig. 1C). As expected 17, the frequency of CD4+CD45RO+ T cells in LN tissue correlated with age. However, this was only seen in HCs (p = 0.004, r = 0.88) and not in RA‐risk individuals and early RA patients. In peripheral blood, we found an increase in CD4+CD69+ T cells in RA‐risk individuals compared with HCs (p = 0.001). In LN tissue, we found no significant differences in CD4+CD69+ T cells between the different study groups.
Figure 1.
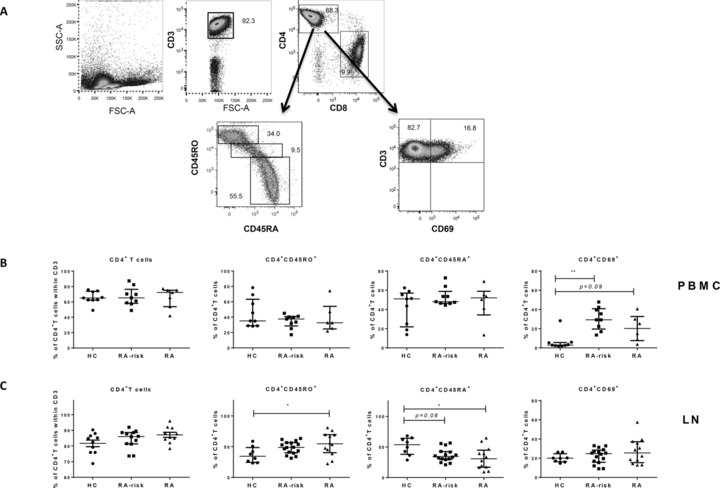
Phenotype of CD4+ T cells in LN tissue and peripheral blood. Cells isolated from LN tissue or thawed peripheral blood‐derived cells (PBMCs) were stained with extracellular cell markers and analyzed by flow cytometry. Gating strategy for CD4+ T‐cells positive for CD45RO, CD45RA, or CD69 is shown for LN cells (A). Dot plots are representative of 34 independent experiments using one freshly collected LN biopsy per experiment. This strategy is similar for PBMCs. Frequencies of PBMCs (B) and LN (C) total CD4+ T cells within the CD3+ T cells and subsets within the CD4+ T cells (CD4+CD45RO+, CD4+CD45RA+, and CD4+CD69+ T cells) were analyzed for HCs (LN n = 8–10, PBMCs n = 9), RA‐risk individuals (RA‐risk; LN n = 12–16, PBMCs n = 9), and early RA patients (RA; LN n = 10–12, PBMCs n = 6–7). Variability in number of subjects included was depending on quality assessments of samples and subsequent analysis. Data are presented as median with interquartile range and are pooled from 34 independent experiments using one freshly isolated LN biopsy and eight PBMCs experiments using three to four PBMCs donors per experiment (PBMC n = 25). For statistical analysis, Kruskall–Wallis or one‐way ANOVA (when appropriate) was performed and significant differences were indicated as *p < 0.05 or **p < 0.01. All symbols represent data from single individuals (•: HCs; ▄: RA‐risk individuals [RA‐risk]; Δ: early RA patients [RA]).
The frequency of CXCR3+CCR6−CCR4− CD4+ T cells is increased in LNs of early RA patients
Next, different CD4+ Th cells were analyzed based on their chemokine receptor expression profile as reported previously in peripheral blood 18 and LN samples 19 (Fig. 2A). In peripheral blood samples we could not measure the expression of chemokine receptors since these samples were stored in liquid nitrogen before use, which has been reported to alter expression of chemokine receptors (data not shown) 20. We found that in LN tissue the frequency of CXCR3+CCR6−CCR4− (Th1 profile) cells was higher in early RA patients (p = 0.009) compared with HCs (Fig. 2B) and a nonsignificant increase was observed in RA‐risk individuals (p = 0.06). The difficulty in reaching statistical significance is due to a large donor variability, which is expected in the RA‐risk group since not all individuals will develop disease and individuals may be in different at‐risk stages. The frequencies of CXCR3−CCR6−CCR4+ (Th2 profile), CXCR3−CCR6+CCR4+ (Th17 profile), and CXCR3+CCR6+CCR4− (Th1Th17 profile) cells were on average comparable. We analyzed the expression of CCR7 on LN CD4+ T cells as a marker for LN retention (Fig. 2C). The frequency of total CD4+CCR7+ T cells in LN tissue was lower in early RA patients compared with RA‐risk individuals (p = 0.006; Fig. 2D) and the same trend (p = 0.09) was observed when compared with HCs. Expression of CCR7 on CD4+ T cells based on geometric MFI (gMFI) was on average comparable between the different study groups.
Figure 2.
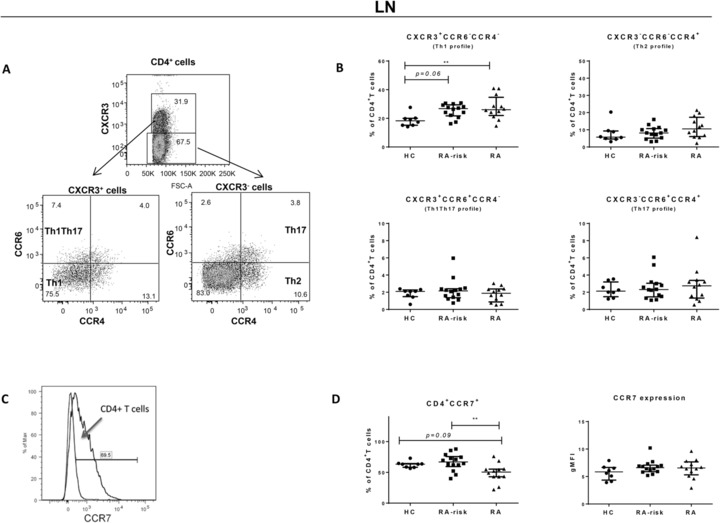
Analysis of different Th cells in LN tissue based on chemokine receptor surface expression. Cells isolated from LN biopsies were analyzed for the frequencies of different Th cells based on chemokine receptor expression. Freshly isolated LN cells were washed and stained with extracellular T‐cell markers and chemokine receptors. Gating strategy is shown on the left (A). Dot plots are representative of 34 independent experiments using one freshly collected LN biopsy per experiment. Frequencies of LN CXCR3+CCR4−CCR6− (Th1 profile) CD4+ T cells, CXCR3−CCR4+CCR6− (Th2 profile) CD4+ T cells, CXCR3−CCR4+CCR6+ (Th17) CD4+ T cells, and CXCR3+CCR4−CCR6+ (Th1/Th17 profile) CD4+ T cells in the total CD4+ T‐cell population were analyzed in HC (n = 8), RA‐risk (n = 14), and RA patients (n = 12) (B). The frequency of CD4+CCR7+ cells and expression level of CCR7 on CD4+ T cells based on gMFI (shown in histogram) is analyzed in HC (n = 8), RA‐risk (n = 14), and RA patients (n = 12) (C and D). Data are presented as median with interquartile range and are representative of 34 independent experiments using one freshly collected LN biopsy. For statistical analysis, Kruskall–Wallis or one‐way ANOVA (when appropriate) was performed and significant differences were indicated as **p < 0.01. All symbols represent data from single individuals (•: HCs; ▄: RA‐risk individuals [RA‐risk]; Δ: early RA patients [RA]).
Decreased proinflammatory cytokine production in LN CD4+ T cells in systemic autoimmunity
To study the functional properties of different CD4+ Th cells in LN biopsies and peripheral blood, we investigated their capacity to produce cytokines upon ex vivo stimulation with PMA and ionomycin (Fig. 3). The frequency and gMFI was analyzed for CD4+IFN‐γ+ (Th1 cytokine), CD4+IL‐4+ (Th2 cytokine), CD4+IL‐17A+ (Th17 cytokine), and CD4+IL‐10+ (Treg cytokine) T cells (Fig. 3A). In peripheral blood, the frequency of CD4+IL‐17A+ T cells was increased in early RA patients compared with RA‐risk individuals (p = 0.03) and compared with HCs (p = 0.03; Fig. 3B). The frequency of CD4+IL‐10+ T cells was decreased in peripheral blood of RA‐risk individuals compared with HCs (p = 0.02). The frequencies of CD4+IFN‐γ+ and CD4+IL‐4+ T cells in peripheral blood were on average comparable between the study groups. In peripheral blood, no differences in gMFI were found between the different study groups for all cytokines measured (Fig. 3C). In LN tissue, the frequencies of CD4+IL‐4+ (p = 0.04) and CD4+IL‐10+ (p = 0.01) T cells were decreased in RA‐risk individuals compared with HCs (Fig. 3D). Also in early RA patients there was a nonsignificant decrease in CD4+IL‐10+ T cells in LN tissue compared with HCs (p = 0.08). The lack of reaching a significant difference here is likely because of the low frequency of IL‐10 positive cells and the large donor variability. In LN tissue, the frequencies of CD4+IFN‐γ+ and CD4+IL‐17A+ T cell were on average comparable between the different study groups. Of interest, the relative amount of IFN‐γ and IL‐17A produced per cell (based on the gMFI) was significantly decreased in both RA‐risk individuals (p = 0.002 and p = 0.007) and early RA patients (p = 0.0001 and p = 0.01) compared with HCs (Fig. 3E).
Figure 3.
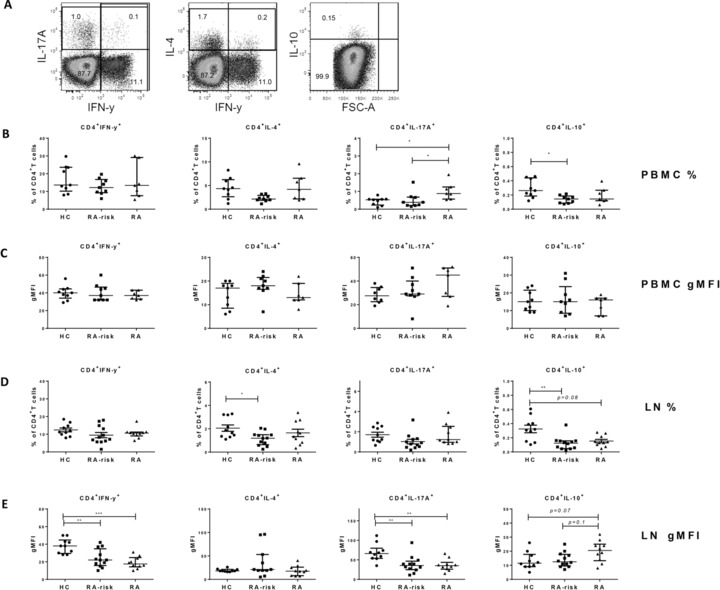
Analysis of cytokine production of CD4+ T cells in peripheral blood and LN tissue. Thawed PBMCs (B and C) and freshly isolated LN (D and E) single cells were incubated with PMA and ionomycin in the presence of Brefeldin A and Golgi Stop, and intracellular cytokine production was determined by flow cytometry. Gating strategy for analyzing cytokine production is shown in (A). Plots are representative for LN cells and similar for PBMCs. Frequencies of CD4+ T cells producing IFN‐γ, IL‐4, IL‐17A, or IL‐10 were analyzed (B and D). Cytokine production per cell was analyzed using the normalized gMFI (C and E). In LN we analyzed HC (n = 10), RA‐risk (n = 12), and RA (n = 9 or 10). In PBMCs we analyzed HC (n = 8 or 9), RA‐risk (n = 9), and RA (n = 7). Variability in number of subjects included was depending on quality assessments of samples and subsequent analysis. All data are presented as median with interquartile range and are pooled from 32 independent experiments using one freshly collected LN biopsy and eight PBMCs experiments using three to four PBMCs donors per experiment (PBMC n = 25). For statistical analysis, Kruskall–Wallis or one‐way ANOVA (when appropriate) was performed and significant differences were indicated as *p < 0.05, **p < 0.01, or ***p < 0.001. All symbols represent data from single individuals (•: HCs; ▄: RA‐risk individuals [RA‐risk], Δ: early RA patients [RA]).
Coproduction of IL‐10 by Th1 and Th17 cells is decreased in LN CD4+ T cells
To investigate the balance between proinflammatory and regulatory cytokine producing cells we analyzed their ratio in both peripheral blood and LN tissue (Fig. 4A). The ratio between IL‐17A producing CD4+ T cells and IL‐10 producing CD4+ T cells (IL‐17A+/IL‐10+ CD4+ T cells) was increased in peripheral blood of early RA patients compared with HCs (p = 0.005), while the ratios of IFN‐γ+/IL‐10+ CD4+ T cells were on average comparable between the different study groups (Fig. 4B). The ratios of IL‐17A+/IL‐10+ and IFN‐γ+/IL‐10+ CD4+ T cells in LN tissue were on average comparable between the different study groups (Fig. 4C).
Figure 4.
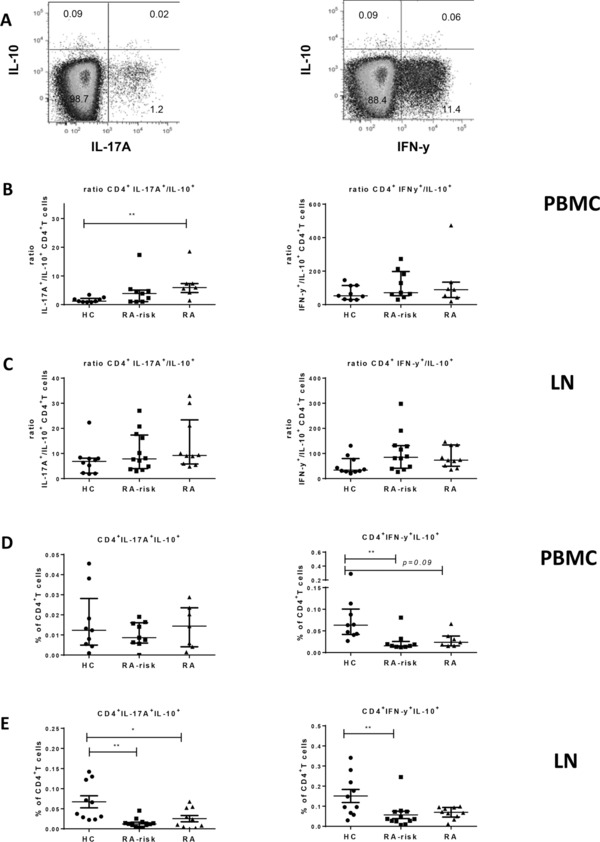
Ratios between pro‐ and anti‐inflammatory cytokine‐producing Th cells and coproduction of Il‐10 by inflammatory T cells. Thawed PBMCs and freshly isolated LN cells after in vitro stimulation with PMA and ionomycin were analyzed by flow cytometry using the gating strategy shown in (A). (B) PBMCs; HC n = 9, RA‐risk n = 9, and RA n = 7. (C) LN; HC n = 10, RA‐risk n = 12, and RA n = 10. The ratios between IL‐17A producing CD4+ T cells and IL‐10 producing CD4+ T cells (IL‐17A+/IL‐10+) and the ratio between IFN‐γ producing CD4+ T cells and IL‐10 producing CD4+ T cells (IFN‐γ+/IL‐10+) from CD4+ T‐cells positive for the combination of two different cytokines (left: IL‐17A+IL‐10+; right: IFN‐γ+IL‐10+) are depicted for PBMCs (D) and LN (E). Data are presented as median with interquartile range and are pooled from 32 independent experiments using one freshly collected LN biopsy and eight PBMCs experiments using three to four PBMCs donors per experiment (PBMC n = 25). For statistical analysis, Kruskall–Wallis or one‐way ANOVA (when appropriate) was performed and significant differences were indicated as *p < 0.05 or **p < 0.01. All symbols represent data from single individuals (•: HCs; ▄: RA‐risk individuals [RA‐risk]; Δ: early RA patients [RA]).
Autoregulation of immune responses can occur through the coproduction of IL‐10 in both Th1 21 and Th17 15 cells resulting in a negative feedback loop dampening effector responses. To investigate if CD4+IL‐17A+ and CD4+IFN‐γ+ T cells can simultaneously produce IL‐10, we analyzed the frequencies of CD4+IL‐17A+IL‐10+ T cells and CD4+IFN‐γ+IL‐10+ T cells after stimulation in both peripheral blood (Fig. 4D) and LN tissue (Fig. 4E). In peripheral blood, the frequencies were very low but on average comparable for CD4+IL‐17A+IL‐10+ T cells between the different study groups. The frequency of CD4+IFN‐γ+IL‐10+ T cells was significantly decreased in peripheral blood of RA‐risk individuals (p = 0.003) and a similar trend (p = 0.09) was observed in early RA patients. In addition, in LN tissue the frequencies of both CD4+IL‐17A+IL‐10+ and CD4+IFN‐γ+IL‐10+ T cells were decreased in RA‐risk individuals (p = 0.003 and p = 0.01) compared with HCs. Frequencies of CD4+IL‐17A+IL‐10+ were also decreased in early RA patients (p = 0.04) compared with HCs. However, we have to carefully interpret these data since the frequency of these cells is very low.
Discussion
The results presented here show that the frequency and functional capacity of different CD4+ Th cell subsets in both peripheral blood and LN tissue are affected already during the earliest phases of systemic autoimmunity, even before clinically apparent arthritis. Although so far none of the RA‐risk individuals developed arthritis, these individuals produce autoantibodies specific for RA and thus display features of systemic autoimmunity and it is expected that 30% will develop RA within 2 years 22. Our data reveal that already in the RA‐risk phase the amount of regulatory Th cytokines is decreased in both LN tissue (IL‐4 and IL‐10) and peripheral blood (IL‐10) while in the established early RA phase there is, next to a decreased regulatory cytokine profile an increase in proinflammatory cytokines (IL‐17A) in peripheral blood. These data clearly indicate a shift in the immunoregulatory balance of CD4+ Th cells already during the earliest phases of systemic autoimmunity even before clinically apparent disease.
This innovative approach of studying LN biopsies allowed us to perform, for the first time, an extensive immunophenotyping of LN CD4+ T cells during the earliest phases of RA. However, due to the small size of the LN needle biopsies we were limited in the number of phenotypic markers and functional assays that we could analyze. Due to the challenging procedure of obtaining LN biopsies especially from seronegative disease‐free HCs, our patient group is older than our control group which is a limitation of the current study. Although CD4+CD45RO+ cells have been described to accumulate with age, this is not the case in the range of 30–60 years 17. As indicated, our data shows correlation with age within the HCs but not in the RA‐risk individuals and early RA patients further suggesting that the increase in CD4+CD45RO+ LN memory T cells in early RA patients is disease related and not age related. CD4+CD45RO+ memory T cells are composed of both central memory T cells (positive for CCR7 and migrating to LNs) and effector memory T cells (negative for CCR7 and circulating to non‐LN sites) 23. We found that the frequency of total CD4+CCR7+ T cells is decreased in LN tissue of early RA patients which may reflect an increased number of CD4+ T cells, negative for CCR7, that can leave the LN and recirculate into the periphery toward sites of inflammation 24.
Based on chemokine receptor expression we found an increase in CXCR3+CCR6−CCR4− (Th1 profile) CD4+ T cells in LN biopsies of early RA patients. However, no increase in IFN‐γ+ producing CD4+ T cells was found, suggesting that these CXCR3+CCR6−CCR4− cells might be non‐IFN‐γ producing CD4+ T cell based on their chemokine receptor expression profile or resting memory T cells. Although earlier studies in both humans and mouse models have suggested a role for Th1 cells in RA 25, more recent studies suggest that Th17 cells are the predominant Th cells driving inflammation in RA 26. Increased levels of IL‐17A have been detected in peripheral blood 27, 28 and synovium of arthritis patients 29, 30. In line with these studies we found an increased frequency of CD4+IL‐17A+ T cells in peripheral blood of early RA patients accompanied by an increased ratio of CD4+IL‐17A+/CD4+IL‐10+. These results are also consistent with another study showing an increased ratio of Th17/Treg cells 27 in peripheral blood of patients with established RA (both active and inactive diseases).
Autoregulation of immune responses can occur through the coproduction of IL‐10 by both Th1 and Th17 15 cells resulting in a negative feedback loop and subsequently dampening the effector responses. This IL‐10 mediated self‐regulation during differentiation of effector T cells is important to maintain tolerance and to control immune responses. It has been reported that CD4+IFN‐γ+IL‐10+ T‐cell frequencies accumulate in synovial tissue and synovial fluid of RA patients compared to their peripheral blood compartment 31, 32. In addition, in an experimental autoimmune encephalomyelitis it was shown that TGF‐β and IL‐6 not only drive the production of IL‐17 but also induce coproduction of Il‐10 which controls the immune response 33. We observed a decrease in double positive cells (CD4+IFN‐γ+IL‐10+ and CD4+IL‐17A+IL‐10+ T cells) in LN tissue of RA‐risk and early RA patients. In autoantibody positive individuals where clinically apparent disease is not yet present, the diminished autoregulation through coproduction of IL‐10 may possibly lead to overactivation of the immune system and development of disease.
Overall, the amount of proinflammatory cytokines (IFN‐γ and IL‐17A) produced by LN CD4+ T cells upon in vitro stimulation, (based on the gMFI) was decreased in both RA‐risk individuals and early RA patients. This reduced production of proinflammatory cytokines in LN Th cells may be a consequence of sustained antigen exposure and activation resulting in an exhausted phenotype of proinflammatory Th cells 34. Indeed, it has been described for synovial tissue 35 and synovial fluid 36 T cells that cytokine production was not increased in patients with established RA compared with early RA patients. Exhaustion has been described in detail for CD8+ T cells while the exact characteristics of exhausted CD4+ T cells have not yet been unraveled completely 37. Exhausted CD4+ T cells may produce lower amounts of effector cytokines like IL‐2 and IFN‐γ while maintaining the capacity to produce IL‐21 38. If IL‐21 production in LN is sustained, this may drive B‐cell differentiation and proliferation and, therefore, induction of autoimmune responses and inflammation may still occur. Furthermore, indicating the importance of LN tissue analyses, we only observe this exhaustion in LN T cells and not in peripheral blood T cells, suggesting that the LN environment influenced their response in vitro. The CD4+ exhausted phenotype can be distinguished from naïve and memory CD4+ T cells by the expression of transcription factors like Helios, Eomes, and Blimp‐1 39. Further characterization of Th cell subsets, based on these transcription factors and additional cytokines like IL‐21, is needed to provide more insight into the possible role of CD4+ T‐cell exhaustion during systemic autoimmunity.
Taken together, these data suggest that systemic autoimmunity without clinically apparent disease is associated with a decrease in regulatory Th cytokines. Longitudinal analyses of the RA‐risk individuals will determine whether skewed differentiation of Th cells toward a proinflammatory or exhausted phenotype with sustained capacity of delivering B‐cell help may subsequently initiate inflammation and disease development. Future studies are needed to identify which environmental or genetic factors contribute to the observed changes in the immunoregulatory balance in LNs during the earliest phases of RA and how these factors may subsequently help to identify new preventive and therapeutic targets. In addition, these data suggest that the success of preventive and therapeutic strategies targeting T‐cell immunity may depend strongly on the phase of the disease.
Materials and methods
Study subjects
We included 19 individuals at risk for developing RA (RA risk), which was defined by the presence of IgM‐RF and/or ACPAs (positive) in subjects with arthralgia but without any evidence of arthritis 9. IgM‐RF was measured using IgM‐RF ELISA (Sanquin, Amsterdam, the Netherlands [upper limit of normal (ULN) 12.5 IU/mL]) until December 2009 and thereafter using IgM‐RF ELISA (Hycor Biomedical, Indianapolis, IN, USA [ULN 49 IU/mL]). ACPA was measured using anti‐CCP2 ELISA CCPlus (Eurodiagnostica, Nijmegen, the Netherlands [ULN 25 kAU/L]). Median follow‐up time was 20.3 months (13.0–29.8 interquartile range) and none of these RA‐risk individuals developed arthritis during this period. We also included 17 early RA patients, based on American College of Rheumatology and European League Against Rheumatism 2010 criteria, naïve for disease‐modifying antirheumatic drugs and biologicals with a disease duration (defined by having an arthritis in any joint) less than 1 year. For comparison, 19 seronegative (RF and ACPA below ULN) healthy volunteers with no inflammatory joint pathologies were included. These HCs were not allowed to have any history of viral infection, autoimmunity, or malignancy and no present or previous use of disease‐modifying antirheumatic drugs, biological, or other experimental drugs. The study was approved by the institutional review board of the Academic Medical Center, and all study subjects gave written informed consent. Demographics of all study subjects are listed in Table 1.
Table 1.
Baseline characteristics of HCs, RA‐risk individuals, and early RA patients
| HC | RA risk | Early arthritis | |
|---|---|---|---|
| n = 19 | n = 19 | n = 17 | |
| Sex, female (%) | 12 (63%) | 17 (89%) | 10 (59%) |
| Age (years; median [IQR]) | 30.0 (26.0–37.5) | 49.0 (46.0–58.5) | 57.0 (47.0–60.0) |
| IgM‐RF positive (n [%]) | 0 (0%) | 9 (47%) | 16 (94%) |
| IgM‐RF level (kU/l; median [IQR]) | 7.5 (1.0–15.0) | 20.0 (5.0–126.5) | 310.0 (152.0–353.0) |
| ACPA positive (n [%]) | 0 (0) | 10 (53) | 15 (88) |
| ACPA level (kAU/l; median [IQR]) | na | 28.0 (5.0–98.0) | 377.0 (81.0–1392.0) |
| IgM‐RF and ACPA both positive (n [%]) | 0 (0) | 0 (0) | 14 (82) |
| ESR (mm/h; median [IQR]) | nd | 8.0 (5.0–12.5) | 15.0 (5.0–32.0) |
| CRP (mg/l; median [IQR]) | 0.7 (0.4–1.7) | 1.9 (0.9–3.1) | 6.3 (4.1–13.9) |
| 68 TJC (n; median [IQR]) | 0 (0) | 1.0 (0.3–5.5) | 12.0 (3.0–17.0) |
| 66 SJC (n; median [IQR]) | 0 (0) | 0 (0) | 7.0 (4.0–10.0) |
Categorical variables: n (%); Continuous variables (data not normally distributed): median (IQR).
CRP: C‐reactive protein; ESR: erythrocyte sedimentation rate; IQR: interquartile range; na: not applicable; nd: not determined; 66 SJC: swollen joint count of 66 joints; 68 TJC: tender joint count of 68 joints.
Sample processing and cell culture
Ultrasound‐guided inguinal LN biopsies were taken and processed as described earlier 40. Briefly, LN biopsies were put through a 70 μm cell strainer (BD Falcon, San Jose, CA, USA) to obtain a single cell suspension. Peripheral blood mononuclear cells were isolated using standard density gradient centrifugation using lymphoprep (Nycomed AS, Oslo, Norway) and stored in liquid nitrogen until further use. Freshly isolated LN cells and thawed PBMCs were incubated in RPMI culture medium (Life Technologies, Thermo Fisher Scientific Inc., Waltham, MA, USA) for 4 h in the presence or absence of PMA and Ionomycin with Brefeldin A (all from Sigma–Aldrich, St. Louis, MO, USA) and Golgi stop (BD Biosciences, San Jose, CA, USA) as previously described 41. After 4 h, cells were washed, stained, and analyzed by flow cytometry.
Antibodies and flow cytometry analysis
Cells were stained for 30 min at 4°C in PBS containing 0.01% NaN3 and 0.5% BSA with directly labeled antibodies against: CXCR3 Alexa fluor488, CCR5 PE, CCR4 PerCP‐Cy5.5, CCR7 PE‐Cy7, CCR6 Alexa647, CD4 APC‐H7, CD3 V500, CD69 PerCP, CD45 V500 (all from BD Biosciences); CD3 FITC (Sanquin); CD4 PE‐Cy7, CD45 RA eFluor450, and CD45RO PE (all from eBioscience Inc., San Diego, CA). For intracellular cytokine staining, we used IL‐10 PE‐Cy7 (BioLegend, San Diego, CA, USA) and the Th1/Th2/Th17 kit from BD Biosciences. For intracellular staining, after cell surface staining, cells were washed and fixed with FACS Cytofix fixation buffer (BD Biosciences). Following permeabilization (FACS Perm/Wash buffer [BD Biosciences]) cells were stained with markers as indicated. Cells were analyzed on a FACS Canto II (BD Biosciences). CS&T beads were run daily and the same machine with dedicated cytometer configuration was used for the measurements of the samples throughout the study with regular control runs to check compensation settings. Data were analyzed using FlowJo software (FlowJo, Ashland, OR, USA).
Data were plotted as frequency of positive cells or as the gMFI for cytokine expression levels. To correct for experimental variation, the gMFI of cells of interest were normalized to the gMFI of the cytokine negative population.
Statistical analysis
Not normally distributed data were presented as median with interquartile range and analyzed using the Kruskall–Wallis test followed by a post hoc Dunn's test. Normally distributed data were analyzed using one‐way analysis of variances followed by a post hoc Bonferroni test. Corrected p‐values after multiple comparisons were calculated. We also calculated Spearman's rho correlations between variables of interest. All statistical analyses were performed using GraphPad Prism Software (version 6, GraphPad Software, Inc. La Jolla, CA, USA). Values of p < 0.05 were considered statistically significant.
Conflict of interest
P.P.T. and D.M.G. are currently employees at GlaxoSmithKline, UK. GlaxoSmithKline was not involved in this study.
Abbreviations
- ACPAs
anticitrullinated protein antibodies
- gMFI
geometric MFI
- HC
healthy control
- IgM‐RF
IgM rheumatoid factor
- RA
rheumatoid arthritis
- ULN
upper limit of normal
Supporting information
As a service to our authors and readers, this journal provides supporting information supplied by the authors. Such materials are peer reviewed and may be re‐organized for online delivery, but are not copy‐edited or typeset. Technical support issues arising from supporting information (other than missing files) should be addressed to the authors.
Supplementary Material
Acknowledgments
We thank the study participants in this study, the radiology department at the AMC for LN sampling especially Prof. M. Maas and Dr. K.P. van Lienden, the flow cytometry facility at the Haematology department at AMC especially J.A. Dobber and the AMC KIR department, especially M.J.H. de Hair and M. Safy for patient recruitment and G. Rikken en D. Drop for sample processing. This study was supported by the IMI EU funded project BeTheCure (No. 115142), FP7 HEALTH Programme under the grant agreement FP7‐HEALTH‐F2‐2012‐305549 (Euro‐TEAM), Dutch Arthritis Foundation Grant No. 11‐1‐308, and The Netherlands Organisation for Health Research and Development (ZonMw) Veni Project No. 916.12.109. T.H.R. and L.G.M.V.B. conceived the project, designed the experiments, collected and analyzed data, interpreted the results, and wrote the manuscript. J.H. and T.H.R. performed experiments and analyzed data. J.H. and K.I.M. reviewed the manuscript. K.I.M. and L.G.M.V.B. were involved in patient recruitment, clinical data and biomaterial collection. D.M.G. contributed to the study design, data collection, and reviewed the manuscript. P.P.T. was involved in study conception and design, interpretation of the results, and revised the manuscript. All authors read and approved the manuscript.
References
- 1. Goodnow, C. C. , Sprent, J. , Fazekas de St Groth, B. and Vinuesa, C. G. , Cellular and genetic mechanisms of self tolerance and autoimmunity. Nature 2005. 435: 590–597. [DOI] [PubMed] [Google Scholar]
- 2. O'Garra, A. , Gabrysova, L. and Spits, H. , Quantitative events determine the differentiation and function of helper T cells. Nat. Immunol. 2011. 12: 288–294. [DOI] [PubMed] [Google Scholar]
- 3. O'Shea, J. J. and Paul, W. E. , Mechanisms underlying lineage commitment and plasticity of helper CD4+ T cells. Science 2010. 327: 1098–1102. [DOI] [PMC free article] [PubMed] [Google Scholar]
- 4. Sallusto, F. and Monticelli, S. , The many faces of CD4 T cells: roles in immunity and disease. Semin. Immunol. 2013. 25: 249–251. [DOI] [PubMed] [Google Scholar]
- 5. Nielen, M. M. , van Schaardenburg, D. , Reesink, H. W. , Twisk, J. W. , van de Stadt, R. J. , van der Horst‐Bruinsma, I. E. , de Gast, T. et al., Increased levels of C‐reactive protein in serum from blood donors before the onset of rheumatoid arthritis. Arthritis Rheum. 2004. 50: 2423–2427. [DOI] [PubMed] [Google Scholar]
- 6. Rantapaa‐Dahlqvist, S. , de Jong, B. A. , Berglin, E. , Hallmans, G. , Wadell, G. , Stenlund, H. , Sundin, U. et al., Antibodies against cyclic citrullinated peptide and IgA rheumatoid factor predict the development of rheumatoid arthritis. Arthritis Rheum. 2003. 48: 2741–2749. [DOI] [PubMed] [Google Scholar]
- 7. van de Sande, M. G. , de Hair, M. J. , van der Leij, C. , Klarenbeek, P. L. , Bos, W. H. , Smith, M. D. , Maas, M. et al., Different stages of rheumatoid arthritis: features of the synovium in the preclinical phase. Ann. Rheum. Dis. 2011. 70: 772–777. [DOI] [PubMed] [Google Scholar]
- 8. Nielen, M. M. , van Schaardenburg, D. , Reesink, H. W. , van de Stadt, R. J. , van der Horst‐Bruinsma, I. E. , de Koning, M. H. , Habibuw, M. R. et al., Specific autoantibodies precede the symptoms of rheumatoid arthritis: a study of serial measurements in blood donors. Arthritis Rheum. 2004. 50: 380–386. [DOI] [PubMed] [Google Scholar]
- 9. Gerlag, D. M. , Raza, K. , van Baarsen, L. G. , Brouwer, E. , Buckley, C. D. , Burmester, G. R. , Gabay, C. et al., EULAR recommendations for terminology and research in individuals at risk of rheumatoid arthritis: report from the Study Group for Risk Factors for Rheumatoid Arthritis. Ann. Rheum. Dis. 2012. 71: 638–641. [DOI] [PMC free article] [PubMed] [Google Scholar]
- 10. Li, J. , Kuzin, I. , Moshkani, S. , Proulx, S. T. , Xing, L. , Skrombolas, D. , Dunn, R. et al., Expanded CD23(+)/CD21(hi) B cells in inflamed lymph nodes are associated with the onset of inflammatory‐erosive arthritis in TNF‐transgenic mice and are targets of anti‐CD20 therapy. J. Immunol. 2010. 184: 6142–6150. [DOI] [PMC free article] [PubMed] [Google Scholar]
- 11. Rodriguez‐Palmero, M. , Pelegri, C. , Ferri, M. J. , Castell, M. , Franch, A. and Castellote, C. , Alterations of lymphocyte populations in lymph nodes but not in spleen during the latency period of adjuvant arthritis. Inflammation 1999. 23: 153–165. [DOI] [PubMed] [Google Scholar]
- 12. Wooley, P. H. and Whalen, J. D. , Pristane‐induced arthritis in mice. III. Lymphocyte phenotypic and functional abnormalities precede the development of pristane‐induced arthritis. Cell. Immunol. 1991. 138: 251–259. [DOI] [PubMed] [Google Scholar]
- 13. Kimura, A. and Kishimoto, T. , IL‐6: regulator of Treg/Th17 balance. Eur. J. Immunol. 2010. 40: 1830–1835. [DOI] [PubMed] [Google Scholar]
- 14. McInnes, I. B. and Schett, G. , The pathogenesis of rheumatoid arthritis. N. Engl. J. Med. 2011. 365: 2205–2219. [DOI] [PubMed] [Google Scholar]
- 15. Noack, M. and Miossec, P. , Th17 and regulatory T cell balance in autoimmune and inflammatory diseases. Autoimmun. Rev. 2014. 13: 668–677. [DOI] [PubMed] [Google Scholar]
- 16. van Baarsen, L. G. , de Hair, M. J. , Ramwadhdoebe, T. H. , Zijlstra, I. J. , Maas, M. , Gerlag, D. M. and Tak, P. P. , The cellular composition of lymph nodes in the earliest phase of inflammatory arthritis. Ann. Rheum. Dis. 2013. 72: 1420–1424. [DOI] [PMC free article] [PubMed] [Google Scholar]
- 17. Sathaliyawala, T. , Kubota, M. , Yudanin, N. , Turner, D. , Camp, P. , Thome, J. J. , Bickham, K. L. et al., Distribution and compartmentalization of human circulating and tissue‐resident memory T cell subsets. Immunity 2013. 38: 187–197. [DOI] [PMC free article] [PubMed] [Google Scholar]
- 18. Gosselin, A. , Monteiro, P. , Chomont, N. , Diaz‐Griffero, F. , Said, E. A. , Fonseca, S. , Wacleche, V. et al., Peripheral blood CCR4+CCR6+ and CXCR3+CCR6+CD4+ T cells are highly permissive to HIV‐1 infection. J. Immunol. 2010. 184: 1604–1616. [DOI] [PMC free article] [PubMed] [Google Scholar]
- 19. Havenith, S. H. , Remmerswaal, E. B. , Idu, M. M. , van Donselaar‐van der Pant, K. A. , van der Bom, N. , Bemelman, F. J. , van Leeuwen, E. M. et al., CXCR5+CD4+ follicular helper T cells accumulate in resting human lymph nodes and have superior B cell helper activity. Int. Immunol. 2014. 26: 183–192. [DOI] [PubMed] [Google Scholar]
- 20. Costantini, A. , Mancini, S. , Giuliodoro, S. , Butini, L. , Regnery, C. M. , Silvestri, G. and Montroni, M. , Effects of cryopreservation on lymphocyte immunophenotype and function. J. Immunol. Methods 2003. 278: 145–155. [DOI] [PubMed] [Google Scholar]
- 21. Cope, A. , Le Friec, G. , Cardone, J. and Kemper, C. , The Th1 life cycle: molecular control of IFN‐gamma to IL‐10 switching. Trends Immunol. 2011. 32: 278–286. [DOI] [PubMed] [Google Scholar]
- 22. van de Stadt, L. A. , van der Horst, A. R. , de Koning, M. H. , Bos, W. H. , Wolbink, G. J. , van de Stadt, R. J. , Pruijn, G. J. et al., The extent of the anti‐citrullinated protein antibody repertoire is associated with arthritis development in patients with seropositive arthralgia. Ann. Rheum. Dis. 2011. 70: 128–133. [DOI] [PubMed] [Google Scholar]
- 23. Mahnke, Y. D. , Brodie, T. M. , Sallusto, F. , Roederer, M. and Lugli, E. , The who's who of T‐cell differentiation: human memory T‐cell subsets. Eur. J. Immunol. 2013. 43: 2797–2809. [DOI] [PubMed] [Google Scholar]
- 24. Sallusto, F. , Geginat, J. and Lanzavecchia, A. , Central memory and effector memory T cell subsets: function, generation, and maintenance. Annu. Rev. Immunol. 2004. 22: 745–763. [DOI] [PubMed] [Google Scholar]
- 25. Schulze‐Koops, H. and Kalden, J. R. , The balance of Th1/Th2 cytokines in rheumatoid arthritis. Best Pract. Res. Clin. Rheumatol. 2001. 15: 677–691. [DOI] [PubMed] [Google Scholar]
- 26. Benedetti, G. and Miossec, P. , Interleukin 17 contributes to the chronicity of inflammatory diseases such as rheumatoid arthritis. Eur. J. Immunol. 2014. 44: 339–347. [DOI] [PubMed] [Google Scholar]
- 27. Wang, W. , Shao, S. , Jiao, Z. , Guo, M. , Xu, H. and Wang, S. , The Th17/Treg imbalance and cytokine environment in peripheral blood of patients with rheumatoid arthritis. Rheumatol. Int. 2012. 32: 887–893. [DOI] [PubMed] [Google Scholar]
- 28. Gullick, N. J. , Abozaid, H. S. , Jayaraj, D. M. , Evans, H. G. , Scott, D. L. , Choy, E. H. and Taams, L. S. , Enhanced and persistent levels of interleukin (IL)‐17(+) CD4(+) T cells and serum IL‐17 in patients with early inflammatory arthritis. Clin. Exp. Immunol. 2013. 174: 292–301. [DOI] [PMC free article] [PubMed] [Google Scholar]
- 29. Chabaud, M. , Durand, J. M. , Buchs, N. , Fossiez, F. , Page, G. , Frappart, L. and Miossec, P. , Human interleukin‐17: a T cell‐derived proinflammatory cytokine produced by the rheumatoid synovium. Arthritis Rheum. 1999. 42: 963–970. [DOI] [PubMed] [Google Scholar]
- 30. van Baarsen, L. , Lebre, M. , van der Coelen, D. , Aarrass, S. , Tang, M. , Ramwadhdoebe, T. H. , Gerlag, D. M. et al., Heterogeneous expression pattern of interleukin‐17A (IL‐17A), IL‐17F and their receptors in synovium of rheumatoid arthritis, psoriatic arthritis and osteoarthritis: possible explanation for non‐response to anti‐IL‐17 therapy? Arthritis Res. Ther. 2014. 16: 426–435. [DOI] [PMC free article] [PubMed] [Google Scholar]
- 31. Cohen, S. B. , Katsikis, P. D. , Chu, C. Q. , Thomssen, H. , Webb, L. M. , Maini, R. N. , Londei, M. et al., High level of interleukin‐10 production by the activated T cell population within the rheumatoid synovial membrane. Arthritis Rheum. 1995. 38: 946–952. [DOI] [PubMed] [Google Scholar]
- 32. Morita, Y. , Yamamura, M. , Kawashima, M. , Harada, S. , Tsuji, K. , Shibuya, K. , Maruyama, K. et al., Flow cytometric single‐cell analysis of cytokine production by CD4+ T cells in synovial tissue and peripheral blood from patients with rheumatoid arthritis. Arthritis Rheum. 1998. 41: 1669–1676. [DOI] [PubMed] [Google Scholar]
- 33. McGeachy, M. J. , Bak‐Jensen, K. S. , Chen, Y. , Tato, C. M. , Blumenschein, W. , McClanahan, T. and Cua, D. J. , TGF‐beta and IL‐6 drive the production of IL‐17 and IL‐10 by T cells and restrain T(H)‐17 cell‐mediated pathology. Nat. Immunol. 2007. 8: 1390–1397. [DOI] [PubMed] [Google Scholar]
- 34. Schietinger, A. and Greenberg, P. D. , Tolerance and exhaustion: defining mechanisms of T cell dysfunction. Trends Immunol. 2014. 35: 51–60. [DOI] [PMC free article] [PubMed] [Google Scholar]
- 35. Smeets, T. J. , Dolhain, R. , Miltenburg, A. M. , de Kuiper, R. , Breedveld, F. C. and Tak, P. P. , Poor expression of T cell‐derived cytokines and activation and proliferation markers in early rheumatoid synovial tissue. Clin. Immunol. Immunopathol. 1998. 88: 84–90. [DOI] [PubMed] [Google Scholar]
- 36. Raza, K. , Falciani, F. , Curnow, S. J. , Ross, E. J. , Lee, C. Y. , Akbar, A. N. , Lord, J. M. et al., Early rheumatoid arthritis is characterized by a distinct and transient synovial fluid cytokine profile of T cell and stromal cell origin. Arthritis Res. Ther. 2005. 7: R784–R795. [DOI] [PMC free article] [PubMed] [Google Scholar]
- 37. Wherry, E. J. , T cell exhaustion. Nat. Immunol. 2011. 12: 492–499. [DOI] [PubMed] [Google Scholar]
- 38. Elsaesser, H. , Sauer, K. and Brooks, D. G. , IL‐21 is required to control chronic viral infection. Science 2009. 324: 1569–1572. [DOI] [PMC free article] [PubMed] [Google Scholar]
- 39. Crawford, A. , Angelosanto, J. M. , Kao, C. , Doering, T. A. , Odorizzi, P. M. , Barnett, B. E. and Wherry, E. J. , Molecular and transcriptional basis of CD4(+) T cell dysfunction during chronic infection. Immunity 2014. 40: 289–302. [DOI] [PMC free article] [PubMed] [Google Scholar]
- 40. de Hair, M. J. , Zijlstra, I. A. , Boumans, M. J. , van de Sande, M. G. , Maas, M. , Gerlag, D. M. and Tak, P. P. , Hunting for the pathogenesis of rheumatoid arthritis: core‐needle biopsy of inguinal lymph nodes as a new research tool. Ann. Rheum. Dis. 2012. 71: 1911–1912. [DOI] [PubMed] [Google Scholar]
- 41. Pascutti, M. F. , Jak, M. , Tromp, J. M. , Derks, I. A. , Remmerswaal, E. B. , Thijssen, R. , van Attekum, M. H. et al., IL‐21 and CD40L signals from autologous T cells can induce antigen‐independent proliferation of CLL cells. Blood 2013. 122: 3010–3019. [DOI] [PubMed] [Google Scholar]
Associated Data
This section collects any data citations, data availability statements, or supplementary materials included in this article.
Supplementary Materials
As a service to our authors and readers, this journal provides supporting information supplied by the authors. Such materials are peer reviewed and may be re‐organized for online delivery, but are not copy‐edited or typeset. Technical support issues arising from supporting information (other than missing files) should be addressed to the authors.
Supplementary Material