

Abstract
1. Purpose
This study is part of a larger effort aiming to expand the knowledge of brain‐enriched proteins in human cerebrospinal fluid (CSF) and to provide novel insight into the relation between such proteins and different neurodegenerative diseases.
2. Experimental design
Here 280 brain‐enriched proteins in CSF from patients with Alzheimer's disease (AD), Parkinson's disease (PD) and dementia with Lewy bodies (DLB) are profiled. In total, 441 human samples of ventricular CSF collected post mortem and lumbar CSF collected ante mortem are analyzed using 376 antibodies in a suspension bead array setup, utilizing a direct labelling approach.
3. Results
Among several proteins displaying differentiated profiles between sample groups, we focus here on two synaptic proteins, neuromodulin (GAP43) and neurogranin (NRGN). They are both found at elevated levels in CSF from AD patients in two independent cohorts, providing disease‐associated profiles in addition to verifying and strengthening previously observed patterns. Increased levels are also observed for patients for whom the AD diagnosis was not established at the time of sampling.
4. Conclusions and clinical relevance
These findings indicate that analyzing the brain‐enriched proteins in CSF is of particular interest to increase the understanding of the CSF proteome and its relation to neurodegenerative disorders. In addition, this study lends support to the notion that measurements of these synaptic proteins could potentially be of great relevance in future diagnostic tests for AD.
Keywords: Alzheimer's disease, Cerebrospinal fluid, Neurogranin, Neuromodulin, Neuroproteomics
Abbreviations
- AD
Alzheimer's disease
- CSF
cerebrospinal fluid
- DLB
dementia with Lewy bodies
- GTEx
genotype–tissue expression
- HPA
Human Protein Atlas
- MS
multiple sclerosis
- PD
Parkinson's disease
- PMD
postmortem delay
- TMA
tissue microarrays
- UPDRS
unified Parkinson's disease rating scale
1. Introduction
The human body is a complex system of cells, tissues, and organs. By identifying the specialized genes and proteins responsible for specific cell and organ functions, we can increase our understanding of human biology and the pathophysiological processes associated with disease. Recent developments within the biotechnology field enable such large‐scale comparative studies where gene expression variability can be investigated between and within tissues and organs.
Clinical Relevance
Increasing life expectancy leads to higher prevalence of age‐related diseases and as one of the most affected organs, the aged brain is prone to deposition of pathological proteins causing a variety of neurodegenerative disorders. Although many such proteins have been well characterized, we still need to explore the potential pathophysiological influence from yet other proteins. Utilizing patient‐derived samples, such studies can be conducted directly on brain tissue or on cerebrospinal fluid (CSF). This study is part of a larger effort aiming to expand the knowledge of brain‐enriched proteins in human CSF and to provide novel insight into the relation between such proteins and different neurodegenerative diseases. The actual findings can extend our knowledge of the protein content in the CNS and may also aid in the search for novel diagnostic and therapeutic strategies for such disorders.
Increasing life expectancy leads to higher prevalence of age‐related diseases 1. The brain is one of the organs highly affected by aging and age‐related pathological processes give rise to a variety of neurodegenerative disorders 2, 3. Exploring protein expression, abundance, and distribution in healthy and disease‐affected brains will provide a possibility to extend the current knowledge of the mechanisms involved in neurological disorders. However, as the brain is well protected and only accessible through invasive surgery, direct assessment of disease processes in living patients is limited. This has led to the utilization of other biological sample materials with a proximity to the brain. Cerebrospinal fluid (CSF) is one such material commonly used to monitor both normal and pathological conditions of the human brain 4, 5. Apart from mechanically protecting the brain, CSF facilitates regulation of neuronal activity through transport of neuropeptides and hormones, as well as buffering of chemicals and proteins diffused from the CNS 6, 7. Changes in the brain are hence reflected in the composition of CSF and it provides a mean for studying processes related to neurological disease.
Several studies have aimed to determine the CSF proteome, resulting in the identification of thousands of proteins 4, 8, 9. In order to gain insight into which of these proteins that originate from cells in the CNS, efforts have been made to map gene expression in different brain regions, as well as comparing gene expression across tissues 10, 11. In a report based on analysis of 32 different human tissues, the cerebral cortex was among the tissues with the largest number of expressed genes and the study resulted in the identification of 571 genes with enriched (5× higher expression compared to all or the average of all other analyzed tissues) expression in the brain 10. Other global efforts to map tissue‐specific genes, such as the genotype–tissue expression (GTEx) project, are continuously providing new data by including more tissues and increasing sample numbers 12.
The correlation between mRNA levels and levels of the corresponding protein product is by no means absolute as protein levels are known to be greatly influenced by pre‐ and posttranslational mechanisms that affect protein production, stability, and turnover 13. However, positive correlations between mRNA and protein levels have been observed in several human cell lines, as well as in tissues 14, 15 and the amount of present transcripts can be used as a predictor for protein levels.
Neurodegenerative disorders constitute a group of diseases involving progressive loss of neurons and neuronal functions commonly associated with age. Among these, Alzheimer's disease (AD) is the most common, followed by Parkinson's disease (PD), vascular dementia, dementia with Lewy bodies (DLB), and frontotemporal dementia 16. These diseases affect millions of people worldwide and further characterization of the pathogenic and pathophysiological mechanisms driving disease progression is necessary as the current therapies are mainly limited to symptomatic treatments. Herein, we describe a targeted study analyzing CSF levels of a subset of the 571 proteins with mRNA expression identified as brain‐enriched 10. Protein levels were detected using a multiplexed suspension bead array with 376 antibodies generated within the Human Protein Atlas (HPA) targeting 280 proteins in a total of 441 CSF samples from healthy controls and patients with AD, PD, and DLB.
2. Materials and methods
2.1. CSF Samples
The samples analyzed in this study were derived from four independent cohorts collected at different sites. Three of the sample sets contained lumbar CSF collected from living donors (antemortem) and the fourth ventricular CSF collected postmortem. Sample characteristics are summarized in Table 1.
Table 1.
Sample demographics
| AD1 | N | Age (median[range]) | Gender (F/M) | Ab42 (median[range]) | Tau (median[range]) | p‐Tau (median[range]) | |
|---|---|---|---|---|---|---|---|
| AD | 29 | 72 (51–85) | 18/11 | 350 (160–950) | 600 (210–2430) | 78 (34–282) | |
| AD converter | 6 | 72 (51–84) | 1/5 | 390 (220–940) | 490 (320–950) | 88 (57–128) | |
| Prodromal AD | 12 | 63 (40–75) | 4/8 | 390 (170–1130) | 400 (170–910) | 58 (27–101) | |
| Non‐AD MCI | 11 | 64 (58–74) | 7/4 | 720 (480–1040) | 250 (200–370) | 46 (31–62) | |
| Control | 15 | 71 (44–77) | 11/4 | NA | NA | NA | |
| Total | 73 | ||||||
| AD2 | N | Age (median[range]) | Gender (F/M) | Ab42 (median[range]) | Tau (median[range]) | p‐Tau (median[range]) | |
| AD | 43 | 81 (53–102) | 28/15 | 453 (260–639) | 834 (490–3178) | 86 (59–179) | |
| Prodromal AD | 2 | 90 (88–92) | 2/0 | 365 (360–370) | 740 (593–887) | 82.5 (77–88) | |
| Preclinical AD | 14 | 85 (73–96) | 10/4 | 416 (244–518) | 821 (565–1092) | 95 (78‐131) | |
| Non‐AD MCI | 10 | 84 (56–93) | 8/2 | 754 (570–913) | 282 (172–367) | 36 (26–46) | |
| Control | 23 | 79 (44–91) | 12/11 | 706 (559–1192) | 308 (171–399) | 47 (29–60) | |
| Total | 92 | ||||||
| PD | N | Age (median[range]) | Gender (F/M) | Albumin quotient (median[range]) | IgG index (median[range]) | UPDRS (median(range]) | |
| PD | 31 | 63 (44–77) | 9/22 | 6.9 (0–13.3) | 0.49 (0–0.54) | 42 (22–73) | |
| PD De Novo | 43 | 66 (36–89) | 12/31 | 7.2 (0–14.1) | 0.47 (0–40) | 28 (12–67) | |
| PD Plus | 16 | 66.5 (57–81) | 7/9 | 7.1 (4.3–14.0) | 0.5 (0.4–0.6) | 51 (51–51) | |
| Control | 114 | 61 (41–83) | 41/73 | 6.6 (0–16.6) | 0.48 (0–47) | NA | |
| Total | 204 | ||||||
| DLB | N | Age (median[range]) | Gender (F/M) | PMD (median[range]) | Braak AD [0/I/II/III/IV/V/VI/NA] | Plaque load (O/A/B/C/NA) | Braak DLB [0/I/II/III/IV/V/VI/NA] |
| AD | 28 | 80 (66–96) | 15/13 | 05:15 (03:45–07:45) | 0/0/0/0/0/0/8/20/0 | 0/0/0/28/0 | 4/2/0/0/0/0/0/22 |
| DLB | 18 | 77.5 (65–88) | 3/15 | 05:18 (04:00–09:05) | 0/17/0/0/0/0/0/1 | 7/4/9/0/1 | 0/0/0/0/0/7/11/0 |
| Control | 26 | 83 (71–98) | 15/11 | 05:10 (04:15–17:40) | 0/26/0/0/0/0/0/0 | 6/9/11/1/0 | 17/2/0/0/0/0/0/0/8 |
| Total | 72 |
Clinical characteristics of patients and controls included in the study. AD converters—individuals for whom the AD diagnosis was not established at the time of sampling. Prodromal AD—individuals with decreased CSF levels of Aβ1‐42 together with increased levels of t‐Tau or p‐Tau. Non‐AD MCI—individuals with mild cognitive impairment (MCI). Preclinical AD—individuals with abnormally decreased CSF levels of Aβ1‐42. PD De Novo—individuals with PD that had not undergone any treatment before the time of sampling. PD Plus—individuals with PD‐like symptoms diagnosed with either progressive supranuclear palsy or cortico basal syndrome. UPDRS—unified Parkinson's disease rating scale. PMD—Postmortem delay.
Samples from donors diagnosed with AD together with matched controls were obtained from two independent Swedish sample collections. In the first, CSF samples from Uppsala University Hospital (denoted as AD1) were collected via lumbar puncture as a part of the routine diagnostic procedure and randomly chosen from a biobank collected during 2003–2007. Alzheimer cases had been diagnosed according to the NINCDS‐ADRDA (National Institute of Neurological and Communicative Disorders and Stroke and the Alzheimer's Disease and Related Disorders Association) criteria and the control samples had been collected from healthy volunteers. For the second sample set, lumbar samples were collected at the Sahlgrenska hospital in Gothenburg (denoted AD2). The diagnostic criteria of each group was defined by a combination of clinical diagnosis (cognitively normal, mild‐cognitive impairment or dementia) and the CSF biomarker profile including total Aβ1‐42, total Tau (t‐Tau), and phospho‐Tau (p‐Tau), measured using INNOTEST ELISAs (Fujirebio, Ghent, Belgium) 17. The CSF AD signature was defined as abnormally decreased Aβ1‐42 for preclinical AD, and the combination of decreased Aβ1‐42 together with increased T‐tau or P‐tau for prodromal AD and dementia AD 17. The control group consisted of asymptomatic cognitively normal individuals with all three core biomarkers within the normal range. The Uppsala Ethical Review Board and the regional ethics committee of the University of Gothenburg approved the respective studies and all patients had given their informed consents.
In the PD cohort, patients were clinically diagnosed according to the United Kingdom PD Society Brain Bank 18. In addition, patients with progressive supranuclear palsy or corticobasal syndrome, that is, “Parkinson plus” variants, were included. Controls were suffering from benign neurological conditions, such as tension headache and unclassified sensory disturbances. The investigation of the PD patients and the analysis of their CSF were approved by the local ethic committees (2011/500‐31/1; 2012/224‐32/4). Informed consent was obtained from all subjects.
An additional set of postmortem CSF samples (denoted DLB) from patients with AD, DLB, and neurologically healthy controls was included in the study. The samples were obtained from the Netherlands Brain Bank, Netherlands Institute for Neuroscience (NBB), and cases were selected based on neuropathological classifications with low comorbidity of AD and DLB (Table 1). For detailed information on sample collection, see Supporting Information.
2.2. Brain tissue
Human postmortem brain samples from ten AD patients (AD Braak stage 6; amyloid deposits stage C) 19, ten DLB patients (DLB Braak stage 5–6; amyloid deposits stage 0‐B) 20 and nine healthy controls (AD Braak stage 0–1; amyloid deposits stage 0‐B) were also obtained from NBB. The tissue was received as formalin‐fixed (4% formaldehyde) paraffin embedded blocks of temporal cortex. Tissue microarrays (4 μm thick) were cut on a sliding microtome and mounted onto glass slides coated with 3‐aminopropyltriethoxysilane (Sigma). The use of postmortem brain tissue and CSF samples was approved by the Stockholm ethical review board (EPN 2013/474‐31/12).
2.3. Protein profiling
2.3.1. Suspension bead array
Three hundred seventy‐six HPA antibodies (www.proteinatlas.org) targeting the 280 proteins with brain‐enriched mRNA expression levels were immobilized onto color‐coded magnetic beads as previously described 21. Following immobilization, the coupled beads were washed and stored in blocking reagent until creation of a suspension bead array by combining all bead identities. All CSF samples were cohort‐wise transferred to 96‐well microtiter plates in a randomized layout, diluted 1:2, and directly labeled with biotin as described elsewhere 22. After labeling, the samples were further diluted 1:8 and heat treated before incubation with the bead array at RT overnight. Captured proteins were detected by addition of a streptavidin‐conjugated fluorophore prior to measurement in the FlexMap3D instrument (Luminex Corporation). Results were reported as median fluorescence intensities per bead identity and sample.
2.3.2. Immunohistochemistry
Tissue microarrays (TMA) of human temporal cortex were deparaffinized, rehydrated, and treated with antigen retrieval solution (pH 6.0) and peroxidase block solution in an automated Leica Bond RX immunostainer (Leica Biosystems). The TMAs were thereafter incubated with primary antibodies for 16 h at 4°C, washed, and blocked in Tris‐NaCl‐blocking buffer (TNB) before addition of secondary antibodies. Following this, tyramide signal amplification technology (TSA) cyanine 5 tyramide amplification reagent was added for 15 min before washing and quenching in 1% Sudan black. Fluorescence microscope images were acquired on a Vslide scanning microscope (MetaSystems, Alltlussheim, Germany) equipped with a CoolCube 2 camera, 2.5×, 5×, 10×, and 20× objectives and filter sets for DAPI (EX350/50–EM470/40), FITC (EX493/16–EM527/30), Cy3 (EX546/10–EM580/30), Cy3.5 (EX581/10–EM617/40), and Cy5 (EX630/20–647/long pass).
For a more thorough description of the methods including antibody validations such as sandwich immunoassays and immunocapture multiple sclerosis (MS), see Supporting Information.
2.4. Data analysis
PCA was performed using the R function prcomp and correlation coefficients for both proteins and protein levels to clinical information were calculated using Spearman's rho statistics. Differences in protein levels between sample groups were evaluated by the Wilcoxon rank‐sum test and unadjusted p values below 0.05 regarded as significant. Existing datasets for gene expression in brain from the HPA (www.proteinatlas.org) and GTEx portal (www.gtexportal.org) was utilized for comparisons to protein levels. For more detailed information on data analysis see Supporting Information.
3. Results
Here, we report a multiplexed protein profiling using an affinity‐based proteomics approach to generate CSF profiles of brain‐enriched proteins. In a previous study, 571 of the in total 13 992 genes expressed in human frontal cortex were defined to have brain‐enriched expression compared to other human tissues. We analyzed 280 of the corresponding proteins, targeted by 376 antibodies, in 441 CSF samples from patients with AD, PD, and DLB as well as from neurologically healthy and diseased controls (Fig. 1). The majority of the proteins included in this analysis are involved in neurotransmission, development, and neuronal processes such as learning, memory, and cognition (Supporting Information Fig. 1).
Figure 1.
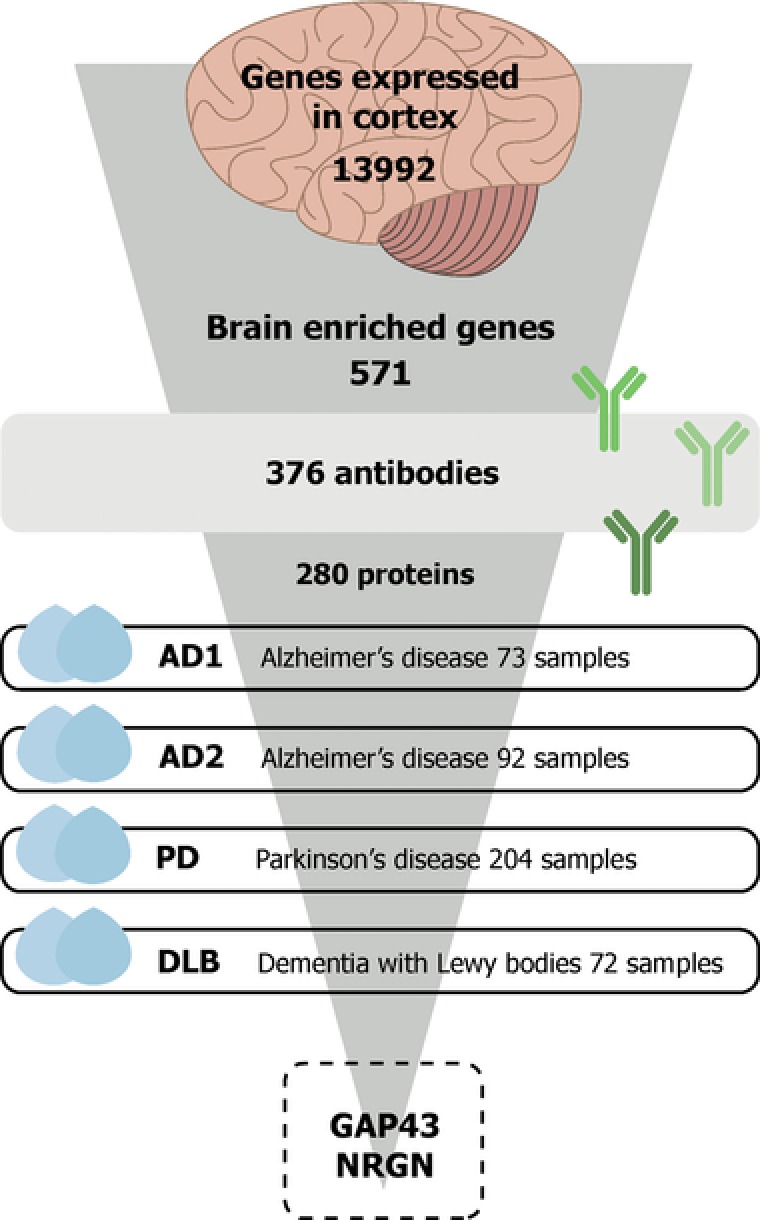
Study overview. In this study, we profiled CSF samples with a focus on proteins with enriched expression in brain compared to other human tissues. In total, 441 CSF samples representing patients with Alzheimer's disease (AD), Parkinson's disease (PD), and dementia with Lewy bodies (DLB) as well as controls were analyzed using 376 antibodies targeting 280 proteins. Disease‐associated profiles were observed for the two proteins neuromodulin (GAP43) and neurogranin (NRGN).
3.1. Overview of protein profiles in CSF
A PCA of the data was performed to generate an overview of the obtained sample profiles. The results indicate that profiles from samples collected by lumbar puncture from patients in the two AD and PD cohorts were, as expected, more similar to each other compared to the DLB sample set collected from the lateral ventricles postmortem (Fig. 2A). In a comparison of intensities per antibody and cohort, 220 antibodies displayed a significantly (p < 0.001) altered mean intensity in this sample set compared to the cohorts collected through lumbar puncture. Among the proteins with the largest differences were the highly expressed brain proteins glial fibrillary acidic protein, myelin basic protein, and synaptosomal associated protein 25. Several proteins such as ermin, tubulin polymerization‐promoting protein, and numerous solute carrier proteins showed a lower relative expression in the DLB cohort (Supporting Information Fig. 2).
Figure 2.
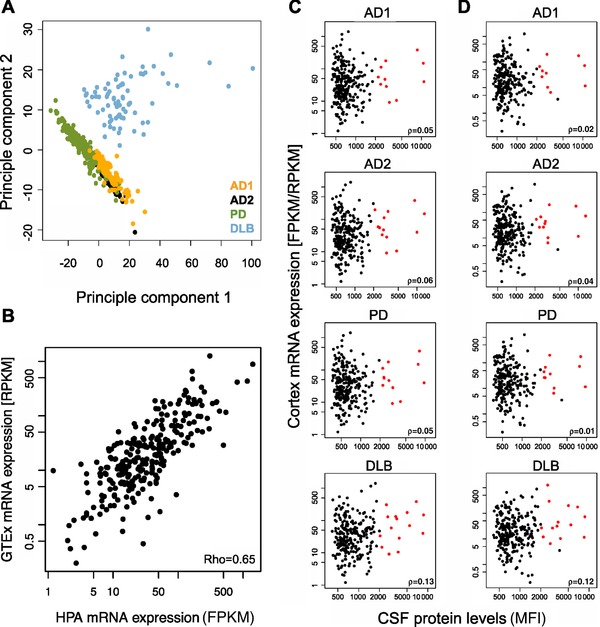
Overview of protein profiles and comparisons to mRNA expression. (A) An overview of the obtained sample profiles was generated through PCA. The result revealed that protein levels in CSF was found to be different in the samples obtained as postmortem ventricular CSF compared to lumbar CSF from living donors. (B) Correlation between HPA and GTEx mRNA expression levels (FPKM/RPKM) in human frontal cortex, p = 0.091. (C) Correlation between mRNA expression levels (FPKM) acquired within the HPA project and the median fluorescent intensity obtained in the CSF protein profiling analysis for all studied cohorts. The red dots represent the 16 proteins with FPKM > 5 and median fluorescence intensities > 2000. (D) Correlation between mRNA expression levels (RPKM) acquired from GTEx and the median fluorescent intensity obtained in the CSF protein profiling analysis for all studied cohorts. The red dots represent the 16 proteins with RPKM > 5 and median fluorescence intensities > 2000.
To evaluate the concordance in protein levels between different individuals and two gene expression datasets, the frontal cortex HPA and GTEx data for 255 of the 280 proteins was compared, revealing a positive correlation of ρ = 0.65 (Fig. 2B). To further investigate the relation of protein levels in our data to mRNA expression levels, the median intensity per protein and sample collection was correlated to the HPA FPKM (Fragments Per Kilobase of transcript per Million mapped reads) values and the GTEx RPKM (Reads Per Kilobase of transcript per Million mapped reads) values. Although no overall correlation was found (ρ < 0.18) a set of 16 proteins represented by 22 antibodies with both high mRNA expression and CSF levels (FPKM/RPKM above 5 and median fluorescence intensities above 2000) could be distinguished from the majority of proteins in all four cohorts (Fig. 2C and D). Among these were amyloid‐like protein 1, neuromodulin (GAP43), myelin‐oligodendrocyte glycoprotein, secretogranin 3, and beta‐synuclein.
3.2. Variation of protein profiles with postmortem delay
For the postmortem samples, the available information regarding postmortem delay (PMD) was used to investigate a potential correlation to the protein profiles. In total, 14 proteins showed positive association to PMD (ρ > 0.4) with the two proteins gamma‐aminobutyric acid A receptor delta and dendrin displaying the highest associations (Supporting Information Table 1). Secretogranin 3 was the only protein showing a negative association (ρ = −0.34), which is visually presented together with the highest associations in Supporting Information Fig. 3.
3.3. CSF profiles of GAP43 and NRGN
In our data, levels of the two brain‐enriched proteins GAP43 and neurogranin (NRGN) were found to be increased in CSF of AD patients as compared to both controls and non‐AD MCI in the two independent sample cohorts (p < 0.05, Fig. 3A). Interestingly, patients defined as prodromal AD together with individuals defined as preclinical AD were found to have higher levels of both GAP43 and NRGN. For GAP43, concordant results were obtained with two different antibodies targeting separate regions of the protein (HPA013392 and HPA015600, see Supporting Information Fig. 4 for paired antibody correlations). There were no significant differences on protein level between sample groups in the PD cohort or between AD, DLB, or controls in postmortem CSF for either GAP43 or NRGN.
Figure 3.
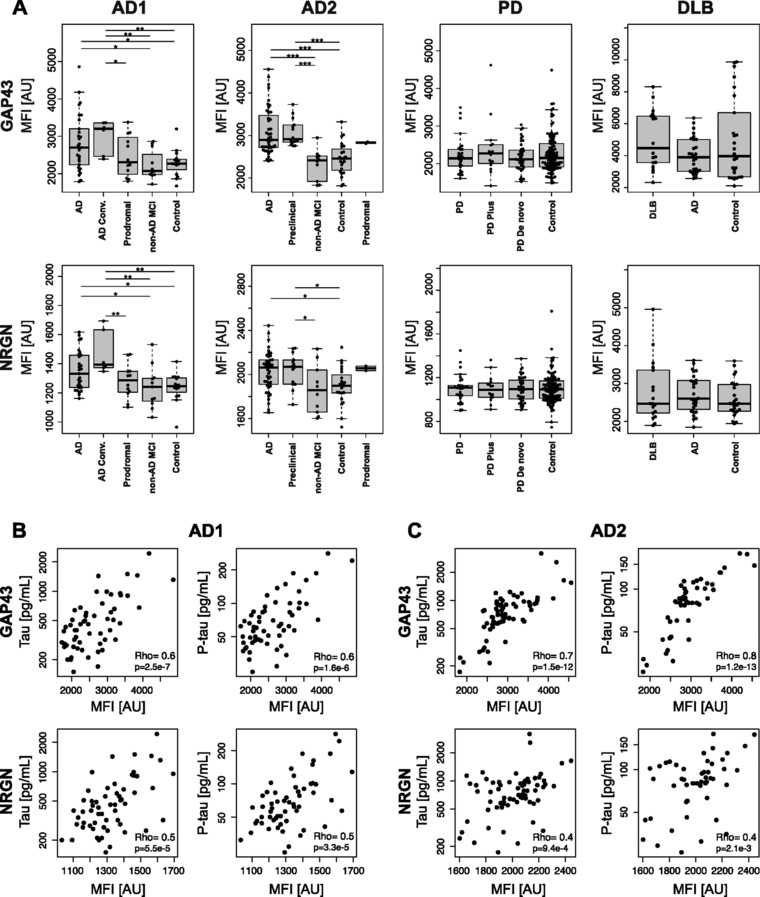
Protein profiles of GAP43 and NRGN in CSF. (A) Protein profiles of GAP43 and NRGN visualized per sample group for all analyzed samples. Stars indicate significant differences, *p < 0.05, **p < 0.01, ***p < 0.001. (B–C) Correlation of CSF protein levels of GAP43 and NRGN to clinical parameters revealed positive associations to tau and P‐tau levels for both proteins in two independent sample sets.
For samples from the two AD cohorts, clinical information including age, and levels of Aβ42, t‐Tau, and p‐Tau were available. The obtained CSF protein levels for both GAP43 and NRGN in patients were correlated to all parameters in order to investigate potential associations. For GAP43, positive correlations were found for both t‐Tau and p‐Tau (ρAD1 > 0.6, ρAD2 > 0.7) (Fig. 3B and C). For NRGN, a positive trend was also observed for t‐Tau and p‐Tau, although with a lower correlation coefficient (ρAD1 = 0.5, ρAD2 = 0.4 and 0.5, respectively). No correlation was observed in relation to age or Aβ42 for either of the proteins. For the PD patients, clinical information about the unified Parkinson's disease rating scale (UPDRS) was available and similarly used to study associations to GAP43 protein expression, revealing a negative association between GAP43 levels and UPDRS (ρ = −0.4, Supporting Information Fig. 5).
Apart from GAP43 and NRGN, several of the 280 studied proteins revealed altered levels between sample groups within the three studied diseases. These are at present undergoing further evaluation and verification in additional sample material in order to explore their relevance in relation to disease pathology.
3.4. Distribution of GAP43 and NRGN in the human cerebral cortex
Immunohistochemistry analysis of brain tissue using the same antibodies as for CSF profiling revealed a synaptic‐like staining pattern for both GAP43 (both antibodies) and NRGN with additional strong labeling of pyramidal‐like cells for NRGN (Fig. 4). Levels of NRGN immunoreactivity were clearly reduced in tau‐bearing cells in the AD brain.
Figure 4.
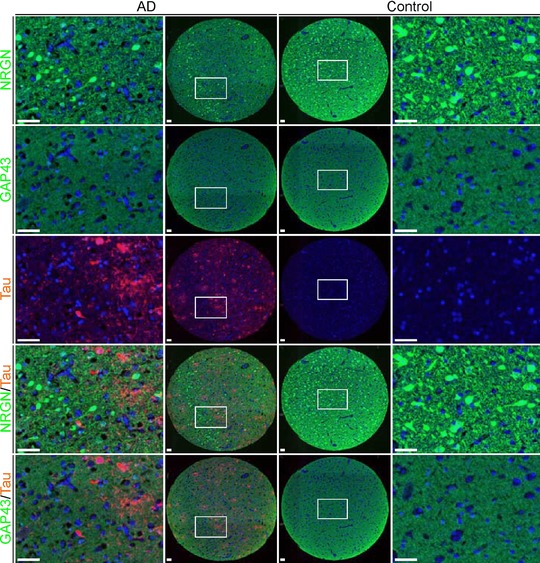
Distribution of GAP43 and NRGN in the human cerebral cortex. Immunohistochemistry staining of GAP43 and NRGN in a TMA of human temporal cortex from one representative AD case (two left columns) and one control subject (two right columns). Both stainings show synaptic‐like pattern and the NRGN antibody displayed additional staining of pyramidal neurons. GAP43 and NRGN are visualized in green, tau in red, and DAPI is shown in blue. Scale bar = 50 μm.
4. Discussion
4.1. Overview of protein profiles in CSF
Profiles for all proteins in all samples were initially summarized in a PCA, revealing an expected separation of the postmortem ventricular samples from the three collections of living donors. These samples differ with regard to two parameters: collection site (ventricular/lumbar) and time (antemortem/postmortem). From our analysis, it is not possible to conclude which parameter is the main cause of the observed differences. However, as previous studies have shown, the concentration of proteins derived from blood as well as total protein concentration increase from the brain to the spine. This is referred to as the rostro‐caudal gradient and believed to be the result of passive diffusion 23, 24, 25, 26. Brain‐derived proteins have, on the contrary, been reported to decrease in concentration toward the spine 23. This trend has not been confirmed in all studies investigating this gradient 24, 27. The proteins analyzed in our study were selected to be brain‐enriched and could therefore be considered as brain‐derived rather than blood‐derived. The majority of proteins identified with differences in ventricular postmortem versus lumbar antemortem CSF was concordantly found with higher levels in ventricular samples.
In postmortem brain tissue, the majority of transcripts and proteins have been reported to be reasonably stable 28. For CSF on the other hand, postmortem samples have been shown to contain altered levels of proteins with an increase compared to samples collected antemortem 29. Finehout et al., identified a set of proteins with positive correlation to PMD (also referred to as postmortem interval), but none with decreasing levels. This study did not include antibodies against any of these proteins, although we found 14 other proteins that displayed a positive association to PMD and one that displayed a negative association.
In order to properly investigate these differences between the cohorts in our study and to be able to draw any conclusions, additional samples exhibiting only one of the aspects would have to be analyzed. This highlights the importance of matching samples not only when it comes to age, gender, and disease state, but also collection site and time as well as postcollection treatment of the sample.
In order to compare protein profiles in CSF to gene expression in brain tissue, we performed a correlation analysis of our results and data previously generated in two different RNA sequencing efforts. The amount of expressed protein is not solely dependent on the number of mRNA transcripts in the corresponding tissue, but on several other factors such as posttranslational processing and protein half‐life 13. The low concordance in mRNA and protein levels between the two different sample types is probably mainly explained by the fact that the mRNA data and CSF protein data were acquired from different individuals. Nevertheless, the high concordance in expression between the HPA and the GTEx mRNA datasets suggest that relative expression levels are fairly consistent between individuals, strengthening the selection of protein targets for this study.
4.2. CSF profiles of GAP43 and NRGN
We found protein levels of both GAP43 and NRGN in CSF to be significantly increased in AD patients as compared to controls and non‐AD MCI in both cohorts with CSF from living donors. Interestingly, increased levels were also observed for patients for whom the AD diagnosis was not established at the time of sampling (denoted preclinical, prodromal AD, and AD converters). Although levels were increased in AD CSF from both independent cohorts, neither GAP43 nor NRGN were found at altered levels in AD samples collected postmortem. While these were not among the proteins with the largest differences between cohorts, they were both found with increased levels in the DLB cohort as compared to the others. This finding could possibly indicate a leakage of proteins from tissue to CSF, masking any potential biological difference and thus explain why disease‐associated levels were not observed in this cohort.
Despite the fact that no differences were found in protein levels for either GAP43 or NRGN in CSF from PD patients and controls, protein profiles were correlated to the clinical information available. Rating of patients according to the UPDRS scale that is used to monitor PD‐related disabilities and impairment with higher scores indicating higher disability 30 revealed a weak negative association to GAP43 CSF levels. This could indicate that patients with progressive disease display lower levels of GAP43, in contrast to the increased levels in AD patients. However, as PD is characterized by a more specific degradation of the dopaminergic neurons mainly in the substantia nigra 31, there is a possibility that the general tissue degradation occurring in PD is not extensive enough to be detected in CSF. So far, GAP43 has not been widely studied in relation to PD but one study indicated decreased levels in CSF from PD patients compared to controls 32.
GAP43 is a synaptic protein mainly observed in the presynaptic terminals. It has been shown to play a crucial role in neuronal development and axonal growth 33, 34 by modulating the assembly of filamentous actin in growth cones 35 and regulating the interaction between microtubule and actin during spindle formation 36. Protein levels of GAP43 decrease in frontal cortex and hippocampus of AD patients but have also previously been observed to increase in CSF 32, 37, 38. GAP43 is secreted into CSF from the brain and has been studied using affinity‐based proteomics in the context of both MS and AD 39. In MS, just as for the PD data presented above, CSF levels were found to decrease with disease progression 22, 40. NRGN is a postsynaptic protein thought to be involved in pathways affecting synaptic plasticity by regulating levels of calmodulin 41. Several independent studies have shown that the CSF concentration of NRGN is increased in AD 42, 43, 44, 45, 46 similarly to the results shown here. Furthermore, the expression pattern seems to be specific for AD 47 and levels of NRGN have also been suggested to predict future cognitive decline, brain atrophy, and reduction in glucose metabolism in the prodromal disease stages 48, 49. Loss of synapses is an early event in AD that can be detected already in MCI patients and correlates well with cognitive dysfunction 38, 50, 51. One could consequently speculate that the increase of GAP43 and NRGN levels demonstrated in previous studies, as well as in the current study, is due to leakage of GAP43 and NRGN into the CSF as a result of synaptic degradation. However, an initial increase of synaptic proteins during the earlier AD stages has been observed and is thought to be part of possible adaptive response to the loss of synapses 52. The increase of GAP43 and NRGN could hence also be an indication of an adaptive response system following the synaptic loss.
In our assay, two independent antibodies targeting different regions of the protein was used to assess the levels of GAP43 in both CSF and cerebral cortex. These antibodies showed highly concordant results, strengthening the data generated in our analysis. For the two synaptic proteins discussed above, we observed similar results in the comparison of patients and controls as well as a positive correlation in CSF protein levels (ρ = 0.52–0.85 for NRGN correlated against both GAP43 antibodies in all four cohorts, data not shown). It has previously been reported that GAP43 and NRGN share sequence similarities 53 and one of the GAP43 antibodies was raised against part of the shared sequence (Supporting Information Fig. 6). Therefore, a sandwich assay was performed in order to investigate potential cross‐reactivity for the two proteins. The assay was performed with all antibodies targeting GAP43 and NRGN as both capture and detection antibodies and the results showed no indication of cross‐reactivity (Supporting Information Fig. 7). Furthermore, an immunocapture MS experiment was performed to confirm the selectivity of the antibodies. All antibodies where shown to capture their intended target with a sequence coverage of identification of 74 and 19% for GAP43 and NRGN, respectively (Supporting Information Fig. 8 and Supporting Information Table 2). The enrichment of GAP43 by HPA013392 and HPA015600 was highly specific and exclusive, whereas HPA038171 captured NRGN together with TBC1D10C, C1QBN, and IgG (L chain) (Supporting Information Fig. 9), which could be due to lower levels of NRGN in CSF compared to GAP43. Nevertheless, together these observations show that the utilized antibodies do not cross‐react and that the measured levels indeed correspond to the intended target in the presented CSF assay.
4.3. Distribution of GAP43 and NRGN in the human cerebral cortex
Immunohistochemistry analysis of brain tissue confirmed a synaptic‐like staining pattern for both GAP43 and NRGN as would be expected based on previous publications. In addition, the NRGN antibody displayed strong staining of pyramidal cells as has also been shown before 54. GAP43 has previously been reported to stain neuronal soma 55, but no such staining could be confirmed in our experiments. This could be due to differences in the used brain regions between this and the aforementioned study as well as which cortical layers that were present in the TMA. Using the current setup, we did not detect a clear difference in staining patterns of neither GAP43 nor NRGN between AD patients and controls. Previous reports indicate a decrease in some regions of AD brains, although these findings have not been replicated in all studies 55, 56. In order to properly assess differential levels of GAP43 and NRGN in brain tissue, analysis of larger brain sections from several patients would have to be performed.
5. Conclusions
This is to our knowledge the first extensive study of brain‐enriched proteins in human CSF. Through the established affinity proteomics platform for protein profiling, we were able to analyze 280 proteins in 441 human samples. This sample throughput enabled comparative profiling both within and between three of our most common neurological disorders and allowed for exploration of protein levels in relation to RNA expression in brain as well as to relevant clinical information.
In this paper, we present a verification of disease‐associated profiles of both GAP43 and NRGN and furthermore strengthen their potential as biomarkers in the context of AD, using two independent sample materials. Besides these two, several of the 280 studied proteins displayed altered levels between samples groups both within AD, PD, and DLB. These proteins are currently undergoing continued evaluation including verification in additional sample collections to establish their potential role in the respective disease contexts. Meanwhile, we believe that the information presented here can greatly contribute to increase in the understanding of brain‐enriched proteins in CSF and their relation to pathological states of the human brain.
The authors declare no conflict of interest.
Supporting information
As a service to our authors and readers, this journal provides supporting information supplied by the authors. Such materials are peer reviewed and may be re‐organized for online delivery, but are not copy‐edited or typeset. Technical support issues arising from supporting information (other than missing files) should be addressed to the authors.
Supplementary table 1. Proteins with correlation to post mortem delay
Supplementary Table 2. Peptides identified through immunocapture mass spectrometry
Supplementary figure 1. Protein class overview of the analyzed proteins
Supplementary figure 2. CSF levels of proteins altered in ventricular post mortem compared to antemortem lumbar samples
Supplementary figure 3. Correlation of protein levels to post mortem delay
Supplementary figure 4. Correlation of antibodies targeting GAP43
Supplementary figure 5. Correlation of GAP43 levels to UPDRS score
Supplementary figure 6. Alignment NRGN and GAP43
Supplementary figure 7. Investigation of cross‐reactivity of GAP43 and NRGN antibodies
Supplementary figure 8. Peptides detected through immunocapture mass spectrometry
Supplementary figure 9. Proteins identified by immunocapture mass spectrometry specifically for GAP43 and NRGN antibodies in respect to negative controls.
Supplementary material
Acknowledgement
The authors wish to thank Björn Hallström for valuable assistance during data analysis. This study was supported by grants from Science for Life Laboratory Stockholm, the ProNova VINN Excellence Centre for Protein Technology (VINNOVA, Swedish Governmental Agency for Innovation Systems), the Knut and Alice Wallenberg Foundation, the Sten and Karin Mörtstedt CBD solutions AB, Stiftelsen för Strategisk Forskning (SSF), ALF, KTH Center for Applied Proteomics financed through the Erling‐Persson Family Foundation, Stockholm Brain Institute, Alzheimerfonden, the Marie‐Curie fellowship from the INSENS/FP7‐PEOPLE‐2013 (607616) framework, and the authors also wish to acknowledge the entire staff of the Human Protein Atlas for their efforts.
*See Addendum for full list of Affiliations.
The article has been changed after first publication.
Colour Online: See the article online to view Fig. 1 in colour.
[The copyright line of this article has been changed since first published on 8 September 2016 from the standard copyright to CC‐BY‐NC‐ND].
6 References
- 1. United Nations, Department of Economic and Social Affairs, Population Division (2015). World Population Ageing 2015 (ST/ESA/SER.A/390).
- 2. Lu, T. , Pan, Y. , Kao, S. Y. , Li, C. et al., Gene regulation and DNA damage in the ageing human brain. Nature 2004, 429, 883–891. [DOI] [PubMed] [Google Scholar]
- 3. Ori, A. , Toyama, B. H. , Harris, M. S. , Bock, T. et al., Integrated transcriptome and proteome analyses reveal organ‐specific proteome deterioration in old rats. Cell Syst. 2015, 1, 224–237. [DOI] [PMC free article] [PubMed] [Google Scholar]
- 4. Pan, S. , Zhu, D. , Quinn, J. F. , Peskind, E. R. et al., A combined dataset of human cerebrospinal fluid proteins identified by multi‐dimensional chromatography and tandem mass spectrometry. Proteomics 2007, 7, 469–473. [DOI] [PubMed] [Google Scholar]
- 5. Blennow, K. , Hampel, H. , Weiner, M. , Zetterberg, H. , Cerebrospinal fluid and plasma biomarkers in Alzheimer disease. Nat. Rev. Neurol. 2010, 6, 131–144. [DOI] [PubMed] [Google Scholar]
- 6. Kroksveen, A. C. , Opsahl, J. A. , Aye, T. T. , Ulvik, R. J. , Berven, F. S. , Proteomics of human cerebrospinal fluid: discovery and verification of biomarker candidates in neurodegenerative diseases using quantitative proteomics. J. Proteomics 2011, 74, 371–388. [DOI] [PubMed] [Google Scholar]
- 7. Regeniter, A. , Kuhle, J. , Mehling, M. , Moller, H. et al., A modern approach to CSF analysis: pathophysiology, clinical application, proof of concept and laboratory reporting. Clin. Neurol. Neurosur. 2009, 111, 313–318. [DOI] [PubMed] [Google Scholar]
- 8. Guldbrandsen, A. , Vethe, H. , Farag, Y. , Oveland, E. et al., In‐depth characterization of the cerebrospinal fluid (CSF) proteome displayed through the CSF proteome resource (CSF‐PR). Mol. Cell. Proteomics 2014, 13, 3152–3163. [DOI] [PMC free article] [PubMed] [Google Scholar]
- 9. Zougman, A. , Pilch, B. , Podtelejnikov, A. , Kiehntopf, M. et al., Integrated analysis of the cerebrospinal fluid peptidome and proteome. J. Proteome Res. 2008, 7, 386–399. [DOI] [PubMed] [Google Scholar]
- 10. Sjostedt, E. , Fagerberg, L. , Hallstrom, B. M. , Haggmark, A. et al., Defining the human brain proteome using transcriptomics and antibody‐based profiling with a focus on the cerebral cortex. PLoS One 2015, 10, e0130028. [DOI] [PMC free article] [PubMed] [Google Scholar]
- 11. Hawrylycz, M. J. , Lein, E. S. , Guillozet‐Bongaarts, A. L. , Shen, E. H. et al., An anatomically comprehensive atlas of the adult human brain transcriptome. Nature 2012, 489, 391–399. [DOI] [PMC free article] [PubMed] [Google Scholar]
- 12. Lonsdale, J. , Thomas, J. , Salvatore, M. , Phillips, R. et al., The genotype‐tissue expression (GTEx) project. Nat. Genet. 2013, 45, 580–585. [DOI] [PMC free article] [PubMed] [Google Scholar]
- 13. Vogel, C. , Marcotte, E. M. , Insights into the regulation of protein abundance from proteomic and transcriptomic analyses. Nat. Rev. Genet. 2012, 13, 227–232. [DOI] [PMC free article] [PubMed] [Google Scholar]
- 14. Frei, A. P. , Bava, F. A. , Zunder, E. R. , Hsieh, E. W. Y. et al., Highly multiplexed simultaneous detection of RNAs and proteins in single cells. Nat. Methods 2016, 13, 269–275. [DOI] [PMC free article] [PubMed] [Google Scholar]
- 15. Uhlen, M. , Fagerberg, L. , Hallstrom, B. M. , Lindskog, C. et al., Proteomics. Tissue‐based map of the human proteome. Science 2015, 347, 1260419. [DOI] [PubMed] [Google Scholar]
- 16. World Health Organization and Alzheimer's Disease International , Dementia: A Public Health Priority, 2012. ISBN: 978 92 4 156445 8.
- 17. Dubois, B. , Feldman, H. H. , Jacova, C. , Hampel, H. et al., Advancing research diagnostic criteria for Alzheimer's disease: the IWG‐2 criteria. Lancet Neurol. 2014, 13, 614–629. [DOI] [PubMed] [Google Scholar]
- 18. Hughes, A. J. , Daniel, S. E. , Kilford, L. , Lees, A. J. , Accuracy of clinical diagnosis of idiopathic Parkinson's disease: a clinico‐pathological study of 100 cases. J. Neurol. Neurosurg. Psychiatry. 1992, 55, 181–184. [DOI] [PMC free article] [PubMed] [Google Scholar]
- 19. Braak, H. , Braak, E. , Neuropathological staging of Alzheimer‐related changes. Acta Neuropathol. 1991, 82, 239–259. [DOI] [PubMed] [Google Scholar]
- 20. Braak, H. , Del Tredici, K. , Rub, U. , de Vos, R. A. I. et al., Staging of brain pathology related to sporadic Parkinson's disease. Neurobiol. Aging 2003, 24, 197–211. [DOI] [PubMed] [Google Scholar]
- 21. Schwenk, J. M. , Gry, M. , Rimini, R. , Uhlen, M. , Nilsson, P. , Antibody suspension bead arrays within serum proteomics. J. Proteome Res. 2008, 7, 3168–3179. [DOI] [PubMed] [Google Scholar]
- 22. Haggmark, A. , Bystrom, S. , Ayoglu, B. , Qundos, U. et al., Antibody‐based profiling of cerebrospinal fluid within multiple sclerosis. Proteomics 2013, 13, 2256–2267. [DOI] [PubMed] [Google Scholar]
- 23. Reiber, H. , Dynamics of brain‐derived proteins in cerebrospinal fluid. Clin. Chim. Acta 2001, 310, 173–186. [DOI] [PubMed] [Google Scholar]
- 24. Aasebø, E. , Opsahl, J. A. , Bjørlykke, Y. , Myhr, K. M. et al., Effects of blood contamination and the rostro‐caudal gradient on the human cerebrospinal fluid proteome. PLoS One 2014, 9, e90429. [DOI] [PMC free article] [PubMed] [Google Scholar]
- 25. Sommer, J. B. , Gaul, C. , Heckmann, J. , Neundorfer, B. , Erbguth, F. J. , Does lumbar cerebrospinal fluid reflect ventricular cerebrospinal fluid? A prospective study in patients with external ventricular drainage. Eur. Neurol. 2002, 47, 224–232. [DOI] [PubMed] [Google Scholar]
- 26. Torres‐Corzo, J. G. , Tapia‐Perez, J. H. , Sanchez‐Aguilar, M. , Della Vecchia, R. R. et al., Comparison of cerebrospinal fluid obtained by ventricular endoscopy and by lumbar puncture in patients with hydrocephalus secondary to neurocysticercosis. Surg. Neurol. 2009, 71, 376–379. [DOI] [PubMed] [Google Scholar]
- 27. Brandner, S. , Thaler, C. , Lewczuk, P. , Lelental, N. et al., Neuroprotein dynamics in the cerebrospinal fluid: intraindividual concomitant ventricular and lumbar measurements. Eur. Neurol. 2013, 70, 189–194. [DOI] [PubMed] [Google Scholar]
- 28. Hynd, M. R. , Lewohl, J. M. , Scott, H. L. , Dodd, P. R. Biochemical and molecular studies using human autopsy brain tissue. J. Neurochem. 2003, 85, 543–562. [DOI] [PubMed] [Google Scholar]
- 29. Finehout, E. J. , Franck, Z. , Relkin, N. , Lee, K. H. , Proteomic analysis of cerebrospinal fluid changes related to postmortem interval. Clin. Chem. 2006, 52, 1906–1913. [DOI] [PubMed] [Google Scholar]
- 30. Fahn, S. , Elton R. L., Committee, U. D. , The unified Parkinson's disease rating scale, in: Fahn S, Marsden C. D., Calne D. B., Goldstein M. (Eds.), Recent Developments in Parkinson's Disease, Vol 2. Florham Park, NJ. Macmillan Healthcare Information; 1987, pp. 153–163, 293–304. [Google Scholar]
- 31. Lees, A. J. , Hardy, J. , Revesz, T. , Parkinson's disease. Lancet 2009, 373, 2055–2066. [DOI] [PubMed] [Google Scholar]
- 32. Sjogren, M. , Minthon, L. , Davidsson, P. , Granerus, A. K. et al., CSF levels of tau, beta‐amyloid(1‐42) and GAP‐43 in frontotemporal dementia, other types of dementia and normal aging. J. Neural. Transm. (Vienna) 2000, 107, 563–579. [DOI] [PubMed] [Google Scholar]
- 33. Benowitz, L. I. , Routtenberg, A. , GAP‐43: an intrinsic determinant of neuronal development and plasticity. Trends Neurosci. 1997, 20, 84–91. [DOI] [PubMed] [Google Scholar]
- 34. Oestreicher, A. B. , De Graan, P. N. E. , Gispen, W. H. , Verhaagen, J. , Schrama, L. H. , B‐50, the growth associated protein‐43: Modulation of cell morphology and communication in the nervous system. Prog. Neurobiol. 1997, 53, 627–686. [DOI] [PubMed] [Google Scholar]
- 35. Caroni, P. , Actin cytoskeleton regulation through modulation of PI(4,5)P‐2 rafts. EMBO J. 2001, 20, 4332–4336. [DOI] [PMC free article] [PubMed] [Google Scholar]
- 36. Mishra, R. , Gupta, S. K. , Meiri, K. F. , Fong, M. et al., GAP‐43 is key to mitotic spindle control and centrosome‐based polarization in neurons. Cell Cycle 2008, 7, 348–357. [DOI] [PubMed] [Google Scholar]
- 37. Sjogren, M. , Davidsson, P. , Gottfries, J. , Vanderstichele, H. et al., The cerebrospinal fluid levels of tau, growth‐associated protein‐43 and soluble amyloid precursor protein correlate in Alzheimer's disease, reflecting a common pathophysiological process. Dement. Geriatr. Cogn. 2001, 12, 257–264. [DOI] [PubMed] [Google Scholar]
- 38. Masliah, E. , Mallory, M. , Alford, M. , DeTeresa, R. et al., Altered expression of synaptic proteins occurs early during progression of Alzheimer's disease. Neurology 2001, 56, 127–129. [DOI] [PubMed] [Google Scholar]
- 39. Davidsson, P. , Puchades, M. , Blennow, K. , Identification of synaptic vesicle, pre‐ and postsynaptic proteins in human cerebrospinal fluid using liquid‐phase isoelectric focusing. Electrophoresis 1999, 20, 431–437. [DOI] [PubMed] [Google Scholar]
- 40. Bystrom, S. , Ayoglu, B. , Haggmark, A. , Mitsios, N. et al., Affinity proteomic profiling of plasma, cerebrospinal fluid, and brain tissue within multiple sclerosis. J. Proteome Res. 2014, 13, 4607–4619. [DOI] [PubMed] [Google Scholar]
- 41. Pak, J. H. , Huang, F. L. , Li, J. , Balschun, D. et al., Involvement of neurogranin in the modulation of calcium/calmodulin‐dependent protein kinase II, synaptic plasticity, and spatial learning: a study with knockout mice. Proc. Natl. Acad. Sci. USA 2000, 97, 11232–11237. [DOI] [PMC free article] [PubMed] [Google Scholar]
- 42. Thorsell, A. , Bjerke, M. , Gobom, J. , Brunhage, E. et al., Neurogranin in cerebrospinal fluid as a marker of synaptic degeneration in Alzheimer's disease. Brain Res. 2010, 1362, 13–22. [DOI] [PubMed] [Google Scholar]
- 43. Kvartsberg, H. , Duits, F. H. , Ingelsson, M. , Andreasen, N. et al., Cerebrospinal fluid levels of the synaptic protein neurogranin correlates with cognitive decline in prodromal Alzheimer's disease. Alzheimers Dement. 2015, 11, 1180–1190. [DOI] [PubMed] [Google Scholar]
- 44. Kvartsberg, H. , Portelius, E. , Andreasson, U. , Brinkmalm, G. et al., Characterization of the postsynaptic protein neurogranin in paired cerebrospinal fluid and plasma samples from Alzheimer's disease patients and healthy controls. Alzheimers Res. Ther. 2015, 7, 1–9. [DOI] [PMC free article] [PubMed] [Google Scholar]
- 45. Hellwig, K. , Kvartsberg, H. , Portelius, E. , Andreasson, U. et al., Neurogranin and YKL‐40: independent markers of synaptic degeneration and neuroinflammation in Alzheimer's disease. Alzheimers Res. Ther. 2015, 7, 1–8. [DOI] [PMC free article] [PubMed] [Google Scholar]
- 46. Kester, M. I. , Teunissen, C. E. , Crimmins, D. L. , Herries, E. M. et al., Neurogranin as a cerebrospinal fluid biomarker for synaptic loss in symptomatic Alzheimer disease. JAMA Neurol. 2015, 72, 1275–1280. [DOI] [PMC free article] [PubMed] [Google Scholar]
- 47. Wellington, H. , Paterson, R. W. , Portelius, E. , Tornqvist, U. et al., Increased CSF neurogranin concentration is specific to Alzheimer disease. Neurology 2016, 86, 829–835. [DOI] [PMC free article] [PubMed] [Google Scholar]
- 48. Portelius, E. , Zetterberg, H. , Skillback, T. , Tornqvist, U. et al., Cerebrospinal fluid neurogranin: relation to cognition and neurodegeneration in Alzheimer's disease. Brain 2015, 138, 3373–3385. [DOI] [PMC free article] [PubMed] [Google Scholar]
- 49. Tarawneh, R. , D'Angelo, G. , Crimmins, D. , Herries, E. et al., Diagnostic and prognostic utility of the synaptic marker neurogranin in Alzheimer disease. JAMA Neurol. 2016, 73, 561–571. [DOI] [PMC free article] [PubMed] [Google Scholar]
- 50. Arendt, T. , Bruckner, M. K. , Linking cell‐cycle dysfunction in Alzheimer's disease to a failure of synaptic plasticity. Biochim. Biophys. Acta 2007, 1772, 413–421. [DOI] [PubMed] [Google Scholar]
- 51. Scheff, S. W. , Price, D. A. , Schmitt, F. A. , DeKosky, S. T. , Mufson, E. J. , Synaptic alterations in CA1 in mild Alzheimer disease and mild cognitive impairment. Neurology 2007, 68, 1501–1508. [DOI] [PubMed] [Google Scholar]
- 52. Mukaetova‐Ladinska, E. B. , Garcia‐Siera, F. , Hurt, J. , Gertz, H. J. et al., Staging of cytoskeletal and beta‐amyloid changes in human isocortex reveals biphasic synaptic protein response during progression of Alzheimer's disease. Am. J. Pathol. 2000, 157, 623–636. [DOI] [PMC free article] [PubMed] [Google Scholar]
- 53. Baudier, J. , Deloulme, J. C. , Van Dorsselaer, A. , Black, D. , Matthes, H. W. , Purification and characterization of a brain‐specific protein kinase C substrate, neurogranin (p17). Identification of a consensus amino acid sequence between neurogranin and neuromodulin (GAP43) that corresponds to the protein kinase C phosphorylation site and the calmodulin‐binding domain. J. Biol. Chem. 1991, 266, 229–237. [PubMed] [Google Scholar]
- 54. Represa, A. , Deloulme, J. C. , Sensenbrenner, M. , Ben‐Ari, Y. , Baudier, J. , Neurogranin: immunocytochemical localization of a brain‐specific protein kinase C substrate. J. Neurosci. 1990, 10, 3782–3792. [DOI] [PMC free article] [PubMed] [Google Scholar]
- 55. Bogdanovic, N. , Davidsson, P. , Volkmann, I. , Winblad, B. , Blennow, K. , Growth‐associated protein GAP‐43 in the frontal cortex and in the hippocampus in Alzheimer's disease: an immunohistochemical and quantitative study. J. Neural. Transm. (Vienna) 2000, 107, 463–478. [DOI] [PubMed] [Google Scholar]
- 56. Davidsson, P. , Blennow, K. , Neurochemical dissection of synaptic pathology in Alzheimer's disease. Int. Psychogeriatr. 1998, 10, 11–23. [DOI] [PubMed] [Google Scholar]
Associated Data
This section collects any data citations, data availability statements, or supplementary materials included in this article.
Supplementary Materials
As a service to our authors and readers, this journal provides supporting information supplied by the authors. Such materials are peer reviewed and may be re‐organized for online delivery, but are not copy‐edited or typeset. Technical support issues arising from supporting information (other than missing files) should be addressed to the authors.
Supplementary table 1. Proteins with correlation to post mortem delay
Supplementary Table 2. Peptides identified through immunocapture mass spectrometry
Supplementary figure 1. Protein class overview of the analyzed proteins
Supplementary figure 2. CSF levels of proteins altered in ventricular post mortem compared to antemortem lumbar samples
Supplementary figure 3. Correlation of protein levels to post mortem delay
Supplementary figure 4. Correlation of antibodies targeting GAP43
Supplementary figure 5. Correlation of GAP43 levels to UPDRS score
Supplementary figure 6. Alignment NRGN and GAP43
Supplementary figure 7. Investigation of cross‐reactivity of GAP43 and NRGN antibodies
Supplementary figure 8. Peptides detected through immunocapture mass spectrometry
Supplementary figure 9. Proteins identified by immunocapture mass spectrometry specifically for GAP43 and NRGN antibodies in respect to negative controls.
Supplementary material