Abstract
The Centers for Medicare & Medicaid Services (CMS) uses the resource-based relative value scale to pay physicians and other practitioners for professional services. The work values measure the relative levels of professional time and intensity (physical effort, skills, and stress) associated with providing services. CMS asked RAND to develop a model to validate the work values using external data sources. RAND's goal was to test the feasibility of using external data and regression analysis to create prediction models to validate work values. Data availability limited the models to surgical procedures and selected medical procedures typically performed in an operating room. Key findings from the study include the following: RAND estimates of intra-service time using external data are typically shorter than the current CMS estimates. Model assumptions about how shorter intra-service times affect procedure intensity have implications for the work estimates. RAND estimates for work on average were similar to current work values if shorter intra-service time is assumed to increase procedure intensity and were on average up to 10 percent lower than current work values if shorter intra-service time is assumed to not impact on procedure intensity. The RAND estimates could be used for two key applications: CMS could flag codes as potentially misvalued if the RAND estimates are notably different from the current CMS values. CMS could also use the RAND estimates as an independent estimate of the work values. In some cases, further review will identify a clinical rationale for why a code is valued differently than the RAND model predictions.
The Centers for Medicare & Medicaid Services (CMS) uses the resource-based relative value scale (RBRVS) to pay physicians and nonphysician practitioners for their professional services.* Under RBRVS, payment for a specific service is broken into three elements: physician work, practice expense, and malpractice expense. Concerns have been raised about the current process used by CMS to value physician work. Section 3134 of the Affordable Care Act required that CMS establish a process to validate the physician work associated with medical services. CMS asked RAND to develop a validation model for physician work values. This project was designed to describe the methodological issues and limitations involved in developing such a model.
The RBRVS system provides a total work relative value unit (RVU) for each procedure. The total work RVU for a procedure is composed of four components: (1) pre-service work (for example, positioning prior to surgery), intra-service work (the performance of the procedure or “skin-to-skin” time), (3) immediate post-service (for example, management of a patient in the post-operative period), and (4) post-operative evaluation and management (E&M) visits (only applicable for surgical procedures paid on a global period). One can calculate total work RVUs by summing each of the four components together, which has been termed the building block method (BBM), as illustrated in the following formula.
“Total Work RVUs” = ”Pre-service work” + ”Intra-service work” + “Immediate post-service work” + ”Post-operative E&M visit work”
Each of these four work components can be broken down further as a function of time and intensity. For example, intra-service work can be divided into intra-service time and intra-service work per unit time (IWPUT) (intensity). This is illustrated in the following two formulas.
“Intra-service work” = ”Intra-service time” × “IWPUT”
“IWPUT” = ”Intra-service work” / ”Intra-service time”
RAND's goal in this project is to test the feasibility of using data from external data sources and regression analysis to create prediction models to validate work RVUs. We believe the RAND model estimates could be used for two key applications. First, CMS could flag codes as potentially misvalued if the CMS and RAND model estimates are notably different. Second, CMS could also use the RAND estimates as an independent estimate of the work RVUs to consider when assessing a RUC recommendation. In some cases, further review will identify a clinical rationale for why a code is valued differently than the RAND model predictions and the CMS estimate or RUC recommendation is appropriate. In other cases, the RAND validation model results will highlight that the code was not valued accurately.
The data sets that are available to us for this project have data on intra-service time for surgical and selected medical procedures, such as interventional cardiology procedures, that are provided in hospital inpatient and outpatient settings and in ambulatory surgical centers. Our analyses focus on approximately 3,000 procedures that are often performed in an operating room setting.
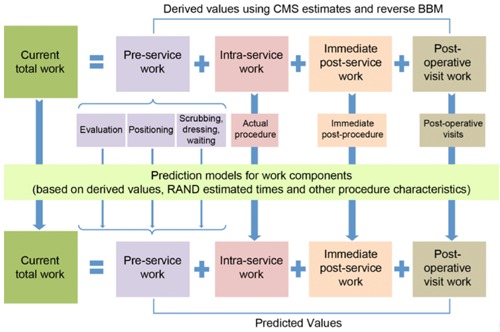
Figure 1 provides an overview of the three overall steps in our modeling process. First, using current CMS estimates and a “reverse” BBM, we calculate for each of the four components the work, time, and intensity associated with performing each procedure. When applicable, we make corrections to these values when they do not have face validity. For example, we make a correction for procedures with negative or implausibly low intra-service work.
Figure 1.

Overview of Modeling Approach
Second, using data from CMS and other sources, we measure 16 characteristics of the procedure. These include mortality rate after the procedure, the least-resource-intensive setting in which Medicare covers the service (i.e., inpatient, outpatient, ambulatory surgical center, office), the setting in which the procedure is typically or most often performed, and average years of training among practitioners who perform the procedure. One key characteristic that we capture using external databases is the intra-service time.
Third, we use regression analysis to build prediction models for the four work components. We use the results from the regression analyses to estimate values for each procedure and then use the BBM to combine the values for each work component into an estimate for total work RVUs. We also use a single prediction model to predict total work directly. The modeling process is complex, and we are cognizant that there are many options we could pursue at different steps. For example, should the models reflect the place of service where the procedure is typically performed, or should they reflect all the places of service where the procedure is performed? How should changes in the time required to perform a procedure affect intra-service work? To understand the impact of these methodological issues, we have created prediction models that reflect different choices:
-
Model 1 estimates total work for the “typical” setting in which the procedure is performed using the BBM.
-
▪
Model 1a assumes that changes in intra-service times do not affect intra-service work (i.e., changes in intra-service time are offset by changes in intensity).
-
▪
Model 1b is a blend of Model 1a and Model 1c.
-
▪
Model 1c assumes that changes in intra-service times affect intra-service work (i.e., changes in intra-service time do not affect intensity).
-
▪
Model 2 estimates total work for all places of service in which the procedure is performed in our data and assumes that changes in intra-service times do not affect intra-service work.
Model 3 uses a single prediction model to predict total work directly.
There were five key findings from our analyses of the RAND model estimates:
RAND estimates of intra-service time using data in external datasets are typically shorter than the current CMS estimates. For 83 percent of the procedures, the RAND time is shorter than the CMS estimates. The difference in time varies by where the procedure is performed. For example, on average, inpatient procedures are 6 percent shorter than CMS estimates, while procedures done outside the hospital with anesthesia are 20 percent shorter than CMS estimates. These results are consistent with previous research that has found that CMS time estimates are on average longer than observed times found in empirical datasets.
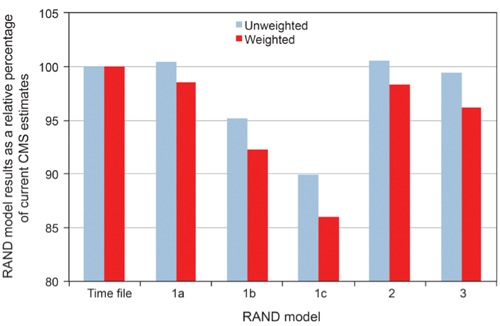
Total work in RAND models is similar to CMS estimates, but there are important differences for some procedures. When surgical services are unweighted by surgical volume, the average total work in RAND Models 1a, 2, and 3 and CMS total work are nearly identical, while the average RVUs for Models 1b and Model 1c are 4.8 percent and 10.0 percent lower, respectively, than the CMS average (Figure 2). While on average the valuations of surgical procedures are similar in Model 1a, there are notable differences across the types of procedures. For example, for shorter procedures (0–30 minutes), the work estimates are 14.6 percent higher than CMS estimates, while for longer procedures (<120 minutes) the work estimates are 2.7 percent lower.
The difference in total RVUs across RBRVS is greater than the average difference across procedures. The average difference between current CMS and predicted RAND values can be summarized using unweighted estimates (average difference across all procedures) or weighted estimates (the differences for high-volume procedures have a greater impact). The difference between unweighted and weighted results is important because the weighted estimates capture what would be paid by Medicare. For several models there are notable differences between the weighted and unweighted results. For example, the average total work RVUs under Model 1c as a percentage of CMS values are 90 percent and 86 percent (unweighted and weighted, respectively). There is a greater reduction in the weighted results because high-Medicare-volume procedures have higher reductions on average in the intra-service work component than low-volume procedures.
Corrections reduce post-operative E&M visit work by 10 percent. Post-operative visits on average make up 41 percent of total work among the procedures we focused on in this analysis. For a subset of procedures, we identified anomalies in the data. For example, we identified procedures for which there were inpatient E&M visits included in the global period, but the procedure is typically performed outside the hospital. These corrections reduced the unweighted average number of post-operative work RVUs by 10 percent.
The difference between the CMS estimates and the RAND estimates for IWPUT and intra-service work varies across the models. RAND estimates of intra-service time, which are based on data in external datasets, are typically shorter than the current CMS estimates. The implications of this decrease in time on IWPUT and therefore intra-service work vary under the RAND models. Under Models 1a and 2, intra-service work stays constant, intra-service time goes down, and therefore IWPUT increases. Under Model 1c, IWPUT stays the same, intra-service time is lower, and therefore intra-service work is reduced. This reduction in intra-service work is the primary reason total work under Model 1c is also reduced.
Figure 2.

Mean Total Work RVUs Predicted by Models Relative to CMS Values
The results presented should be considered exploratory analyses that examine the overall feasibility of the model and the sensitivity of the model results to alternative methodological approaches and assumptions.
This study was funded by the Centers for Medicare & Medicaid Services. This research was conducted in RAND Health, a division of the RAND Corporation.
Note
For simplicity, we use the terms “physician fee schedule” and “physician” throughout this article. However, the fee schedule also applies to Part B covered services furnished by certain other practitioners under their scope of practice—for example, nurse practitioners, clinical social workers, clinical psychologists, physical therapists, and others.


