

Abstract
Computational functional group mapping (cFGM) is emerging as a high-impact complement to existing widely used experimental and computational structure-based drug discovery methods. cFGM provides comprehensive atomic-resolution 3D maps of the affinity of functional groups that can constitute drug-like molecules for a given target, typically a protein. These 3D maps can be intuitively and interactively visualized by medicinal chemists to rapidly design synthetically accessible ligands. Given that the maps can inform selection of functional groups for affinity, specificity, and pharmacokinetic properties, they are of utility for both the optimization of existing drug candidates and creating novel ones. Here, I review recent advances in cFGM with emphasis on the unique information content in the approach that offers the potential of broadly facilitating structure-based ligand design.
Keywords: co-solvent mapping, ligand mapping, MixMD, SILCS, molecular dynamics, protein flexibility
Introduction
The design of small molecules that bind with optimal specificity and affinity to their biological targets, typically proteins, is based on the idea of complementarity between the functional groups in a small molecule and the binding site of the target. The complementarity arises from fundamental physical interactions, such as hydrogen bonds, salt bridges, and hydrophobic association. This basic intuitive idea suggests another one: ‘functional group mapping’ (FGM), which is simply to make a map, for each functional group, of the regions in the vicinity of the target surface with which that functional group preferentially binds. With such a map in hand for each functional group in their synthetic palette, medicinal chemists can focus their efforts on designing small molecules that best match the maps. Ideally, FGM should consider not only the target surface as seen in an atomic-resolution crystal structure, but also inducible pockets resulting from the combination of target flexibility and functional group binding [1]. With such complete information, the medicinal chemist could design the most efficacious small molecule for a binding site on the target protein.
Experimental FGM
There have been numerous experimental and computational approaches to FGM. One approach that can be considered FGM is the synthesis and testing of a series of similar drug-like molecules. This approach, resulting in a structure–activity relation (SAR), can reveal which functional groups have beneficial interactions with the target. The SAR approach can be extended to include 3D information about the drug-like molecules in the series in a quantitative manner (3D-QSAR) [2,3]. Based on the assumption that the molecules bind in the same pose, one can deduce which functional groups at what locations interact best with what parts of the target binding site, and this approach can be particularly powerful given a known binding pose in the context of the target [4]. The results can be used as a map to guide the creation of new compounds with improved efficacy or to scaffold-hop to other compounds with similar 3D placement of the relevant functional groups [5–7]. Another FGM approach involves testing the ability of small, simple compounds (molecular weight 100–300 Da) to bind to a target. These compounds are sufficiently small as to have limited internal degrees of conformational freedom, and often correspond to a single functional group that might occur in a drug-like molecule making them, in a sense, ‘fragments’ of drug-like molecules. Fragments can be screened in high-concentration bioassays with nuclear magnetic resonance (NMR)-based hit confirmation followed by X-ray structure determination of target–fragment complexes to determine the binding poses of hits [8–12]. Using the known binding poses of several fragments, medicinal chemists can synthetically link fragments together into a drug-like molecule and then test this molecule for selectivity and affinity, a process commonly referred to as ‘fragment-based drug design’ (FBDD) [13–15].
Computational FGM
The above SAR-based approaches, by their very design, combine experimental data with computational modeling. By contrast, target-based computational approaches have evolved in parallel with experimental fragment-based FGM. The earliest of these purely cFGM approaches date back to the earliest days of computer-aided drug design (CADD) and, therefore, the following is necessarily only a partial list: (i) GRID, where the interaction energy between a probe group (e.g., methyl) and the target is computed on a grid encompassing the binding site to give an array of energy values that can be displayed as contour surfaces [16]; (ii) MCSS, where multiple non-interacting fragments are energy minimized or quenched in the presence of the target to determine optimal binding poses [17]; (iii) FTMAP, which combines a grid approach with determination of low-energy conformations of fragments and clustering to determine favorable binding sites [18,19]; (iv) alchemical transformation, where the free energy of morphing one functional group into another is computed, either in a discrete (e.g., free energy perturbation or thermodynamic integration) or continuous (e.g., lambda dynamics) manner [20–22]; (v) WaterMap, which determines the locations and thermodynamic properties of water molecules that solvate protein-binding sites [23]; and (vi) ligand or co-solvent mapping simulations, which determine the locations of fragment molecules that can occupy protein-binding sites [24–28].
The benefits of using computational approaches are well known: they have the potential to save time, materials, and labor. Their main liability is also well known: the reliability of the results depends on the accuracy of the computational model and the need for adequate conformational sampling [29–32]. Therefore, a key driver of computational methods development is to retain the benefits while increasing the reliability. Much of these developments have been enabled by the steady improvement in computing hardware and algorithms [33,34] along with the maturation of all-atom explicit-solvent force fields [31,35,36]. These developments allow for the routine modeling of systems of relevant size, including explicit solvent, into the microsecond timescale using molecular dynamics (MD) simulation.
cFGM with all-atom explicit-solvent MD
The application of all-atom explicit-solvent MD brings two key improvements in reliability to cFGM. The first is the discrete nature of molecular water, which allows for water to explicitly compete with functional groups, to act as a bridging molecule in enclosed spaces, and to contribute to the hydrophobic effect. The second is that target flexibility is naturally incorporated as the system samples thermally accessible conformations and, therefore, inducible pockets that are not evident from analysis of crystallographic structures. Thus, two key challenges in cFGM and in CADD in general (solvation effects and target flexibility) are accounted for in a physically rigorous fashion. Reflecting this, of the cFGM approaches listed above, both (v) and (vi) use the all-atom explicit-solvent MD framework, and (iv) is increasingly used in this framework. The remainder of this brief review focuses on approach (vi), because it is the closest analog to experimental fragment-based FGM and has seen many developments in recent years.
cFGM involving all-atom explicit-solvent MD includes co-solvent [24], ‘MixMD’ [27], Site-Identification by Ligand Competitive Saturation (‘SILCS’) [25], and related methods [26,28]. Using a single solute, such as isopropanol [24], acetonitrile [27], or chlorobenzene [37], in an aqueous solution provides functional group maps for that particular solute. It is also possible to use multiple fragments in the same simulation, each representing different functional groups [25,28,38]. This allows one to generate maps for, for example, hydrogen bond donors, hydrogen bond acceptors, aliphatic groups, aromatic groups, cations, and anions all from a single simulation. A more recent development is the application of sophisticated sampling methods to target buried or occluded pockets [39–41].
Advantages to cFGM with all-atom explicit-solvent MD
There are three scientific advantages to cFGM using all-atom explicit-solvent MD simulations over experimental methods. The first is the possibility of detecting low-affinity binding regions. Given that an MD trajectory captures not only long-lasting, but also fleeting interactions between fragments and the target, low-affinity binding regions, including their specific locations on the target, are detectable. The second advantage is an outcome from the first: the FGM for all functional groups are present for all regions of the entire target structure. For example, while a particular region might favor a hydrogen-bond donor, analysis of the FGMs might reveal that an aliphatic functional group can also favorably occupy that same region, information that is of high value to a medicinal chemist. A third is the ability to prevent aggregation of hydrophobic fragments and fragment-induced denaturation of the target. Ligand aggregation and target denaturation in experimental binding assays can lead to false positives or negatives [42,43] Several different approaches have been described for preventing target denaturation, including the use of weak restraining potentials on the target atoms (while still retaining e.g., full side-chain and loop flexibility) [25,44], limiting simulation timescales to below the kinetic limit for denaturation [27], and postsimulation analysis and exclusion of trajectory snapshots in which the target has denatured [44]. A novel approach to preventing aggregation has been described in the context of SILCS [25]. There, an additional interaction site is added to each fragment and serves to repel fragments that get within contact distance while all other interactions in the system are left unperturbed. Therefore, cFGM can be scientifically advantageous over experimental approaches when mapping denaturing or hydrophobic functional groups.
An additional benefit of cFGM in the all-atom explicit-solvent MD framework is the easy, intuitive way in which data can be visualized to guide small-molecule design. The simulation trajectory data can be converted to 3D maps, where binding probability p is determined as a function of x, y, z location for each point around the entire target structure. Using a grid resolution of ∼1 Å results in fine-grained maps (see [45] for a sample workflow) that can be displayed using existing standard file formats (e.g., CCP4 [46], as used for crystallographic electron densities, or AutoDock [47], as used for docking grids). Therefore, the 3D map for each functional group (i.e., the FGMs) can be loaded and viewed with the crystal structure of the target (Figure 1). Given that standard molecular visualization programs permit interactive adjustment of the contour level for p(x, y, z) data, the medicinal or computational chemist can adjust the contour level while rotating the system to see all regions with some binding, or regions with only high-affinity binding, or even unfavorable binding regions. Notably, the experimentally determined coordinates for a molecule bound to the target can be overlaid on the FGMs, because the FGMs themselves are ligand independent. The chemist can then zoom in on the area of interest and use the visual information in a qualitative manner to either plan extensions to a known molecule or design entirely new compounds (Figure 2).
Figure 1.
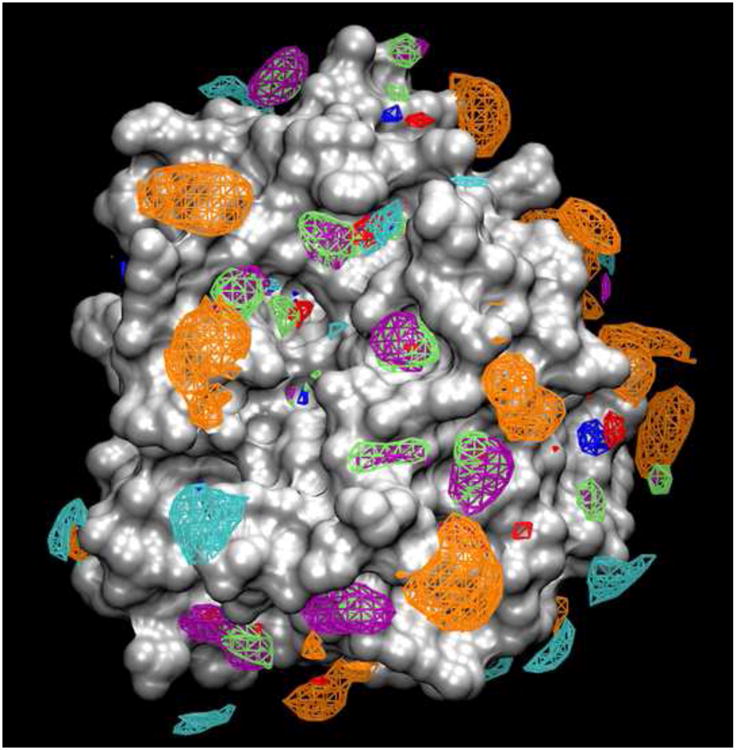
Computational functional group mapping (cFGM) of Factor Xa using the SILCS methodology (data available for free download at silcsbio.com). Maps are for benzene (purple), propane (green), neutral hydrogen bond donors (blue), neutral hydrogen bond acceptors (red), methylammonium (cyan), and acetate (orange).
Figure 2.
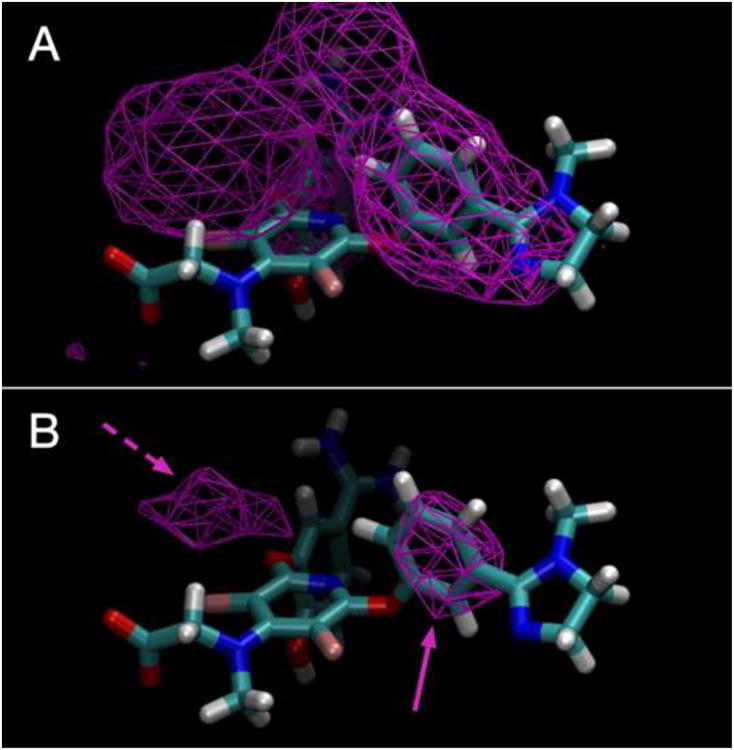
Overlay of benzene functional group map from Figure 1 (main text) with a known Factor Xa ligand in its crystallographic binding pose. Contours have been adjusted to show both (A) low-affinity and (B) high-affinity benzene binding. The solid-purple arrow shows an area that the mapping confirms is important for ligand binding, and the dashed-purple arrow shows an area for possible extension of the ligand through the addition of an aromatic functional group.
Quantitative application
In addition to the direct, interactive, intuitive qualitative application of 3D functional group maps, automated, quantitative applications also exist. One example is to use the maps to generate 3D pharmacophore models [48,49]. These can then be applied using existing standard virtual database screening tools to identify compounds. Another example is the direct use of the maps as scoring functions for in silico docking and pose refinement. Importantly, the scoring function can be expressed in units of free energy, ΔG, using the simple, theoretically exact relation ΔG = -RTln(p) [28,50]. This has the additional benefit of discriminating fragment poses that are most likely to be retained upon fragment elaboration into larger ligands because of the relation between fragment-binding free energy and conservation of binding pose [51]. Notably, because the FGMs are precomputed, docking and scoring can be performed in a rapid fashion as required for iterative ligand design. Alternatively, MD snapshots of target-fragment complexes can be used in a much more rapidly computed alternative to traditional alchemical transformation [(iv) above] [52].
Concluding remarks
All-atom explicit-solvent MD cFGM approaches are becoming increasingly better characterized and more applied [28,53–60]. This emerging cFGM methodology offers medicinal chemists an intuitively and visually accessible tool to facilitate ligand design, and the method can be extended to perform quantitative estimates of relative ligand affinity. Therefore, I expect cFGM to become a routine complement to the existing workflow of industrial medicinal and computational chemists.
Highlights.
Computational functional group mapping (cFGM) shows groups binding best to a target
cFGM provides comprehensive atomic-resolution three-dimensional (3D) information
Maps are intuitively visualized with a target structure to guide drug discovery
cFGM using molecular dynamics accounts for target flexibility and desolvation
Acknowledgments
O.G. was funded by National Institutes of Health grant R43GM109635 to SilcsBio, LCC
Footnotes
Teaser: Rapidly creating novel, synthetically accessible ligands is greatly facilitated by recent advances in computational functional group mapping that provide 3D maps for intuitive, interactive design by medicinal chemists.
Conflicts of interest: O.G. is a co-inventor of the SILCS cFGM technology, and is managing director and a co-owner of SilcsBio, LLC, which is commercializing this technology.
References
- 1.Johnson DK, Karanicolas J. Druggable protein interaction sites are more predisposed to surface pocket formation than the rest of the protein surface. PLoS Comput Biol. 2013;9:e1002951. doi: 10.1371/journal.pcbi.1002951. [DOI] [PMC free article] [PubMed] [Google Scholar]
- 2.Potemkin V, Grishina M. Principles for 3D/4D QSAR classification of drugs. Drug Discov Today. 2008;13:952–959. doi: 10.1016/j.drudis.2008.07.006. [DOI] [PubMed] [Google Scholar]
- 3.Wang T, et al. Quantitative structure-activity relationship: promising advances in drug discovery platforms. Expert Opin Drug Discov. 2015;10:1283–1300. doi: 10.1517/17460441.2015.1083006. [DOI] [PubMed] [Google Scholar]
- 4.Fang C, Xiao Z. Receptor-based 3D-QSAR in drug design: methods and applications in kinase studies. Curr Top Med Chem. 2015;16:1463–1477. doi: 10.2174/1568026615666150915120943. [DOI] [PubMed] [Google Scholar]
- 5.Tresadern G, Bemporad D. Modeling approaches for ligand-based 3D similarity. Future Med Chem. 2010;2:1547–1561. doi: 10.4155/fmc.10.244. [DOI] [PubMed] [Google Scholar]
- 6.Verma J, et al. 3D-QSAR in drug design--a review. Curr Top Med Chem. 2010;10:95–115. doi: 10.2174/156802610790232260. [DOI] [PubMed] [Google Scholar]
- 7.Sun H, et al. Classification of scaffold-hopping approaches. Drug Discov Today. 2012;17:310–324. doi: 10.1016/j.drudis.2011.10.024. [DOI] [PMC free article] [PubMed] [Google Scholar]
- 8.Hesterkamp T, Whittaker M. Fragment-based activity space: smaller is better. Curr Opin Chem Biol. 2008;12:260–268. doi: 10.1016/j.cbpa.2008.02.005. [DOI] [PubMed] [Google Scholar]
- 9.Davies TG, Tickle IJ. Fragment screening using X-ray crystallography. Top Curr Chem. 2012;317:33–59. doi: 10.1007/128_2011_179. [DOI] [PubMed] [Google Scholar]
- 10.Allen KN, et al. An experimental approach to mapping the binding surfaces of crystalline proteins. J Phys Chem. 1996;100:2605–2611. [Google Scholar]
- 11.Mattos C, Ringe D. Locating and characterizing binding sites on proteins. Nat Biotechnol. 1996;14:595–599. doi: 10.1038/nbt0596-595. [DOI] [PubMed] [Google Scholar]
- 12.Liepinsh E, Otting G. Organic solvents identify specific ligand binding sites on protein surfaces. Nat Biotechnol. 1997;15:264–268. doi: 10.1038/nbt0397-264. [DOI] [PubMed] [Google Scholar]
- 13.Hennig M, et al. Combining biophysical screening and X-ray crystallography for fragment-based drug discovery. Top Curr Chem. 2012;317:115–143. doi: 10.1007/128_2011_225. [DOI] [PubMed] [Google Scholar]
- 14.Erlanson DA. Introduction to fragment-based drug discovery. Top Curr Chem. 2012;317:1–32. doi: 10.1007/128_2011_180. [DOI] [PubMed] [Google Scholar]
- 15.Scott DE, et al. Fragment-based approaches in drug discovery and chemical biology. Biochemistry. 2012;51:4990–5003. doi: 10.1021/bi3005126. [DOI] [PubMed] [Google Scholar]
- 16.Goodford PJ. A computational procedure for determining energetically favorable binding sites on biologically important macromolecules. J Med Chem. 1985;28:849–857. doi: 10.1021/jm00145a002. [DOI] [PubMed] [Google Scholar]
- 17.Miranker A, Karplus M. Functionality maps of binding-sites - a multiple copy simultaneous search method. Proteins. 1991;11:29–34. doi: 10.1002/prot.340110104. [DOI] [PubMed] [Google Scholar]
- 18.Ngan CH, et al. FTMAP: extended protein mapping with user-selected probe molecules. Nucleic Acids Res. 2012;40:W271–275. doi: 10.1093/nar/gks441. [DOI] [PMC free article] [PubMed] [Google Scholar]
- 19.Dennis S, et al. Computational mapping identifies the binding sites of organic solvents on proteins. Proc Natl Acad Sci U S A. 2002;99:4290–4295. doi: 10.1073/pnas.062398499. [DOI] [PMC free article] [PubMed] [Google Scholar]
- 20.Knight JL, Brooks CL., 3rd Lambda-dynamics free energy simulation methods. J Comput Chem. 2009;30:1692–1700. doi: 10.1002/jcc.21295. [DOI] [PMC free article] [PubMed] [Google Scholar]
- 21.Reddy MR, et al. Free energy calculations to estimate ligand-binding affinities in structure-based drug design. Curr Pharm Des. 2014;20:3323–3337. doi: 10.2174/13816128113199990604. [DOI] [PubMed] [Google Scholar]
- 22.Gilson MK, Zhou HX. Calculation of protein-ligand binding affinities. Annu Rev Biophys Biomol Struct. 2007;36:21–42. doi: 10.1146/annurev.biophys.36.040306.132550. [DOI] [PubMed] [Google Scholar]
- 23.Young T, et al. Motifs for molecular recognition exploiting hydrophobic enclosure in protein-ligand binding. Proc Natl Acad Sci U S A. 2007;104:808–813. doi: 10.1073/pnas.0610202104. [DOI] [PMC free article] [PubMed] [Google Scholar]
- 24.Seco J, et al. Binding site detection and druggability index from first principles. J Med Chem. 2009;52:2363–2371. doi: 10.1021/jm801385d. [DOI] [PubMed] [Google Scholar]
- 25.Guvench O, MacKerell AD., Jr Computational fragment-based binding site identification by ligand competitive saturation. PLoS Comput Biol. 2009;5:e1000435. doi: 10.1371/journal.pcbi.1000435. [DOI] [PMC free article] [PubMed] [Google Scholar]
- 26.Yang CY, Wang S. Computational analysis of protein hotspots. ACS Med Chem Lett. 2010;1:125–129. doi: 10.1021/ml100026a. [DOI] [PMC free article] [PubMed] [Google Scholar]
- 27.Lexa KW, Carlson HA. Full protein flexibility is essential for proper hot-spot mapping. J Am Chem Soc. 2011;133:200–202. doi: 10.1021/ja1079332. [DOI] [PMC free article] [PubMed] [Google Scholar]
- 28.Bakan A, et al. Druggability assessment of allosteric proteins by dynamics simulations in the presence of probe molecules. J Chem Theory Comput. 2012;8:2435–2447. doi: 10.1021/ct300117j. [DOI] [PMC free article] [PubMed] [Google Scholar]
- 29.Antunes DA, et al. Understanding the challenges of protein flexibility in drug design. Expert Opin Drug Discov. 2015;10:1301–1313. doi: 10.1517/17460441.2015.1094458. [DOI] [PubMed] [Google Scholar]
- 30.Wang JC, Lin JH. Scoring functions for prediction of protein-ligand interactions. Curr Pharm Des. 2013;19:2174–2182. doi: 10.2174/1381612811319120005. [DOI] [PubMed] [Google Scholar]
- 31.Lopes PE, et al. Current status of protein force fields for molecular dynamics simulations. Methods Mol Biol. 2015;1215:47–71. doi: 10.1007/978-1-4939-1465-4_3. [DOI] [PMC free article] [PubMed] [Google Scholar]
- 32.Chen J, Brooks CL., 3rd Can molecular dynamics simulations provide high-resolution refinement of protein structure? Proteins. 2007;67:922–930. doi: 10.1002/prot.21345. [DOI] [PubMed] [Google Scholar]
- 33.Korb O, et al. The cloud and other new computational methods to improve molecular modelling. Expert Opin Drug Discov. 2014;9:1121–1131. doi: 10.1517/17460441.2014.941800. [DOI] [PubMed] [Google Scholar]
- 34.Towns J, et al. XSEDE: accelerating scientific discovery. Comput Sci Eng. 2014;16:62–74. [Google Scholar]
- 35.Monticelli L, Tieleman DP. Force fields for classical molecular dynamics. Methods Mol Biol. 2013;924:197–213. doi: 10.1007/978-1-62703-017-5_8. [DOI] [PubMed] [Google Scholar]
- 36.Vanommeslaeghe K, MacKerell AD., Jr CHARMM additive and polarizable force fields for biophysics and computer-aided drug design. Biochim Biophys Acta. 2014;1850:861–871. doi: 10.1016/j.bbagen.2014.08.004. [DOI] [PMC free article] [PubMed] [Google Scholar]
- 37.Tan YS, et al. The use of chlorobenzene as a probe molecule in molecular dynamics simulations. J Chem Inf Model. 2014;54:1821–1827. doi: 10.1021/ci500215x. [DOI] [PubMed] [Google Scholar]
- 38.Raman EP, et al. Inclusion of multiple fragment types in the site identification by ligand competitive saturation (SILCS) approach. J Chem Inf Model. 2013;53:3384–3398. doi: 10.1021/ci4005628. [DOI] [PMC free article] [PubMed] [Google Scholar]
- 39.Lakkaraju SK, et al. Sampling of organic solutes in aqueous and heterogeneous environments using oscillating excess chemical potentials in grand canonical-like Monte Carlo-molecular dynamics simulations. J Chem Theory Comput. 2014;10:2281–2290. doi: 10.1021/ct500201y. [DOI] [PMC free article] [PubMed] [Google Scholar]
- 40.Lakkaraju SK, et al. Mapping functional group free energy patterns at protein occluded sites: nuclear receptors and G-protein coupled receptors. J Chem Inf Model. 2015;55:700–708. doi: 10.1021/ci500729k. [DOI] [PMC free article] [PubMed] [Google Scholar]
- 41.Kalenkiewicz A, et al. Enrichment of druggable conformations from apo protein structures using cosolvent-accelerated molecular dynamics. Biology (Basel) 2015;4:344–366. doi: 10.3390/biology4020344. [DOI] [PMC free article] [PubMed] [Google Scholar]
- 42.Ciulli A. Biophysical screening for the discovery of small-molecule ligands. Methods Mol Biol. 2013;1008:357–388. doi: 10.1007/978-1-62703-398-5_13. [DOI] [PMC free article] [PubMed] [Google Scholar]
- 43.Harner MJ, et al. Fragment-based drug discovery using NMR spectroscopy. J Biomol NMR. 2013;56:65–75. doi: 10.1007/s10858-013-9740-z. [DOI] [PMC free article] [PubMed] [Google Scholar]
- 44.Foster TJ, et al. Balancing target flexibility and target denaturation in computational fragment-based inhibitor discovery. J Comput Chem. 2012;33:1880–1891. doi: 10.1002/jcc.23026. [DOI] [PMC free article] [PubMed] [Google Scholar]
- 45.Faller CE, et al. Site Identification by Ligand Competitive Saturation (SILCS) simulations for fragment-based drug design. Methods Mol Biol. 2015;1289:75–87. doi: 10.1007/978-1-4939-2486-8_7. [DOI] [PMC free article] [PubMed] [Google Scholar]
- 46.Winn MD, et al. Overview of the CCP4 suite and current developments. Acta Crystallogr D Biol Crystallogr. 2011;67:235–242. doi: 10.1107/S0907444910045749. [DOI] [PMC free article] [PubMed] [Google Scholar]
- 47.Morris GM, et al. AutoDock4 and AutoDockTools4: automated docking with selective receptor flexibility. J Comput Chem. 2009;30:2785–2791. doi: 10.1002/jcc.21256. [DOI] [PMC free article] [PubMed] [Google Scholar]
- 48.Yu W, et al. Site-Identification by Ligand Competitive Saturation (SILCS) assisted pharmacophore modeling. J Comput Aided Mol Des. 2014;28:491–507. doi: 10.1007/s10822-014-9728-0. [DOI] [PMC free article] [PubMed] [Google Scholar]
- 49.Yu W, et al. Pharmacophore modeling using site-identification by ligand competitive saturation (SILCS) with multiple probe molecules. J Chem Inf Model. 2015;55:407–420. doi: 10.1021/ci500691p. [DOI] [PMC free article] [PubMed] [Google Scholar]
- 50.Raman EP, et al. Reproducing crystal binding modes of ligand functional groups using site-identification by ligand competitive saturation (SILCS) simulations. J Chem Inf Model. 2011;51:877–896. doi: 10.1021/ci100462t. [DOI] [PMC free article] [PubMed] [Google Scholar]
- 51.Kozakov D, et al. Ligand deconstruction: why some fragment binding positions are conserved and others are not. Proc Natl Acad Sci U S A. 2015;112:E2585–2594. doi: 10.1073/pnas.1501567112. [DOI] [PMC free article] [PubMed] [Google Scholar]
- 52.Raman EP, et al. Site-specific fragment identification guided by single-step free energy perturbation calculations. J Chem Theory Comput. 2012;8:3513–3525. doi: 10.1021/ct300088r. [DOI] [PMC free article] [PubMed] [Google Scholar]
- 53.Yang CY, Wang S. Hydrophobic binding hot spots of Bcl-xL protein-protein interfaces by cosolvent molecular dynamics simulation. ACS Med Chem Lett. 2011;2:280–284. doi: 10.1021/ml100276b. [DOI] [PMC free article] [PubMed] [Google Scholar]
- 54.Ung PM, et al. Identifying binding hot spots on protein surfaces by mixed-solvent molecular dynamics: HIV-1 protease as a test case. Biopolymers. 2016;105:21–34. doi: 10.1002/bip.22742. [DOI] [PMC free article] [PubMed] [Google Scholar]
- 55.Lexa KW, et al. Parameter choice matters: validating probe parameters for use in mixed-solvent simulations. J Chem Inf Model. 2014;54:2190–2199. doi: 10.1021/ci400741u. [DOI] [PMC free article] [PubMed] [Google Scholar]
- 56.Tan YS, et al. Using ligand-mapping simulations to design a ligand selectively targeting a cryptic surface pocket of polo-like kinase 1. Angew Chem Int Ed Engl. 2012;51:10078–10081. doi: 10.1002/anie.201205676. [DOI] [PMC free article] [PubMed] [Google Scholar]
- 57.Alvarez-Garcia D, Barril X. Molecular simulations with solvent competition quantify water displaceability and provide accurate interaction maps of protein binding sites. J Med Chem. 2014;57:8530–8539. doi: 10.1021/jm5010418. [DOI] [PubMed] [Google Scholar]
- 58.Huang D, et al. Structured water molecules in the binding site of bromodomains can be displaced by cosolvent. ChemMedChem. 2014;9:573–579. doi: 10.1002/cmdc.201300156. [DOI] [PubMed] [Google Scholar]
- 59.Cavalier MC, et al. Small molecule inhibitors of Ca(2+)-S100B reveal two protein conformations. J Med Chem. 2016;59:592–608. doi: 10.1021/acs.jmedchem.5b01369. [DOI] [PMC free article] [PubMed] [Google Scholar]
- 60.Samadani R, et al. Small-molecule inhibitors of ERK-mediated immediate early gene expression and proliferation of melanoma cells expressing mutated BRaf. Biochem J. 2015;467:425–438. doi: 10.1042/BJ20131571. [DOI] [PMC free article] [PubMed] [Google Scholar]