

Abstract
Structural and computational biologists often need to measure the similarity of ligand binding conformations. The commonly used root-mean-square deviation (RMSD) is not only ligand-size dependent, but also may fail to capture biologically meaningful binding features. To address these issues, we developed the Contact Mode Score (CMS), a new metric to assess the conformational similarity based on intermolecular protein-ligand contacts. The CMS is less dependent on the ligand size and has the ability to include flexible receptors. In order to effectively compare binding poses of non-identical ligands bound to different proteins, we further developed the eXtended Contact Mode Score (XCMS). We believe that CMS and XCMS provide a meaningful assessment of the similarity of ligand binding conformations. CMS and XCMS are freely available at http://brylinski.cct.lsu.edu/content/contact-mode-score and http://geaux-computational-bio.github.io/contact-mode-score/
Keywords: Contact Mode Score, CMS, eXtended Contact Mode Score, XCMS, root-mean-square deviation, RMSD, molecular docking, ligand binding conformations
Graphical abstract
1. Introduction
Molecular docking is a computational technique routinely used in protein function analysis and drug discovery (Cheng et al., 2012; Yuriev et al., 2015). Docking calculations usually consist of two successive stages, the prediction of the favorable orientation of a small molecule when bound to its target protein followed by the estimation of binding affinity and/or free energy of binding. Scoring functions widely used in molecular docking evaluate protein-ligand conformations in terms of the shape and electrostatic complementarity, as well as the presence of stabilizing interactions such as hydrogen bonds, salt bridges, and hydrophobic contacts (Yusuf et al., 2008). Since these factors hinge on the ligand binding mode, accurately predicted protein-ligand conformations are required for meaningful scoring.
A common practice in benchmarking docking programs is to evaluate predicted conformations against experimentally solved complex structures using the root-mean-square deviation (RMSD) (Kabsch, 1978). Typically, predictions within an RMSD of 2 Å are considered successful, whereas values higher than 3 Å indicate docking failures. A standard RMSD function quantifying the difference between two poses of the same molecule is computed as follows:
| Eq. 1 |
where molecule poses A = {a1, a2, …, an} and B ={b1, b2, …, bn} are defined by sets of Cartesian coordinates ai and bi of individual heavy (non-hydrogen) atoms. This formulation shows that the RMSD is calculated based on a predefined one-to-one correspondence between atoms in poses A and B. Although equivalent atoms can be found by matching atom indices, the presence of symmetric functional groups may result in inflated RMSD values (Allen and Rizzo, 2014). Several modified RMSD calculation methods were developed to handle symmetric molecules (Allen and Rizzo, 2014; Trott and Olson, 2010). These techniques re-index atoms dynamically instead of using the predefined order of atoms.
Further, a strong dependence of the RMSD on the number of atoms complicates the assessment of molecules with different sizes (Reva et al., 1998; Stark et al., 2003). On the other hand, the development and optimization of scoring functions for molecular docking often involves tuning force field parameters against diverse datasets of protein-ligand complexes. For example, weight factors can be adjusted to maximize the capability to recognize near native conformations amongst a large set of docking decoys (Brylinski and Skolnick, 2009a, 2008; Ding et al., 2015). An imprecise classification of near native and decoy conformations, e.g. by using a fixed RMSD threshold, may lead to suboptimal weight factors. Even though the number of ligand atoms can be taken into account by calculating the statistical significance of RMSD values (Reva et al., 1998; Stark et al., 2003), statistical testing is rarely employed in the development and optimization of docking algorithms and scoring functions.
Another issue is that ligand RMSD does not account for the protein environment (Kroemer et al., 2004). Depending on the ligand size and complexity, low RMSD values can be obtained even if key interactions with the protein are absent. Conversely, a substantial deviation from the experimental structure of a moiety that is irrelevant to binding (e.g., a solvent-exposed group) can notably increase the RMSD even when crucial binding features are recovered by docking calculations (Yusuf et al., 2008). To address this problem, the relative displacement error (RDE) (Abagyan and Totrov, 1997) was developed. The RDE down-weights large deviations, therefore, it is less sensitive to a small number of misplaced atoms compared to the RMSD. Nevertheless, similar to RMSD, the RDE takes no account of the protein environment.
Although conventional docking methods employ a single, static structure of the receptor, more recent approaches incorporate protein flexibility by docking against protein ensembles or using rotamer libraries for binding residue side chains (Chang et al., 2007; Lill, 2011; Meiler and Baker, 2006). The traditional ligand RMSD cannot be used to assess the accuracy of fully flexible molecular docking, where not only ligands, but also receptors change their internal conformations. For that reason, an alternative measure based on real space R-factors was proposed to compare electron density rather than to calculate the RMSD from Cartesian coordinates (Yusuf et al., 2008). Moreover, predicted binding modes can be visually inspected in order to identify key protein-ligand interactions recovered by docking calculations (Kroemer et al., 2004). However, the lack of automation makes this approach inapplicable to large datasets of docked ligand conformations.
The calculation of RMSD is straightforward and has a low computational complexity, therefore, it is still frequently used as the assessment measure, particularly across large datasets of protein-ligand complexes. Nevertheless, new techniques are highly desired to evaluate not only purely geometrical features, but also biological aspects of binding. On that account, we developed the Contact Mode Score (CMS), which effectively quantifies the similarity of ligand binding conformations. CMS compares the sets of interatomic contacts formed by a ligand and its receptor rather than ligand Cartesian coordinates. Such an approach also allows for the protein environment to be included in the assessment. Further, we developed the eXtended Contact Mode Score (XCMS), which provides a convenient template-based method to compare those protein-ligand complexes composed of different proteins and non-identical ligands. In contrast to the RMSD, CMS and XCMS are less dependent on the ligand size and have a well-defined statistical significance.
2. Materials and Methods
2.1 Experimental datasets
Three datasets of protein-ligand complexes are used in this study. The first dataset was compiled from the eFindSite library (Brylinski and Feinstein, 2013) by clustering template proteins at 40% sequence identity using PISCES (Wang and Dunbrack, 2003), and then selecting representative chains that non-covalently bind small organic molecules at distinct locations. This procedure produced a set of 14 059 non-redundant structures of protein-ligand complexes, referred to as the eFindSite dataset, which was used to develop a mixed-resolution model of complex structures. In addition, we used the Astex/CCDC dataset (Nissink et al., 2002) comprising the high-quality experimental structures of 201 pharmacologically relevant proteins co-crystalized with drug molecules. The dependence of CMS and RMSD on the number of ligand atoms was examined against the Astex/CCDC dataset. Finally, the XCMS was developed and tested on the BioLiP database (Yang et al., 2013). BioLiP provides a comprehensive collection of protein-ligand complex structures curated specifically for studies focusing on biologically relevant interactions and template-based modeling approaches. From the entire database comprising 94 887 ligands bound to 71 359 proteins, we randomly selected 2 200 protein-ligand complexes as query structures. In XCMS benchmarking, we searched the complete BioLiP database for non-identical templates for each query structure. A complex was used as the template if the Pocket Similarity score (PS-score) against the query pocket is <0.9, the fingerprint Tanimoto coefficient (1D-TC) against the query ligand is >0.5, and the number of ligand heavy atoms is greater than 6. Using these criteria produced a dataset of 802 058 query-template pairs to benchmark the XCMS. The PS-score measures the structural similarity of two ligand binding sites; it ranges from 0 to 1 with higher values indicating higher similarity (Gao and Skolnick, 2013a). 1D-TC employs 1024-bit molecular fingerprints to quantify the chemical similarity of two small molecules. The calculations of 1D-TC were conducted with OpenBabel (O’Boyle et al., 2011), which supports fingerprint indexing to accelerate searches against large databases.
2.2 Simulated datasets
In addition to experimental datasets, three sets of computer-generated structures were compiled for benchmarking purposes. The first simulated dataset is based on Astex/CCDC (Nissink et al., 2002) and it was prepared to assess the dependence of RMSD and CMS on the number of ligand heavy atoms. A series of systematic perturbations were applied to co-crystalized ligands, each comprising random translations and rotations about the x, y and z-axis of up to 0.02 Å and 5 deg, respectively. After each round of perturbation, RMSD and CMS were computed against the native conformation of a ligand. The second simulated dataset contains Metropolis Monte Carlo (MMC) trajectories constructed by GeauxDock (Ding et al., 2015) for Astex/CCDC complexes. GeauxDock employs a mixed-resolution representation of protein-ligand complexes and a hybrid scoring function comprising physics-, evolution-based energy terms and statistical potentials. GeauxDock effectively finds the near native structures of protein-ligand complexes by exploring low-energy configurations according to a dimensionless scoring function. Here, binding ligands were initialized at random conformations and GeauxDock simulation engine (Ding et al., 2015) was used to generate docking trajectories through 800 MMC cycles. The CMS was calculated for each accepted conformation against the ligand bound in the crystal complex structure.
The last simulated dataset was built on BioLiP (Yang et al., 2013) to benchmark RMSD, CMS and XCMS using predicted and random ligand conformations. First, query ligands were randomized within receptor binding pockets to produce a set of 2 200 random conformations of query ligands. Subsequently, each randomized ligand was re-docked to the protein with AutoDock Vina (Trott and Olson, 2010). The docking box was set to an optimal size based on the radius of gyration of the ligand (Feinstein and Brylinski, 2015) and the binding pocket center was set to the geometric center of the compound bound in the experimental complex. This procedure produced 2 200 docked conformations of query ligands. For each simulated conformation, RMSD and CMS were calculated against the experimental structure, whereas the XCMS was calculated using a template. Similar to the experimental BioLiP dataset, we included only those templates having more than 6 heavy atoms, a PS-score of <0.9, and a 1D-TC of >0.5. For the template-based assessment with XCMS, suitable templates were identified for a subset of 695 targets.
2.3 Molecular representation
Fast computation without compromising molecular details is achieved by describing protein-ligand complex structures at a mixed-resolution. A heavy-atom representation is used for ligands with the following chemical types according to SYBYL (Clark et al., 1989): carbon sp (C.1), carbon sp2 (C.2), carbon sp3 (C.3), aromatic carbon (C.ar), carbocation in guadinium groups (C.cat), nitrogen sp (N.1), nitrogen sp2 (N.2), nitrogen sp3 (N.3), positively charged nitrogen sp3 (N.4), amide nitrogen (N.am), aromatic nitrogen (N.ar), trigonal planar nitrogen (N.pl3), oxygen sp2 (O.2), oxygen sp3 (O.3), oxygen in carboxylate and phosphate groups (O.co2), phosphorous sp3 (P.3), sulfur sp2 (S.2), sulfur sp3 (S.3), sulfoxide sulfur (S.O), sulfone sulfur (S.O2), and halogens (Br, Cl, F, IProteins are represented at the coarse-grained level. In CMS, two effective backbone points per residue are placed at the position of its Cα atom (CA) and the geometrical center of the peptide plane (PP). Small side chains of Ala, Asn, Asp, Cys, Ile, Leu, Pro, Ser, Thr and Val are reduced to one pseudo atom located at the geometric center, whereas longer side chains of Arg, Gln, Glu, His, Lys, Met, Phe, Trp and Tyr are described by twoeffective points corresponding to the middle of a virtual Cβ-Cγ bond and the geometric center of the remaining side-chain atoms (Zacharias, 2003). It is noteworthy that this model is already implemented in a molecular docking program, GeauxDock (Ding et al., 2015). In XCMS, two effective points per residue are used at the positions of its Cα and Cβ atoms (CA and CB, respectively), except for glycine that has only the CA atom.
2.4 Intermolecular contacts
Contacts between ligand heavy atoms and protein effective points in the mixed-resolution model are calculated using type-dependent distance thresholds. These threshold values were optimized against the exact interatomic contacts extracted from high-resolution complex structures in the eFindSite dataset, defined as pairs of heavy atoms within a distance of 4.5 Å. This cutoff is commonly used to determine the first hydration shell for proteins; when solvent molecules are present within this shell, proteins atoms have less freedom to interact with ligand atoms (Beck et al., 2002). For each unique combination of a ligand atom type l and an amino acid effective point type p, we found an optimal distance, , that reproduces high-resolution interatomic contacts by maximizing the Matthews correlation coefficient (MCC) (Matthews, 1975):
| Eq. 2 |
Here, TP is the number of true positives, i.e. interatomic contacts that are correctly reproduced in the mixed-resolution model. TN is the number of true negatives, i.e. heavy atom pairs farther away than 4.5 Å from each other in high-resolution structures and also above the corresponding type-dependent distance threshold for ligand atoms and protein effective points in the mixed-resolution model. FP and FN are the numbers of false positives and false negatives, respectively, i.e. those contacts that are over- and underestimated by using the mixed-resolution description. Note that ligand atoms in our model are treated equally when counting interatomic contacts. Although some methods prioritize certain parts of the ligand to better capture important aspects of binding (Kroemer et al., 2004), these approaches largely depend on manual inspection and thus cannot be automated.
2.5 Contact Mode Score
Essentially, the CMS quantifies the overlap of interatomic contacts in protein-ligand complex structures. Figure 1 illustrates a procedure to calculate the CMS for three conformations of a simplified system, in which the ligand has 3 heavy atoms (L1 – L3) and the protein has 4 effective points (P1 – P4). The first step is to construct the Global Contact Matrix (GCM) encoding the interaction pattern for a particular ligand binding conformation (Figures 2A–2C). Here, the distance between each ligand atom L of type l and each protein point P of type p is compared with the threshold to determine whether L and P are in contact. The corresponding entry in the GCM matrix is set to 1 if the distance is below , otherwise it is set to 0. Next, a confusion matrix is generated for a pair of GCMs, where one GCM represents a query (Figures 1A and 1C) and the other is the reference (Figure 1B). Confusion matrices consist of the numbers of true positives (TP), true negatives (TN), false positives (FP), and false negatives (FN). TP are interatomic contacts that are present in both conformations and TN are pairs of ligand atoms and protein effective points not in contact in both conformations. FP and FN are over- and under-predicted contacts in the query conformation. Finally, Eq. 2 is used to calculate the CMS whose values range from −1 to 1, with greater values indicating a higher similarity between two conformations. Since relative distances between interacting points are used in CMS calculations, the resulting similarity score is independent of the absolute coordinate frames of query and reference structures. Furthermore, CMS correctly handles any degrees of freedom associated with the molecular flexibility, therefore, it can be applied to evaluate complex structures generated by ensemble docking and flexible receptor docking protocols.
Figure 1. Calculation of the Contact Mode Score (CMS).
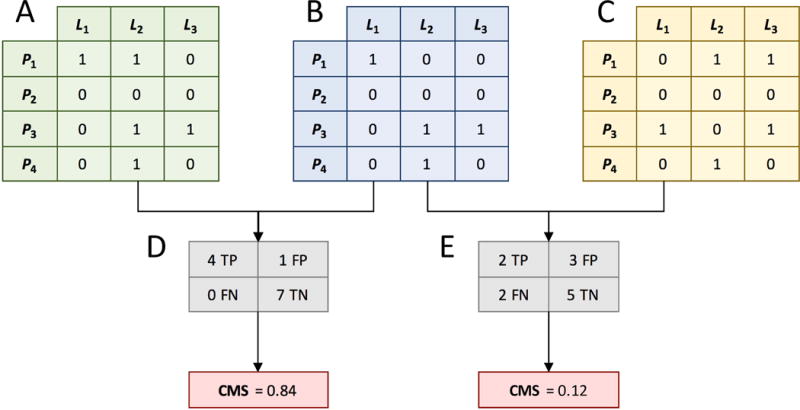
First, intermolecular contacts calculated between ligand atoms L and protein effective points P are stored in binary matrices (1 - contact, 0 - no contact). Contact matrices for two arbitrary ligand conformations are shown in A and C, whereas B is a contact matrix constructed for the reference conformation. Next, a confusion table is computed for a pair of contact matrices; tables D and E are calculated for pairs A–B and C–B, respectively. Finally, CMS is calculated as the Matthews correlation coefficient for a given confusion table.
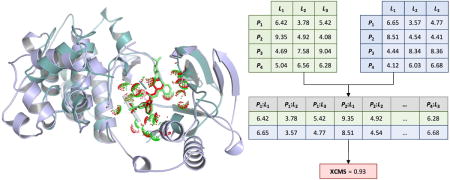
Figure 2. Calculation of the eXtended Contact Mode Score (XCMS).
First, Cartesian distances calculated between ligand atoms L and protein effective points P are stored in distance matrices. Matrices for two arbitrary ligand conformations are shown in A and C, whereas B is a distance matrix for the reference conformation (distances are given in Å). Next, two matrices are converted to distance vectors whose elements correspond to pairs of protein effective points and ligand atoms (P:L). Finally, XCMS is computed as Spearman’s rank correlation coefficient for a given set of vectors.
2.6 eXtended Contact Mode Score
CMS requires a predefined one-to-one atomic correspondence, therefore, it can be used to measure the similarity of different conformations of the same protein-ligand pair. In order to compare non-identical complexes formed by different proteins and ligands, we developed the eXtended Contact Mode Score. In XCMS, equivalent atoms in two different ligand molecules are identified with the kcombu program (Kawabata, 2011). Kcombu implements a fast and accurate build-up algorithm to perform chemical structure alignments and reports the similarity between ligands in terms of the topological Tanimoto coefficient (2D-TC). Further, the local structure alignment algorithm APoc (Gao and Skolnick, 2013a) is employed to match ligand-binding pockets in a given pair of proteins in order to find equivalent residues. APoc uses the geometrical and physicochemical features of binding sites and provides a PS-score value, which measures the local similarity of ligand binding sites. Since equivalent residues reported by APoc for two proteins may have different types, we use a Cα-Cβ coarse-grained model in XCMS. Moreover, XCMS employs Local Contact Matrices (LCMs) because alignments generated by APoc are local, covering only ligand binding sites.
XCMS calculations are illustrated in Figure 2. Three non-identical complexes are shown in Figures 2A–2C. L1–L3 represent ligand heavy atoms matched by kcombu, so that an atom L1 in the first complex is equivalent to L1 atoms in the second and third complexes and so on. Protein residues are classified as ligand binding if any ligand atom is found within a distance of 7 Å from any protein atom. This distance was selected to ensure that a sufficient number of binding residues are used for local alignments with APoc. Protein residues matched by APoc are stored in the LCM as rows arranged according to the pocket alignment. LCM entries are the distances between ligand atoms L and protein effective points P corresponding to the CA and CB atoms of binding residues. Next, LCMs are unrolled into 1D vectors maintaining the order of P:L pairs (Figures 2D and 2E). The XCMS is then calculated as non-parametric Spearman’s rank correlation coefficient between two vectors (Fieller et al., 1957).
Similar to the CMS, XCMS ranges from −1 to 1 with higher values indicating a higher similarity between two conformations. However, in contrast to the CMS calculated from a 4×4 confusion matrix, XCMS depends on the length of distance vectors. Therefore, XCMS values are assigned a statistical significance under a null hypothesis that XCMS is zero for a pair of randomly generated LCMs; the alternative hypothesis is that two LCMs are significantly similar. The one-sided p-value is computed using the scipy package (Oliphant, 2007) based on the Fisher transformation method (Fisher and Fisher, 1915). Given a positive XCMS, lower p-values indicate a higher statistical significance of the conformational similarity of protein-ligand complexes.
3. Results and Discussion
3.1 Mixed-resolution contacts
Many all-atom models define interatomic contacts using a distance threshold of 4.5 Å corresponding to the second solvation shell (Beck et al., 2002). In the mixed-resolution model used to calculate the CMS, type-dependent distance thresholds are optimized against the eFindSite dataset of protein-ligand complexes to reproduce all-atom contacts. Figure 3A shows the distribution of 720 (24 types of ligand atoms × 30 types of protein effective points) contact distances, . The majority of contact distances fall within a range of 4–6 Å. Those effective points comprising more protein atoms, e.g. the side chains of Trp-2, Arg-2 and Tyr-2, typically have larger thresholds than small amino acids, such as Ala-1, Ser-1 and Cys-1, as well as Cβ-Cγ virtual bonds and backbone CA and PP groups. In general, optimized distance thresholds in the mixed-resolution model reliably reproduce the exact interatomic contacts. As shown in Figure 3B, MCC values for most interacting pairs are larger than 0.5 with an average MCC of 0.7. Such accuracy in calculating intermolecular contacts in the mixed-resolution model is sufficient to develop a contact-based similarity measure. The complete set of values is provided as Supplementary Material.
Figure 3. Parameterization of mixed-resolution intermolecular contacts.
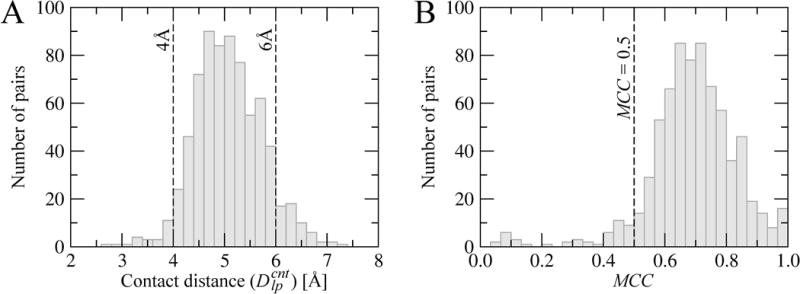
The distribution of (A) contact distance thresholds and (B) the Matthews correlation coefficient (MCC) values calculated vs. exact interatomic contacts across the eFindSite dataset.
3.2 Ligand size dependence of RMSD and CMS
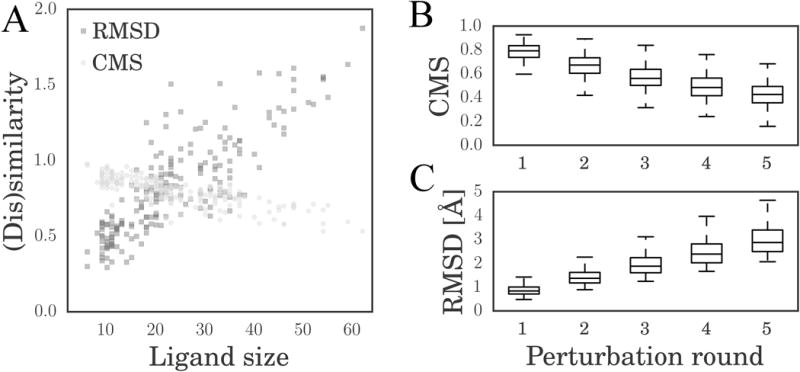
The dependence of RMSD and CMS values on the ligand size was evaluated in a perturbation experiment. Table 1 shows the average RMSD and CMS after the first round of perturbation for Astex/CCDC complexes grouped based on the number of ligand heavy atoms. Both CMS and RMSD show some dependence on the ligand size because small ligands yield lower RMSD and higher CMS values compared with larger molecules. In Figure 4A, we plot similarity (CMS, light gray circles) and dissimilarity (RMSD, dark gray squares) values against the ligand size. The dependence of the (dis)similarity on the ligand size is assessed by the Pearson correlation coefficient (PCC) (Pearson, 1895). The PCC is 0.850 for the RMSD and −0.780 for the CMS. In addition, we estimate the Mutual Information (MI) between the RMSD and CMS, and the ligand size. It has been shown that the MI can quantify the strength of a statistical association without bias for relationships of a specific form with higher MI value indicating a stronger association (Kinney and Atwal, 2014). The MI against the ligand size is 0.714 for the RMSD and 0.512 for the CMS. Overall, the absolute values of PCC and MI are lower for CMS, indicating that it is less dependent on the ligand size than RMSD.
Table 1. Dependence of RMSD and CMS on the ligand size.
Ligand conformations from the Astex/CCDC dataset were subjected to one round of perturbation comprising a set of forward translations and clockwise rotations. The mean values of RMSD and CMS are reported for each size range.
| Ligand sizea | RMSD [Å] | CMS |
|---|---|---|
| 6–17 | 0.527 | 0.879 |
| 18–28 | 0.851 | 0.793 |
| 29–39 | 0.961 | 0.757 |
| 40–50 | 1.334 | 0.666 |
| 51–62 | 1.541 | 0.625 |
The number of heavy atoms
Figure 4. Comparison of RMSD and CMS in the perturbation experiment.
(A) Scatter plot of RMSD (dark gray squares) and CMS (light gray circles) vs. the number of ligand atoms after a single perturbation round. Boxplots of (B) CMS and (C) RMSD calculated for ligand conformations generated through multiple perturbation rounds. Boxes end at the 25 and 75 percentiles, a horizontal line in a box is the 50 percentile (median).
Next, we performed five rounds of perturbation of ligands in the Astex/CCDC dataset. Table 2 reports 25, 50 and 75 percentiles of RMSD and CMS as well as the quartile coefficient of dispersion (QCD) (Bonett, 2006) after each perturbation round. The percentile values are also plotted in Figure 4B for the CMS and Figure 4C for the RMSD. Higher QCD values indicate larger fluctuations of a given measure. Although the QCD for the CMS increases with the number of perturbation rounds, it is systematically smaller than that for the RMSD demonstrating that the CMS is more stable.
Table 2. Changes in RMSD and CMS in the perturbation experiment.
Ligand conformations from the Astex/CCDC dataset were subjected to multiple rounds of perturbation, each comprising a set of forward translations and clockwise rotations. 25, 50, and 75 percentiles as well as the quartile coefficient of dispersion (QCD) calculated across the dataset are reported for each perturbation round.
| Perturbation round | CMS | RMSD | ||||||
|---|---|---|---|---|---|---|---|---|
|
| ||||||||
| 25% | 50% | 75% | QCD | 25% | 50% | 75% | QCD | |
| 1 | 0.738 | 0.793 | 0.837 | 0.063 | 0.708 | 0.839 | 1.001 | 0.171 |
| 2 | 0.605 | 0.673 | 0.734 | 0.096 | 1.175 | 1.368 | 1.613 | 0.157 |
| 3 | 0.503 | 0.561 | 0.638 | 0.118 | 1.599 | 1.876 | 2.237 | 0.166 |
| 4 | 0.415 | 0.485 | 0.564 | 0.152 | 2.018 | 2.387 | 2.808 | 0.164 |
| 5 | 0.357 | 0.426 | 0.493 | 0.161 | 2.489 | 2.872 | 3.394 | 0.154 |
3.3 Examples of CMS calculations
The CMS is a convenient measure not only to assess docking accuracy, but also to analyze docking trajectories and the quality of scoring functions. On that account, we generated MMC trajectories for the Astex/CCDC dataset using GeauxDock (Ding et al., 2015) and calculated CMS values against the experimental structure for the accepted configurations. Two examples are shown in Figure 5, aspartyl proteinase penicillopepsin complexed with a pepstatin analogue (PDB-ID: 1apt, chain A, Figures 5A and 5B) (James et al., 1983) and urokinase-type plasminogen activator complexed with an inhibitor (PDB-ID: 1c5x, chain B, Figures 5C and 5D) (Katz et al., 2000). Figures 5A and 5C show that at the beginning of docking simulations, pseudo-energies are high and CMS values are low suggesting that initial ligands are far away from experimental binding poses. Blue lines in both plots show that MMC simulations in GeauxDock are driven by the pseudo-energy to reach low-energy states. Encouragingly, the CMS increases as the pseudo-energy gradually decreases indicating that ligands are moving toward native-like conformations. This correlation between the pseudo-energy and the native-likeness is a desired characteristic of a scoring function, which is shown as scatter plots in Figures 5B and 5D. It is noteworthy that our previous benchmarks of GeauxDock demonstrated that the pseudo-energy and CMS are correlated for about three-quarters of Astex/CCDC complexes (Ding et al., 2015).
Figure 5. Analysis of docking trajectories with the CMS.
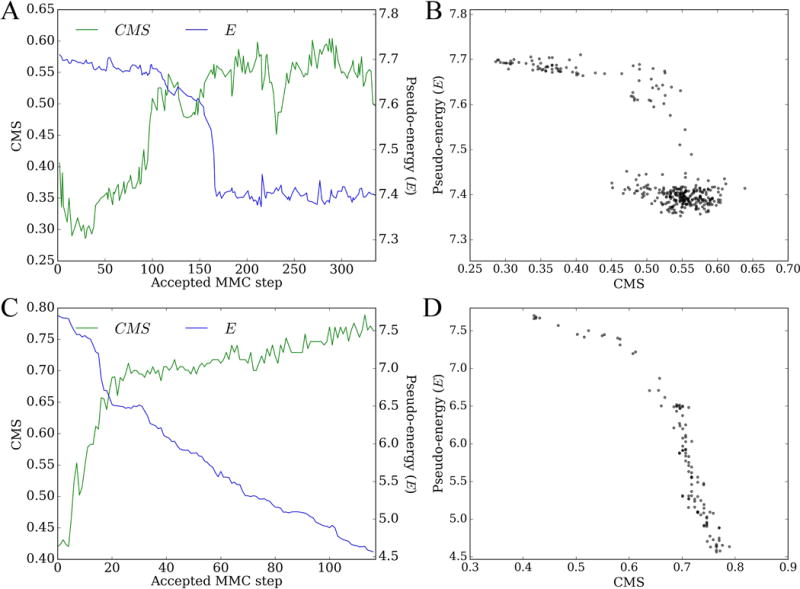
Docking simulations were conducted using GeauxDock for (A, B) penicillopepsin/pepstatin analogue (PDB-ID: 1apt, chain A) and (C, D) plasminogen activator/inhibitor (PDB-ID: 1c5x, chain B). (A, C) Metropolis Monte Carlo trajectories for CMS (green) and pseudo-energy (E, blue). (B, D) Scatter plots of CMS vs. the pseudo-energy; each dot represents an accepted protein-ligand conformation.
Three representative snapshots selected from each docking trajectory are shown in Figure 6. These binding poses shown in blue were generated at the beginning (Figures 6A and 6D), in the middle (Figures 6B and 6E), and at the end (Figures 6C and 6F) of GeauxDock simulations. The corresponding CMS values calculated against experimental complex structures shown in orange are 0.286, 0.366 and 0.601 for penicillopepsin, and 0.424, 0.583 and 0.771 for plasminogen activator, respectively. It is clear that high CMS values correspond to docking conformations that are close to experimental structures, thus the CMS is a good indicator of the native-likeness.
Figure 6. Examples of docking poses from GeauxDock simulations.
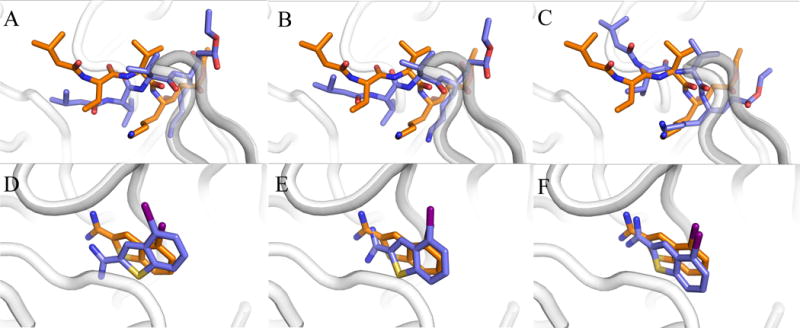
(A–C) penicillopepsin/pepstatin analogue (PDB-ID: 1apt, chain A) and (D–F) plasminogen activator/inhibitor (PDB-ID: 1c5x, chain B). Three docking poses are shown in blue for each system, (A, D) initial, (B, E) intermediate, and (C, F) final conformations. The corresponding experimental complex structures are colored in orange.
3.4 Algorithm complexity of CMS and RMSD
We compare the time to calculate CMS and RMSD using the Astex/CCDC dataset. Specifically, for each complex, CMS and RMSD values for 8 variational conformations were calculated against the experimental structure, resulting in 1 632 (204×8) individual calculations. Using one thread on a 2.6 GHz Sandy Bridge Xeon 64-bit processor, the wall time to finish RMSD (CMS) calculations is 17 s (5 389 s), thus computing RMSD is about 317 times faster than CMS. The reason for a longer wall time required to calculate CMS is that it considers a protein environment and iterates over all pairs of ligand atoms and protein points, whereas the RMSD iterates only over ligand atoms. From the perspective of algorithm complexity, the CMS calculation O(P×L) is and the RMSD calculation is 0(L), where P and L are the total number of protein points and ligand atoms, respectively. Although both RMSD and CMS calculations are based on Euclidean distances, CMS requires a longer computing time due to the relatively large number of 838 effective points per protein on average.
3.5 Dependence of XCMS on the ligand and pocket similarity
XCMS was developed as an extension of the CMS to measure the similarity of ligand binding conformations among complexes formed by different proteins and ligands. In order to establish when a similar ligand binding conformation can be expected, we investigate the dependence of XCMS on the pocket and ligand similarity in experimental complex structures. Specifically, XCMS, PS-score and 2D-TC values were calculated for all query-template pairs across the BioLiP database. Heat maps in Figure 7 were constructed by dividing query-template pairs into 400 groups based on 2D-TC and PS-score values and then averaging XCMS and p-values within each group. Note that those pairs having a PS-score between the query and the template of >0.9 were excluded in order to examine only non-identical systems. As expected, Figure 7A demonstrates that the conformational similarity of protein-ligand complexes captured by XCMS increases as their pockets and binding ligands become more similar. Figure 7B shows the statistical significance of query-template XCMS as a function of PS-score and 2D-TC. The significance of XCMS increases with the increasing similarity of ligands and binding pockets in query and template structures. A clear boundary in Figures 7A and 7B at a PS-score of 0.4 corresponds to a threshold separating statistically similar and dissimilar binding pockets in proteins (Gao and Skolnick, 2013a). Overall, these results corroborate previous studies reporting the conservation of ligand binding across structurally similar pockets occupied by chemically similar ligands (Brylinski and Skolnick, 2009b; Gao and Skolnick, 2013b; J.-I. Ito et al., 2012; Jun-Ichi Ito et al., 2012). It is important to note that both pocket similarity and ligand similarity should be taken into account when selecting a template to calculate XCMS. In practice, we first rank templates by the product of 2D-TC and PS-score and then take the top-ranked structure to assess the target conformation using XCMS.
Figure 7. XCMS and its statistical significance for the BioLiP dataset.
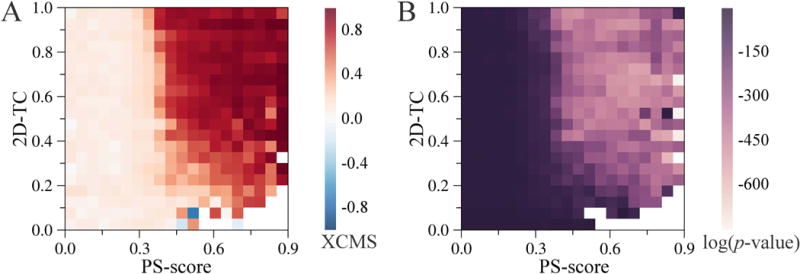
Query-template pairs are grouped based on the similarity between their ligands (measured by the 2D Tanimoto coefficient) and pockets (measured by PS-score). Heat maps of (A) the arithmetic mean values of XCMS and (B) the geometric mean of the p-value for positive XCMS.
3.6 Large-scale benchmarking of molecular docking
Molecular docking with AutoDock Vina was performed for a subset of 2,200 query complexes selected the BioLiP dataset. In Figure 8, we first use this simulated dataset to investigate the relationship between RMSD, CMS and XCMS. Here, the strength of association is measured with the maximal information coefficient (MIC) (Reshef et al., 2011). The MIC belongs to the maximal information-based nonparametric exploration class of statistics and quantifies linear and non-linear associations by applying mutual information to continuous random variables. Figure 8A shows the correlation between CMS and RMSD, both of which are calculated against the experimental structures of query complexes; the MIC between the CMS and RMSD is as high as 0.91. Figure 8B shows the correlation between CMS and XCMS, where the XMCS is calculated using template structures. Encouragingly, these two contact-based measures are also highly correlated with a MIC of 0.88. Both MIC values are statistically significant at p-values of <1.28 × 10⁻⁶ (Reshef et al., 2011) demonstrating a strong association between RMSD, CMS and XCMS.
Figure 8. Correlation between RMSD, CMS, and XCMS.
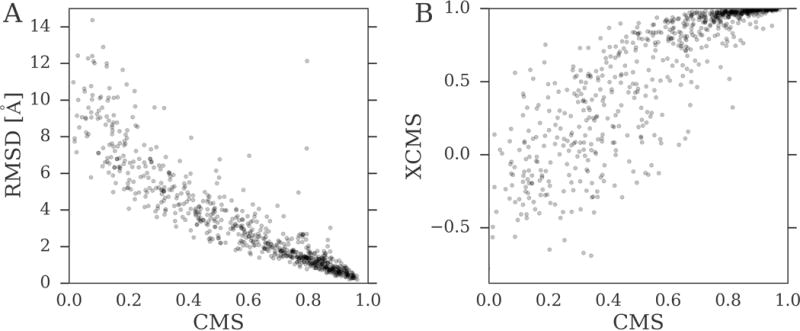
Docking conformations generated for the BioLiP dataset by AutoDock Vina are used to calculate RMSD and CMS against experimental binding poses. XCMS was computed against a holo template selected from the BioLiP database based on the highest value of the product of PS-score and the 2D Tanimoto coefficient. Scatter plots of (A) CMS vs. RMSD and (B) CMS vs. XCMS.
Next, we use the RMSD, CMS and XCMS to evaluate the accuracy of molecular docking for the BioLiP dataset. In Figure 9 and Table 3, docking poses generated by AutoDock Vina are compared to random ligand conformations generated within receptor binding pockets. Regardless of the evaluation metric, Vina constructed native-like conformations for a significant number of complexes, whereas the vast majority of random conformations are far away from experimental structures. For instance, the median (50% quartile) RMSD, CMS, and XCMS for Vina is 2.89 Å, 0.574, and 0.694, respectively, compared to 7.60 Å, 0.152, and 0.198 for random conformations. Overall, these results demonstrate that when suitable templates can be identified in the BioLiP database, a retrospective assessment with RMSD and CMS against experimental structures can be replaced with a template-based evaluation using the XCMS.
Figure 9. Assessment of docked and randomized ligand conformations across the BioLiP dataset.
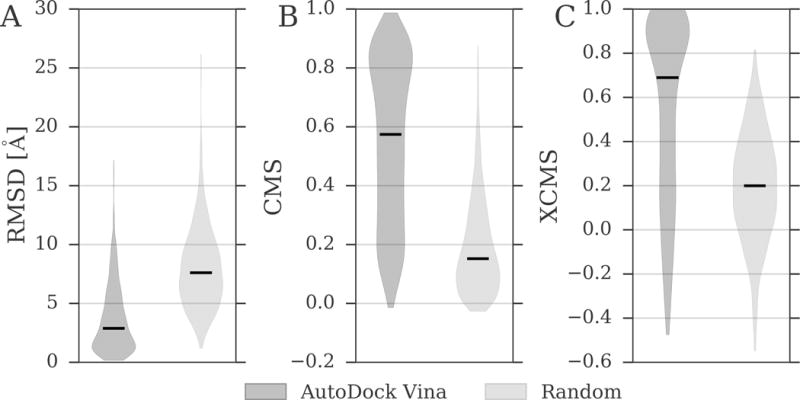
The similarity to experimental binding poses is assessed with (A) RMSD, (B) CMS, and (C) XCMS. RMSD and CMS were calculated against experimental complex structures. XCMS was calculated against a holo template selected from the BioLiP database based on the highest value of the product of PS-score and the 2D Tanimoto coefficient. Dark gray violins correspond to ligands docked by AutoDock Vina, whereas light gray violins are calculated for randomized ligand conformations. Black horizontal lines are median values.
Table 3. Assessment of docked and randomized ligand conformations across the BioLiP dataset.
RMSD and CMS were calculated against experimental complex structures. XCMS was calculated against a holo template selected from the BioLiP database based on the highest value of the product of PS-score and 2D Tanimoto coefficient. Mean values as well as 25%, 50% and 75% quartiles are reported.
| Statistic | AutoDock Vina | Random | ||||
|---|---|---|---|---|---|---|
|
| ||||||
| RMSD [Å] | CMS | XCMS | RMSD [Å] | CMS | XCMS | |
| mean | 3.66 | 0.548 | 0.545 | 8.03 | 0.191 | 0.194 |
| 25% | 1.40 | 0.308 | 0.203 | 5.49 | 0.070 | 0.036 |
| 50% | 2.89 | 0.574 | 0.694 | 7.60 | 0.152 | 0.198 |
| 75% | 5.29 | 0.798 | 0.912 | 10.02 | 0.279 | 0.366 |
3.7 Examples of XCMS calculations
Finally, we discuss two representative examples illustrating how XCMS can be used to evaluate docking conformations, mitogen-activated protein kinase 14 (MAPK14, PDB-ID: 2yiw, ligand: YIW, chain: A) (Millan et al., 2011) and ribose-5-phosphate isomerase (RpiA, PDB-ID: 1o8b, ligand: ABF, chain A) (Zhang et al., 2003). Both query ligands (YIW and ABF) were docked into their target binding pockets by AutoDock Vina (Trott and Olson, 2010) starting from random conformations. We first calculated the RMSD and CMS against native complexes to evaluate the docking accuracy. Table 4 shows that docking simulations were successful in both cases and the predicted conformations are highly similar to experimental structures; for instance, the RMSD is 0.42 Å and the CMS is 0.94 for MAPK14. Next, we evaluate docking conformations with the XCMS. Proto-oncogene tyrosine-protein kinase Src (c-Src, PDB-ID: 3f3u, ligand: 1AW, chain A) (Simard et al., 2009) was selected from the BioLiP database as a template for MAPK14, whereas central glycolytic gene regulator (CggR, PDB-ID: 3bxh, ligand: F6P, chain A) (Řezáčová et al., 2008) was selected as a template for RpiA. XCMS values calculated against template complexes reported in Table 4 demonstrate that the template-based assessment is consistent with the direct evaluation using CMS and RMSD; for instance, the XCMS is 0.96 with a highly significant p-value of close to 0 for MAPK14.
Table 4. Assessment of ligand binding poses docked by AutoDock Vina.
Two case studies are presented, MAPK14 complexed with triazolopyridine inhibitor (PDB-ID: 2yiw, ligand YIW, chain A) and ribose-5-phosphate isomerase complexed with the inhibitor arabinose-5-phosphate (PDB-ID: 1o8b, ligand ABF, chain A).
| Metric/info | Case study
|
|
|---|---|---|
| 2YIW_YIW_A | 1O8B_ABF_A | |
| Calculated against experimental complex structure | ||
| RMSD [Å] | 0.42 | 1.58 |
| CMS | 0.94 | 0.77 |
|
| ||
| Template-based assessment | ||
| Template | 3F3U_1AW_A | 3BXH_F6P_A |
| TM-scorea | 0.76 | 0.27 |
| PS-scoreb | 0.7 | 0.46 |
| p-value of PS-score | 6.28E-09 | 4.90E-05 |
| 2D-TCc | 0.41 | 0.88 |
| Query EC# | 2.7.11.24 | 5.3.1.6 |
| Template EC# | 2.7.10.2 | Non-enzyme |
| XCMS | 0.96 | 0.76 |
| p-value of XCMS | 0 | 1.56E-63 |
Calculated for the global structure alignment by Fr-TM-align.
Calculated for the local pocket alignment by APoc.
2D Tanimoto coefficient calculated for query- and template-bound ligands by kcombu.
Table 4 also includes various similarity scores for query-template pairs as well as their functional classification. MAPK14 and c-Src belong to the same class of transferase enzymes transferring phosphorus-containing groups (Enzyme Commission, EC number 2.7.-.-) and have globally similar structures with a Template Modeling score (TM-score) of 0.76. TM-score is a length-independent measure of the structural similarity between proteins (Zhang and Skolnick, 2004); it ranges from 0 to 1, with values 0.4 and higher indicating a statistically significant similarity. In contrast, RpiA and CggR have unrelated structures with a TM-score of 0.27. RpiA is an enzyme, ribose-5-phosphate isomerase (EC# 5.3.1.6), whereas non-enzyme CggR belongs to the SorC/DeoR family of prokaryotic transcriptional regulators. In both cases, template-bound ligands are similar to query ligands with a 2D-TC of 0.41 for MAPK14/c-Src and 0.88 for RpiA/CggR. In order to visually compare ligand binding conformations, global and local structure alignments constructed for MAPK14/c-Src and RpiA/CggR are shown in Figure 10. Ligands bound to MAPK14 and c-Src adopt a similar conformation when protein structures are superposed according to the global alignment by Fr-TM-align (Pandit and Skolnick, 2008) (Figure 10A) and the local alignment by APoc (Gao and Skolnick, 2013a) (Figure 10B). Since the global structure alignment between RpiA and CggR is random, it cannot be used to provide equivalent residues for XCMS calculations (Figure 10C). Nonetheless, APoc constructed a statistically significant local alignment of binding pockets in RpiA and CggR with a PS-score of 0.46 and the corresponding p-value of 4.9 × 10⁻⁵. When protein structures are superposed according to the local alignment, binding ligands in RpiA and CggR adopt a similar conformation (Figure 10D). These examples demonstrate that although XCMS calculations do not require globally similar templates, the chemical similarity of bound ligands as well as the similarity of binding sites in query and template structures should be high enough to ensure a meaningful template-based assessment.
Figure 10. Examples of the superposition of query and template structures.
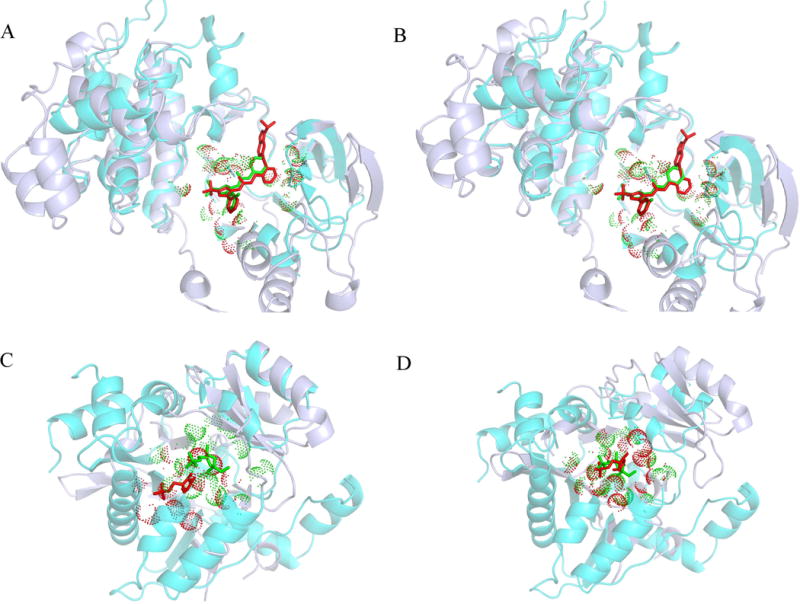
The query protein is ice blue with its binding residues marked by red dots and the bound ligand shown as red sticks. The template protein is cyan with its binding residues marked by green dots and the bound ligand shown as green sticks. (A, B) The superposition of MAPK14 (PDB-ID: 2yiw, chain A) and c-Src (PDB-ID: 3f3u, chain A). (C, D) The superposition of ribose-5-phosphate isomerase (PDB-ID: 1o8b, chain A) and central glycolytic gene regulator (PDB-ID: 3bxh, chain A). For each pair, two superpositions are shown, (A, C) the global structure alignment by Fr-TM-align and (B, D) the local pocket alignment by APoc.
4. Conclusions
The Contact Mode Score, or CMS, was developed in this study to quantify the conformational similarity of protein-ligand complexes based on intermolecular contacts. Its major advantages over the traditional root-mean-square deviation include less dependency on the ligand size and taking into account the protein environment. Consequently, the CMS can be used to measure the ligand binding similarity across diverse protein-ligand datasets as well as to evaluate flexible docking methods simulating receptor conformational changes upon ligand binding. In order to effectively compare binding poses of non-identical ligands bound to different proteins, we further developed the eXtended Contact Mode Score, or XCMS. The XCMS capitalizes on the conservation of ligand binding across structurally similar pockets occupied by chemically similar ligands. For instance, it can be used to systematically evaluate complex structures constructed by virtual screening, where a retrospective assessment cannot be performed because the experimental structures of the majority of complexes are unavailable. CMS and XCMS are freely available at http://brylinski.cct.lsu.edu/content/contact-mode-score and http://geaux-computational-bio.github.io/contact-mode-score/.
Supplementary Material
Highlights.
A novel method to measure the similarity of ligand binding conformations is proposed
The Contact Mode Score (CMS) is less dependent on the ligand size than the RMSD
The analysis of ligand binding conformations includes the protein environment
The extended CMS (XCMS) can be used to compare non-identical protein-ligand complexes
Acknowledgments
Research reported in this publication was supported by the National Institute of General Medical Sciences of the National Institutes of Health under Award Number R35GM119524. The content is solely the responsibility of the authors and does not necessarily represent the official views of the National Institutes of Health. The authors are grateful for discussions and comments from the members of the Technologies for Extreme Scale Computing (TESC) team formed within the Louisiana Alliance for Simulation-Guided Materials Applications (LA-SiGMA). Portions of this research were conducted with high performance computational resources provided by Louisiana State University (HPC@LSU, http://www.hpc.lsu.edu) and the Louisiana Optical Network Institute (LONI, http://www.loni.org).
Footnotes
Publisher's Disclaimer: This is a PDF file of an unedited manuscript that has been accepted for publication. As a service to our customers we are providing this early version of the manuscript. The manuscript will undergo copyediting, typesetting, and review of the resulting proof before it is published in its final citable form. Please note that during the production process errors may be discovered which could affect the content, and all legal disclaimers that apply to the journal pertain.
References
- Abagyan Ra, Totrov MM. Contact area difference (CAD): a robust measure to evaluate accuracy of protein models. J Mol Biol. 1997;268:678–685. doi: 10.1006/jmbi.1997.0994. [DOI] [PubMed] [Google Scholar]
- Allen WJ, Rizzo RC. Implementation of the Hungarian Algorithm to Account for Ligand Symmetry and Similarity in Structure-Based Design. J Chem Inf Model. 2014;54:518–529. doi: 10.1021/ci400534h. [DOI] [PMC free article] [PubMed] [Google Scholar]
- Beck DA, Alonso DO, Daggett V. A microscopic view of peptide and protein solvation. Biophys Chem. 2002;100:221–237. doi: 10.1016/S0301-4622(02)00283-1. [DOI] [PubMed] [Google Scholar]
- Bonett DG. Confidence interval for a coefficient of quartile variation. Comput Stat Data Anal. 2006;50:2953–2957. doi: 10.1016/j.csda.2005.05.007. [DOI] [Google Scholar]
- Brylinski M, Feinstein WP. eFindSite: Improved prediction of ligand binding sites in protein models using meta-threading, machine learning and auxiliary ligands. J Comput Aided Mol Des. 2013;27:551–567. doi: 10.1007/s10822-013-9663-5. [DOI] [PubMed] [Google Scholar]
- Brylinski M, Skolnick J. Q-Dock LHM: Low-resolution refinement for ligand comparative modeling. J Comput Chem. 2009a;31:NA–NA. doi: 10.1002/jcc.21395. [DOI] [PMC free article] [PubMed] [Google Scholar]
- Brylinski M, Skolnick J. FINDSITELHM: A Threading-Based Approach to Ligand Homology Modeling. PLoS Comput Biol. 2009b;5:e1000405. doi: 10.1371/journal.pcbi.1000405. [DOI] [PMC free article] [PubMed] [Google Scholar]
- Brylinski M, Skolnick J. Q-Dock: Low-resolution flexible ligand docking with pocket-specific threading restraints. J Comput Chem. 2008;29:1574–1588. doi: 10.1002/jcc.20917. [DOI] [PMC free article] [PubMed] [Google Scholar]
- Chang C-ea, Chen W, Gilson MK. Ligand configurational entropy and protein binding. Proc Natl Acad Sci. 2007;104:1534–1539. doi: 10.1073/pnas.0610494104. [DOI] [PMC free article] [PubMed] [Google Scholar]
- Cheng T, Li Q, Zhou Z, Wang Y, Bryant SH. Structure-Based Virtual Screening for Drug Discovery: a Problem-Centric Review. AAPS J. 2012;14:133–141. doi: 10.1208/s12248-012-9322-0. [DOI] [PMC free article] [PubMed] [Google Scholar]
- Clark M, Cramer RD, Van Opdenbosch N. Validation of the general purpose tripos 5.2 force field. J Comput Chem. 1989;10:982–1012. doi: 10.1002/jcc.540100804. [DOI] [Google Scholar]
- Ding Y, Fang Y, Feinstein WP, Ramanujam J, Koppelman DM, Moreno J, Brylinski M, Jarrell M. GeauxDock: A novel approach for mixed-resolution ligand docking using a descriptor-based force field. J Comput Chem. 2015;36:2013–2026. doi: 10.1002/jcc.24031. [DOI] [PubMed] [Google Scholar]
- Feinstein WP, Brylinski M. Calculating an optimal box size for ligand docking and virtual screening against experimental and predicted binding pockets. J Cheminform. 2015;7:18. doi: 10.1186/s13321-015-0067-5. [DOI] [PMC free article] [PubMed] [Google Scholar]
- Fieller EC, Hartley HO, Pearson ES. Tests for Rank Correlation Coefficients. I. Biometrika. 1957;44:470. doi: 10.2307/2332878. [DOI] [Google Scholar]
- Fisher Ra, Fisher Ra. Frequency distribution of the values of the correlation coefficient in samples from an indefinitely large population. Biometrika. 1915;10:507–521. doi: 10.2307/2331838. [DOI] [Google Scholar]
- Gao M, Skolnick J. APoc: Large-scale identification of similar protein pockets. Bioinformatics. 2013a;29:597–604. doi: 10.1093/bioinformatics/btt024. [DOI] [PMC free article] [PubMed] [Google Scholar]
- Gao M, Skolnick J. A Comprehensive Survey of Small-Molecule Binding Pockets in Proteins. PLoS Comput Biol. 2013b;9:e1003302. doi: 10.1371/journal.pcbi.1003302. [DOI] [PMC free article] [PubMed] [Google Scholar]
- Ito JI, Tabei Y, Shimizu K, Tomii K, Tsuda K. PDB-scale analysis of known and putative ligand-binding sites with structural sketches. Proteins Struct Funct Bioinforma. 2012;80:747–763. doi: 10.1002/prot.23232. [DOI] [PubMed] [Google Scholar]
- Ito JI, Tabei Y, Shimizu K, Tsuda K, Tomii K. PoSSuM: a database of similar protein-ligand binding and putative pockets. Nucleic Acids Res. 2012;40:D541–D548. doi: 10.1093/nar/gkr1130. [DOI] [PMC free article] [PubMed] [Google Scholar]
- James MNG, Sielecki AR, Moult J, Hruby V, Rich D. Crystallographic Analysis of a Pepstatin Analogue Binding to the Aspartyl Proteinase Penicillopepsin at 1.8 Angstroms Resolution. Peptides: Structure and Function, Proceedings of the of the Eighth American Peptide Symposium. 1983:521–530. [Google Scholar]
- Kabsch W. A discussion of the solution for the best rotation to relate two sets of vectors. Acta Crystallogr Sect A. 1978;34:827–828. doi: 10.1107/S0567739478001680. [DOI] [Google Scholar]
- Katz BA, Mackman R, Luong C, Radika K, Martelli A, Sprengeler PA, Wang J, Chan H, Wong L. Structural basis for selectivity of a small molecule, S1-binding, submicromolar inhibitor of urokinase-type plasminogen activator. Chem Biol. 2000;7:299–312. doi: 10.1016/S1074-5521(00)00104-6. [DOI] [PubMed] [Google Scholar]
- Kawabata T. Build-up algorithm for atomic correspondence between chemical structures. J Chem Inf Model. 2011;51:1775–87. doi: 10.1021/ci2001023. [DOI] [PubMed] [Google Scholar]
- Kinney JB, Atwal GS. Equitability, mutual information, and the maximal information coefficient. Proc Natl Acad Sci. 2014;111:3354–3359. doi: 10.1073/pnas.1309933111. [DOI] [PMC free article] [PubMed] [Google Scholar]
- Kroemer RT, Vulpetti A, McDonald JJ, Rohrer DC, Trosset JY, Giordanetto F, Cotesta S, McMartin C, Kihlén M, Stouten PFW. Assessment of Docking Poses: Interactions-Based Accuracy Classification (IBAC) versus Crystal Structure Deviations. J Chem Inf Comput Sci. 2004;44:871–881. doi: 10.1021/ci049970m. [DOI] [PubMed] [Google Scholar]
- Lill Ma. Efficient Incorporation of Protein Flexibility and Dynamics into Molecular Docking Simulations. Biochemistry. 2011;50:6157–6169. doi: 10.1021/bi2004558. [DOI] [PMC free article] [PubMed] [Google Scholar]
- Matthews BW. Comparison of the predicted and observed secondary structure of T4 phage lysozyme. Biochim Biophys Acta - Protein Struct. 1975;405:442–451. doi: 10.1016/0005-2795(75)90109-9. [DOI] [PubMed] [Google Scholar]
- Meiler J, Baker D. ROSETTALIGAND: Protein-small molecule docking with full side-chain flexibility. Proteins Struct Funct Bioinforma. 2006;65:538–548. doi: 10.1002/prot.21086. [DOI] [PubMed] [Google Scholar]
- Millan DS, Bunnage ME, Burrows JL, Butcher KJ, Dodd PG, Evans TJ, Fairman DA, Hughes SJ, Kilty IC, Lemaitre A, Lewthwaite RA, Mahnke A, Mathias JP, Philip J, Smith RT, Stefaniak MH, Yeadon M, Phillips C. Design and Synthesis of Inhaled p38 Inhibitors for the Treatment of Chronic Obstructive Pulmonary Disease. J Med Chem. 2011;54:7797–7814. doi: 10.1021/jm200677b. [DOI] [PubMed] [Google Scholar]
- Nissink JWM, Murray C, Hartshorn M, Verdonk ML, Cole JC, Taylor R. A new test set for validating predictions of protein-ligand interaction. Proteins Struct Funct Bioinforma. 2002;49:457–471. doi: 10.1002/prot.10232. [DOI] [PubMed] [Google Scholar]
- O’Boyle NM, Banck M, James Ca, Morley C, Vandermeersch T, Hutchison GR. Open Babel: An Open chemical toolbox. J Cheminform. 2011;3:33. doi: 10.1186/1758-2946-3-33. [DOI] [PMC free article] [PubMed] [Google Scholar]
- Oliphant TE. Python for Scientific Computing. Comput Sci Eng. 2007;9:10–20. doi: 10.1109/MCSE.2007.58. [DOI] [Google Scholar]
- Pandit S, Skolnick J. Fr-TM-align: a new protein structural alignment method based on fragment alignments and the TM-score. BMC Bioinformatics. 2008;9:531. doi: 10.1186/1471-2105-9-531. [DOI] [PMC free article] [PubMed] [Google Scholar]
- Reshef DN, Reshef YA, Finucane HK, Grossman SR, McVean G, Turnbaugh PJ, Lander ES, Mitzenmacher M, Sabeti PC. Detecting Novel Associations in Large Data Sets. Science. 2011;334(80):1518–1524. doi: 10.1126/science.1205438. [DOI] [PMC free article] [PubMed] [Google Scholar]
- Reva B, Finkelstein A, Skolnick J. What is the probability of a chance prediction of a protein structure with an rmsd of 6 Å? Fold Des. 1998;3:141–7. doi: 10.1016/S1359-0278(98)00019-4. [DOI] [PubMed] [Google Scholar]
- Řezáčová P, Kožíšek M, Moy SF, Sieglová I, Joachimiak A, Machius M, Otwinowski Z. Crystal structures of the effector-binding domain of repressor Central glycolytic gene Regulator from Bacillus subtilis reveal ligand-induced structural changes upon binding of several glycolytic intermediates. Mol Microbiol. 2008;69:895–910. doi: 10.1038/nchembio.162. [DOI] [PMC free article] [PubMed] [Google Scholar]
- Simard JR, Klüter S, Grütter C, Getlik M, Rabiller M, Rode HB, Rauh D. A new screening assay for allosteric inhibitors of cSrc. Nat Chem Biol. 2009;5:394–396. doi: 10.1038/nchembio.162. [DOI] [PubMed] [Google Scholar]
- Stark A, Sunyaev S, Russell RB. A Model for Statistical Significance of Local Similarities in Structure. J Mol Biol. 2003;326:1307–1316. doi: 10.1016/S0022-2836(03)00045-7. [DOI] [PubMed] [Google Scholar]
- Trott O, Olson A. AutoDock Vina: improving the speed and accuracy of docking with a new scoring function, efficient optimization and multithreading. J Comput Chem. 2010;31:455–461. doi: 10.1002/jcc.21334.AutoDock. [DOI] [PMC free article] [PubMed] [Google Scholar]
- Wang G, Dunbrack RL. PISCES: a protein sequence culling server. Bioinformatics. 2003;19:1589–1591. doi: 10.1093/bioinformatics/btg224. [DOI] [PubMed] [Google Scholar]
- Yang J, Roy A, Zhang Y. BioLiP: A semi-manually curated database for biologically relevant ligand-protein interactions. Nucleic Acids Res. 2013;41:1096–1103. doi: 10.1093/nar/gks966. [DOI] [PMC free article] [PubMed] [Google Scholar]
- Yuriev E, Holien J, Ramsland Pa. Improvements, trends, and new ideas in molecular docking: 2012–2013 in review. J Mol Recognit. 2015:n/a–n/a. doi: 10.1002/jmr.2471. [DOI] [PubMed] [Google Scholar]
- Yusuf D, Davis AM, Kleywegt GJ, Schmitt S. An alternative method for the evaluation of docking performance: RSR vs RMSD. J Chem Inf Model. 2008;48:1411–1422. doi: 10.1021/ci800084x. [DOI] [PubMed] [Google Scholar]
- Zacharias M. Protein-protein docking with a reduced protein model accounting for side-chain flexibility. Protein Sci. 2003;12:1271–1282. doi: 10.1110/ps.0239303. [DOI] [PMC free article] [PubMed] [Google Scholar]
- Zhang R, Andersson CE, Savchenko A, Skarina T, Evdokimova E, Beasley S, Arrowsmith CH, Edwards AM, Joachimiak A, Mowbray SL. Structure of Escherichia coli Ribose-5-Phosphate Isomerase. Structure. 2003;11:31–42. doi: 10.1016/S0969-2126(02)00933-4. [DOI] [PMC free article] [PubMed] [Google Scholar]
- Zhang Y, Skolnick J. Scoring function for automated assessment of protein structure template quality. Proteins. 2004;57:702–10. doi: 10.1002/prot.20264. [DOI] [PubMed] [Google Scholar]
Associated Data
This section collects any data citations, data availability statements, or supplementary materials included in this article.