

Abstract
A small percentage of cancer radiotherapy patients develop abnormally severe side effects as a consequence of intrinsic radiosensitivity. We analysed the γ-H2AX response to ex-vivo irradiation of peripheral blood lymphocytes (PBL) and plucked eyebrow hair follicles from 16 patients who developed severe late radiation toxicity following radiotherapy, and 12 matched control patients. Longer retention of the γ-H2AX signal and lower colocalization efficiency of repair factors in over-responding patients confirmed that DNA repair in these individuals was compromised. Five of the radiosensitive patients harboured LoF mutations in DNA repair genes. An extensive range of quantitative parameters of the γ-H2AX response were studied with the objective to establish a predictor for radiosensitivity status. The most powerful predictor was the combination of the fraction of the unrepairable component of γ-H2AX foci and repair rate in PBL, both derived from non-linear regression analysis of foci repair kinetics. We introduce a visual representation of radiosenstivity status that allocates a position for each patient on a two-dimensional “radiosensitivity map”. This analytical approach provides the basis for larger prospective studies to further refine the algorithm, ultimately to triage capability.
Keywords: Radiation therapy, radiosensitivity, predictive assays, DNA repair, γ-H2AX, statistical criteria
Introduction
Despite continual improvement in the efficacy of radiotherapy (RT), its success is still limited by the inability to accurately identify prior to treatment, those patients who will suffer severe normal tissue toxicity due to intrinsic radiosensitivity (RS). The doses prescribed in current practice are largely based on the clinically determined tolerance of the normal tissues in the radiation field, and have evolved empirically to limit the proportion of patients who will suffer severe adverse reactions to about 1-5% of cases. Therefore, this small subgroup dictates the prescribed RT dose for the whole group. Identification of RS individuals prior to commencing RT is essential for the development of personalized treatment in radiation oncology 1.
Several methodologies have been applied to develop predictive assays based on in-vitro cellular radiation response as a surrogate for clinical RS; none of them have yet progressed to clinical adoption. The role of germline genetic variations in the response to radiation has been studied extensively with the aim to establish predictive genetic markers for radiation toxicity 2-6. Although the majority of these investigations have not found unambiguous associations, recent studies identified predictive genes in prostate and breast cancer patients 3, 7, 8, indicating that optimizing RT through the identification of key genes related to the radioresistance/radiosensitivity phenotype might be possible in future 9. Meanwhile, the development of a functional predictive assay based on cellular response to radiation remains an appealing proposition 10, 11.
Clinical RS is often linked to defects in DNA repair 12-14. Recently, there has been much attention focussed on the development of a functional assay in peripheral blood lymphocytes (PBL) that is based on monitoring γ-H2AX (phosphorylated histone H2AX) 15-17. The assay detects induction and repair of DNA of DNA double-strand breaks (DSB) following ex-vivo irradiation of individual cells in a small volume of blood. The results are available within a week, enabling timely clinical decisions.
In 22 relevant studies published in 2008-2016, the post-irradiation γ-H2AX response has been compared in “over-responders” (OR), “not-over-responders” (NOR), and normal blood donors 18-38, including our report of a RS clinical case 39. Thirteen studies reported the ability of the assay to predict RT-associated normal tissue toxicity, while 9 studies reported that the biomarker is not predictive. These publications have provided valuable information for selection of patient cohorts, experimental conditions, read-out techniques, and analytical methods. Accordingly, we tested a variety of experimental settings and quantitative predictive criteria, aiming to optimize the γ-H2AX-assay so it could robustly recognize increased RS. We used ex-vivo irradiated primary tissues (blood and eyebrow hair follicles) from a cohort of re-called 16 ex-RT patients who had experienced extreme late (in one case unexpectedly extreme acute) normal tissue toxicity, and 12 matched control patients with normal clinical RS. We also analyzed a panel of 417 DNA repair genes in the OR patients. The objective of this study was to establish, from analysis of DNA repair in this small retrospective study, the basis for design of larger prospective studies to discriminate between OR and NOR patients, with the ultimate aim of developing a predictive assay to identify radiosensitive individuals amongst patients enrolled for RT.
1. Materials and Methods
2.1. Patients
OR patients were identified at Peter MacCallum Cancer Centre (PMCC) as exhibiting Radiation Therapy Oncology Group (RTOG) Grade 3-4 late toxicity. Patient RS8 was an exception, with abnormally severe acute toxicity (severe moist desquamation, affecting the entire breast after only 20 Gy of radiation, and eventually had bilateral mastectomy for disease recurrence). Review of the clinical and treatment details of each patient confirmed that toxicity was greater than would be expected for the particular treatment site, volume irradiated, and radiation dose. For each OR patient, a NOR control without severe acute or late radiation toxicity was identified, matched for sex, treatment site and intent, RT dose, use of chemotherapy and where possible, approximate age. All patients, presented in Table 1, were followed-up for at least 5 years. The study was approved by the institutional ethics committee; all patients gave written informed consent.
Table 1.
OR and NOR patients' characteristics and RT-induced normal tissue toxicity.
| Patient ID | Sex | Age | Site | Histopathology | Stage | Dose | PTV min (Gy) | PTV max (Gy) | Late normal tissue toxicity (G3 and higher) | |||||
|---|---|---|---|---|---|---|---|---|---|---|---|---|---|---|
| OR patients | ||||||||||||||
| RS1 | F | 63 | Tongue | Small cell carcinoma | T2N2b | 66/33 | 59.6 | 67.6 | Dental decay and xerostomia | |||||
| RS2 | M | 50 | Parotid | Adeno-carcinoma | T2N1 | 60/30 | Significant fibrosis, neck | |||||||
| RS3 | F | 65 | Parotid | Adenoid cystic | 66/33 | Severe xerostomia and difficulty swallowing | ||||||||
| RS4 | M | 45 | Tonsil | Small cell carcinoma | T2N2b | 70/35 | Bilateral brachial plexopathy, bilateral hypoglossal nerve palsy | |||||||
| RS5 | M | 54 | Nasopharynx | Small cell carcinoma | T1N0 | 70/35 | Hearing loss, vestibular nerve dysfunction, xerostomia | |||||||
| RS6 | F | 78 | Buccal mucosa | Small cell carcinoma | T1N2b | 54/30 | 40.9 | 55.5 | Tongue ulceration, inability to wear dentures | |||||
| RS7 | F | 60 | Anus | Small cell carcinoma | T2N0 | 54/30 | Telangiectasia, atrophy of skin, perianal discomfort | |||||||
| RS8 | F | 40 | Breast | Invasive ductal carcinoma | T1cN0 | 42.4/16 +10/4 | 38.9 | 44.1 | Severe generalised moist desquamation breast after 20 Gy* | |||||
| RS9 | F | 37 | Cervix | Small cell carcinoma | IB | 54/30 | G3 Cystitis | |||||||
| RS10 | F | 59 | Endometrium | Clear cell carcinoma | 1bN0 | 48.6/27 | G3 Gastrointestinal toxicity | |||||||
| RS11 | M | 59 | Larynx | Small cell carcinoma | T2N2c | 70/35 | 59.7 | 73.5 | Brachial plexopathy, telangiectasia on cord | |||||
| RS12 | F | 76 | Endometrium | Carcinoma | IcN+ | 48.6/27 | G3 Neuropathy | |||||||
| RS13 | M | 65 | Nasopharynx | Small cell carcinoma | T2N1 | 70/35 | G3 Dysphagia | |||||||
| RS14 | F | 44 | Breast | 45/15 | Telangiectasia, fibrosis | |||||||||
| RS15 | M | 68 | Tonsil | Small cell carcinoma | T2N2a | 70/35 | G3 xerostomia, osteoradionecrosis trismus | |||||||
| RS16 | F | 43 | Tongue | Small cell carcinoma | T2N2a | 70/35 | 52 | 74.9 | Fibrosis, teleangiectasia | |||||
| NOR patients | ||||||||||||||
| C1(6) | F | 55 | Tongue | Small cell carcinoma | T3N1 | 60/30 | 44.8 | 64.2 | None | |||||
| C2(3) | M | 59 | Parotid | Small cell carcinoma | T2N0 | 60/30 | 26.65 | 63.5 | None | |||||
| C4 | M | 40 | Tonsil | Small cell carcinoma | T2N2b | 70/35 | None | |||||||
| C5 | M | 39 | Nasopharynx | Small cell carcinoma | T2bN0 | 70/35 | 66.5 | 75 | None | |||||
| C7 | F | 51 | Anus | Small cell carcinoma | T3N2 | 54/30 | 42.75 | 61.4 | None | |||||
| C8(14) | F | 54 | Breast | Invasive ductal carcinoma | T1bN0 | 42.2/16 +10/4 | 39.5 | 44.6 | None | |||||
| C9 | F | 34 | Cervix | Small cell carcinoma | IB | 54/30 | None | |||||||
| C10 | F | 59 | Endometrium | Adeno-carcinoma | III3 | 48.6/27 | None | |||||||
| C11 | M | 71 | Piriform fossa | Small cell carcinoma | T2N2 | 70/35 | 61.6 | 75 | None | |||||
| C12 | F | 58 | Endometrium | Adeno-carcinoma | Ic | 48.6/27 | None | |||||||
| C13(15) | M | 65 | Tongue | Small cell carcinoma | T2n2c | 70/35 | 59 | 75.2 | None | |||||
| C16 | F | 51 | Tongue | Small cell carcinoma | T2N2c | 70/35 | 60.8 | 74.9 | None | |||||
Acute normal tissue toxicity
2.2. PBL and hair processing and irradiation
When possible, tissue samples from an OR/NOR pair were collected and processed simultaneously. In all instances, they were immunostained simultaneously.
Prior to receiving patient blood samples, RPMI-1640 medium (Gibco Life Technologies, Australia) supplemented with 10% FBS (Gibco Life Technologies) and 0.1% gentamicin (Pfizer, Australia) was placed in the 37°C/5% CO2 incubator. Blood was collected in 3 Vacuette 9-ml EDTA tubes (Greiner Bio One, Germany) and diluted to 60 ml with PBS (made-in-house). PBL were separated on Ficoll-Paque PLUS (GE Healthcare Bio Sciences, UK) by spinning with Heraeus Multifuge X3R centrifuge (Thermo Scientific, USA) at 600 g for 45 min. For the OR patients, aliquots of the PBL suspensions were frozen at -80°C for genetic analysis.
The remainder of the lymphocyte suspension was removed to pre-conditioned medium for 30 min, split into three 15-ml tubes and irradiated to 0.5, 1, or 2 Gy using the 137Caesium source (GammaCell 40 Irradiator, Nordion International, Kanata, Canada), with dose rates of 0.531 Gy/min, with the view to identifying the optimum dose to separate the γ-H2AX response in OR and NOR groups. The three sets of irradiated lymphocytes for each patient were transferred to 25 cm3 flasks (Greiner Bio One, Australia),incubated at 37°C/5% CO2 and fixed with 4% paraformaldehyde (Electron Microscopy Sciences, USA) at 1, 3, 6, 8 and 24 hrsUnirradiated control samples were incubated for 1 hr. The samples were stored in 70% ethanol at -20°C.
Twelve eyebrow hairs were plucked, placed in 4 medium-contained 1.5ml-tubes (Eppendorf, Germany) (3 hairs per tube), irradiated to 3 Gy and incubated for 3, 8 and 24 hrs. We omitted the 1-hr time-point, because pilot experiments demonstrated the maximum γ-H2AX response in hair follicles at 3 hrs post-irradiation. Unirradiated control samples were incubated for 3 hrs. The hairs were fixed with 4% paraformaldehyde and stored at -20°C in 70% ethanol. Immunostaining and microscopy are described in Supplementary Materials.
2.3. Image and data analysis
Analysis of coded maximum projection images obtained from z-stacks of confocal microscopy images was conducted with the in-house developed JCountPro software39-41. γ-H2AX foci were counted in 150-300 cells for each experimental point. Raw foci numbers were used, without subtraction of the foci numbers in unirradiated cells, since in several instances we detected less foci at 24 hrs than at the baseline. Baseline foci values for each patient are presented in Supplementary Table 1. A frequency distribution was built that was fitted to the Poisson distribution. As described previously 39, 41, the average number for foci per cell was obtained from the best fit Poisson distribution.
The kinetics of foci decline was approximated by non-linear regression analysis using a model that assumes a single exponential decay component with an unrepairable component (the asymptotic level approached at t→∞):
| Equation 1 |
N(t) is the average number of foci at time t, NM - the maximum foci number, Q - the fractional unrepairable component, R - the repair rate. The Q and R are constants for each set of data (i.e. each patient); the values reported in Results correspond to the statistically best fit curves through the experimental data.
For colocalization analysis, γ-H2AX and 53BP1 foci were independently identified in the respective green and red color channels of each image. For each γ-H2AX focus, we calculated the fraction of the focus area expressed as a number of pixels that topologically overlapped with a 53BP1 focus if such a focus was found at the same location (otherwise the fraction was 0). A γ-H2AX focus was defined as colocalized with a 53BP1 focus, if this fraction was greater than a threshold value of 0.1. The fraction of colocalized γ-H2AX foci was then calculated as the ratio of the number of colocalized foci to the total number of γ-H2AX foci.
Prism 5 for Windows (GraphPad Prism Software Inc, USA) was used for regression and Receiver Operating Characteristic (ROC) analysis 42 and for testing statistical hypotheses.
DNA extraction and genetic analysis
DNA was extracted from PBL from 16 OR patients using the DNeasy Blood and Tissue Kit (Qiagen, Australia) as per the recommended protocol and probed for 417 genes involved in DNA repair using a custom targeted sequencing panel. The gene collection was compiled by combining (i) the genes associated with the ‘DNA repair’ gene ontology term GO:0006281 (412 genes downloaded from Ensembl biomart on 5/5/2013) and (ii) the KEGG ‘DNA repair’ gene list (42 genes as of August 2013). The DNA repair gene collection is described in Supplementary Materials, together with other extended details of methodology.
2. Results
3.1. Pairwise comparison of γ-H2AX foci kinetics parameters in PBL
We studied γ-H2AX foci kinetics in 16 OR and 12 matching NOR patients. Some patients in the NOR group matched more than one OR patient; C1(6) (control for patients RS1 and RS6), C2(3), C8(14), and C13(15). Ideally, pairwise analysis would employ discrete pairs, but we adopted this compromise as a preliminary approach. Subsequent analyses compared the OR and NOR groups as separate populations.
The γ-H2AX post-irradiation decline is a surrogate for DNA DSB repair that is characterised by fast and slow repair components and an unrepairable component 14, 41, 43. The limited life span of PBL in culture prevents reliable detection of γ-H2AX foci beyond 24 hrs and analysis of the slow-repair component. Accordingly, we used an empirical model that assumes just one exponential repair process and the unrepairable component. The γ-H2AX kinetics at three doses for each patient were approximated by non-linear regression using Equation 1, assuming that R and Q are the same for all doses, but NM is dose-dependent. The application of this model also assumes that foci numbers reach the maximum before/or at 1 hr with subsequent decline 15, 41. Supplementary Table 2 summarises the best fit Q and R values for all individual patients and the results of pairwise comparison of these values. The results for patients C4, C9 and RS4 were excluded from this analysis, since the data did not fit the model described by Equation 1; for these patients the foci peaked at 3 or even 6 hrs. Apart from these three patients, the values for R-squared (a measure of the goodness of the fit) were in the range 0.80 – 0.99, compared to 0.66 for C4 and 0.54 for C9. For RS4, R-squared was 0.83, however since the foci peaked at 6 hrs, Q and R could not be derived from just two time points. Delayed foci formation has been previously reported for RS patients 33 and aging individuals 44. In a prospective clinical scenario, patients with such spurious results would be subjected to further analysis, but in this study, further recall was logistically and ethically challenging.
We ascribed either increased Q or decreased R to increased RS. From 14 compared pairs, 12 OR partners (86%) were RS, based on greater Q, and 9 OR partners (64%), based on the lower R. Overall, all 14 pairs (100%) demonstrate an increased RS for the OR partner. In the majority of cases, the differences in Q were statistically significant. Thus, the γ-H2AX kinetics of OR and NOR patients are different, and Q and R can be suggested as complementary parameters in assessing RS.
3.2. Q and R as statistical criteria to distinguish OR and NOR groups
Figure 1 presents the average γ-H2AX foci numbers across NOR and OR groups to three doses over 5 post-irradiation time-points, and the results of non-linear regression of these data (Equation 1). Comparison of the regression parameters demonstrated a statistically significant increase of Q (p=0.00002) and a trend for a smaller R in the OR group compared to the NOR group, on the border of statistical significance (p=0.06).
Figure 1. Comparison of the γ-H2AX foci kinetics in PBL of NOR and OR patients.
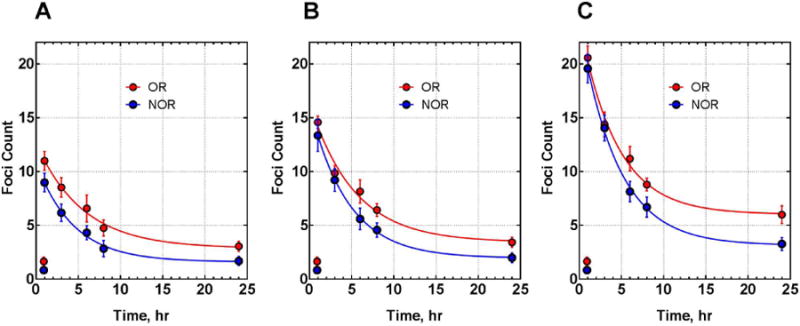
PBL were irradiated with 0.5 (A), 1 (B) and 2Gy (C). Each data point represents the mean and the standard error for foci number in a given group at each dose and time point. Lines are generated by non-linear regression (Equation 1) assuming shared values of Q and R for different doses within the same group. Q values are 0.228±0.013 and 0.134±0.007 for OR and NOR groups respectively, p=0.00002; R values are 0.192±0.016 and 0.226±0.011 for OR and NOR groups respectively, p=0.06.
The scatter plots of these parameters for individual patients (from Supplementary Table 2) are shown in Figure 2A-B. Comparison of OR and NOR groups using unpaired two-tailed t-test demonstrated a statistically significant increase of Q (p=0.0093) and a trend for decreased R in OR group, but it is not statistically significant (p=0.70). The area under the ROC curve (AUC), a measure of the classification performance, indicates a good predictive power of Q (AUC=0.81), but poor of R (AUC=0.61) (Figure 2C).
Figure 2. Q and R as classifiers.
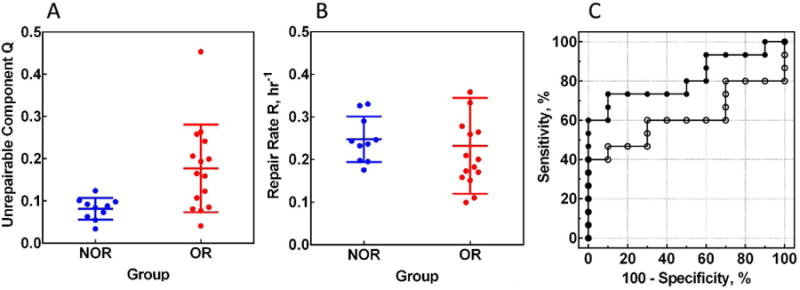
Scatter plots for Q (A) and R (B) values for individual patients in NOR (n = 10) and OR (n = 15) groups. The values are: for Q, 0.081±0.009 and 0.177±0.027 for NOR and OR groups respectively, p=0.0093; for R, 0.247±0.017 and 0.232±0.029 for NOR and OR groups respectively, p=0.70. (C) ROC curves for Q (solid circles) and R (open circles). AUC values are: 0.81±0.09 for Q and 0.61±0.11 for R.
3.3 Analysis of individual doses
We analyzed the γ-H2AX kinetics for each dose (0.5, 1 and 2Gy) to establish if Q may better distinguish NOR and OR groups at any particular dose. Scatter plots and ROC curves for Q calculated from the regression analysis of the kinetics data for each dose are presented in Supplementary Figure 1. Table 2, with the results of the statistical comparison of Q in NOR and OR groups, and AUC for ROC curves, demonstrates a trend for increasing performance (increased AUC and decreased p-values) with increasing dose. Of the three radiation doses tested, we propose 2 Gy to be the best to separate OR and NOR groups.
Table 2.
Comparison of the average Q values between NOR and OR groups for individual doses and results of ROC analysis.
| Dose | 0.5 Gy | 1 Gy | 2 Gy | Combined |
|---|---|---|---|---|
| Q (NOR) | 0.094±0.019 | 0.069±0.009 | 0.104±0.029 | 0.081±0.008 |
| Q (OR) | 0.185±0.035 | 0.180±0.041 | 0.268±0.045 | 0.177±0.027 |
| AUC | 0.76±0.11 | 0.83±0.08 | 0.86±0.07 | 0.81±0.09 |
| p-Value Unpaired t-test/Mann-Whitney test | 0.0576/0.0301 | 0.0403/0.0044 | 0.0095/0.0019 | 0.0093/0.0079 |
3.4. Alternative classifiers
We also considered alternative classifiers, namely the apparent repair rate in the 1–8-hr time interval, which can be calculated using a simpler linear regression algorithm we described previously 39, and the ratio of foci number at 1/24 hrs, suggested by van Oorschot et al. 32, 38. The scatter plots for NOR and OR groups are presented in Supplementary Figure 2. Supplementary Tables 3 and 4 summarize results of the analysis. Both classifiers demonstrated a statistically significant difference between NOR and OR groups with a good predictive value (AUC=0.79-0.85 for the individual doses, without particular preference). When the data for the three doses are combined, the AUC values for the rate and ratio classifiers improved to 0.91 and 0.89, respectively; which we ascribe to the 3-fold increase in the number of data points involved in the analysis.
Timely assembly of repair factors at the sites of DSB breaks is critical for efficient DNA repair and genome stability 14, 44-47. Non-efficient post-irradiation colocalization of γ-H2AX and 53BP1 foci could be an independent indicator of compromized DNA repair 41, 44, and therefore a potential classifier. The differences of the fractions of γ-H2AX foci that colocalized with 53BP1 foci between NOR and OR groups were statistically significant at 3 and 6 hrs post-irradiation (p<0.01 for both), but not at 1, 8 and 24 hrs (Supplementary Figure 3 and Supplementary Table 5). The best AUC value (0.85) was achieved at 6 hrs.
3.5. Development of a combined classifier
The increased chance to classify OR as RS by pairwise comparison of OR and NOR, based on the combined criterion of either larger Q or smaller R (section 3.1), indicates that these parameters are to a large extent independent,. This prompted development of a 2-D representation of these parameters for each patient; the “RS map” (Figure 3A). The map is divided into two zones, non-RS and RS, defined by establishing threshold values for each classifier. A value of Q greater or R smaller than the threshold defines an increased RS status. At the extremes, the bottom right corner of Figure 3A is clearly non-RS; fast repair and small Q; the top left corner is RS “territory”.
Figure 3. Development of a combined classifier.
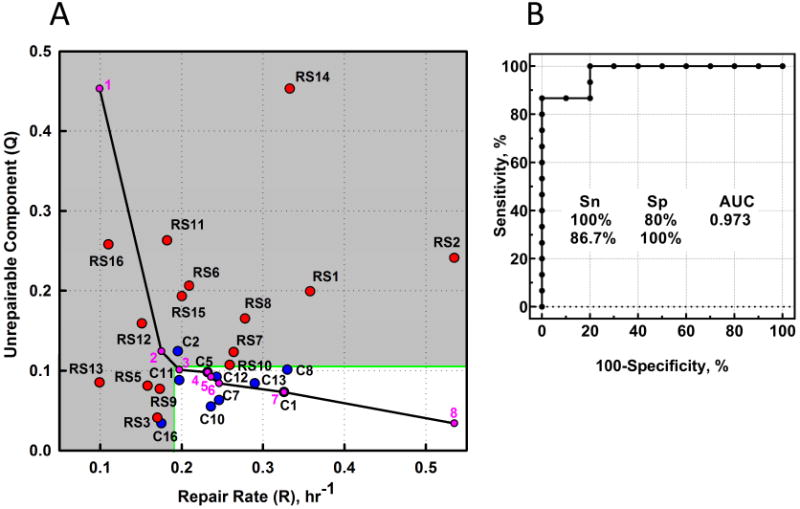
(A) The RS map. The position of each symbol (individual patient) is defined by Q and R from non-linear regression of the foci kinetics. Red symbols, OR; blue symbols, NOR. Green lines, an example of dividing the map into “non-RS zone” (white) and “RS zone” (grey) by setting a threshold value for each parameter and assuming that Q greater or R smaller than the threshold define the increased RS status. The grey zone contains all the OR points (Sensitivity=100%), and excludes all but two of the 10 NOR points (Specificity=80%). The black solid line represents a set of combinations of Q and R threshold values that are optimal for the prediction of RS status (“optimal path”). To build the optimal path, maximum and minimum values for both parameters for all OR and NOR data are calculated; thus the (purple) point 1 has the coordinates (Qmax, Rmin) and the last point (8) is at (Qmin, Rmax). The intervening points (2-7) were obtained by calculating a set of (Qimaxc, Riminc) values for the NOR data, for which each subsequent maximum and minimum values are calculated from a subset of R and Q values obtained by removing points that determine minimum and maximum values for the previous step. (B) The results of ROC analysis using the set of Q and R threshold combinations from the optimal path.
To estimate the predictive performance of the combined discriminator, we first established an “optimal path”, as detailed in Figure 3 legend. To generate the data for ROC analysis (Figure 3B), the data in Figure 3A is enveloped by an increasing area (illustrated by the grey area), as the top left corner of the white rectangle follows down the coordinates of the optimal path. Combination of Q and R demonstrate an excellent predictive performance (AUC=0.97), suggesting that at 100% specificity (zero false-positive rate) a sensitivity level can be achieved up to 86.7% (i.e. 86.7% of potential OR patients will be classified as RS). A higher sensitivity level can be achieved (100%) at the cost of reduced specificity (80%).
A predictive performance of the assay can also increase when Q is combined with the apparent repair rate in the 1-8 hr interval (AUC=0.96), the ratio of foci at 1/24 hrs (AUC=0.89), and the fraction of colocalized γ-H2AX and 53BP1 foci (AUC=0.89). We prefer the combination of Q and R classifiers since it only requires fitting experimental data using Equation 1.
3.6. Analysis of γ-H2AX foci in hair follicles
Ease of collection deems PBL as the diagnostic tissue of choice, but it invokes the basic assumption that RS status of PBL reflects that of other cell types. To support this assumption, we studied the γ-H2AX response in cells of another tissue that can be sampled with minimal invasiveness. The limited number of eyebrow hairs available from each patient restricted the time-points to 3, 8 and 24 hrs post-3 Gy irradiation and precluded regression analysis. We used the ratio of foci at 3/24 hrs to compare NOR and OR groups; the differences are evident from Figure 4A-C (p=0.0017). Pairwise analysis of NOR and OR patients confirmed the RS status in 11 out of 12 (92%) OR patients (Supplementary Table 5; patients C7, C13(15) and RS14 were excluded from analysis due to the limited number of hairs suitable for analysis). ROC analysis (Figure 4D) indicates a good predictive value of this parameter in hairs (AUC=0.90), as it was for the ratio of foci at 1/24 hrs in PBL (AUC=0.89).
Figure 4. γ-H2AX response in hair follicles.
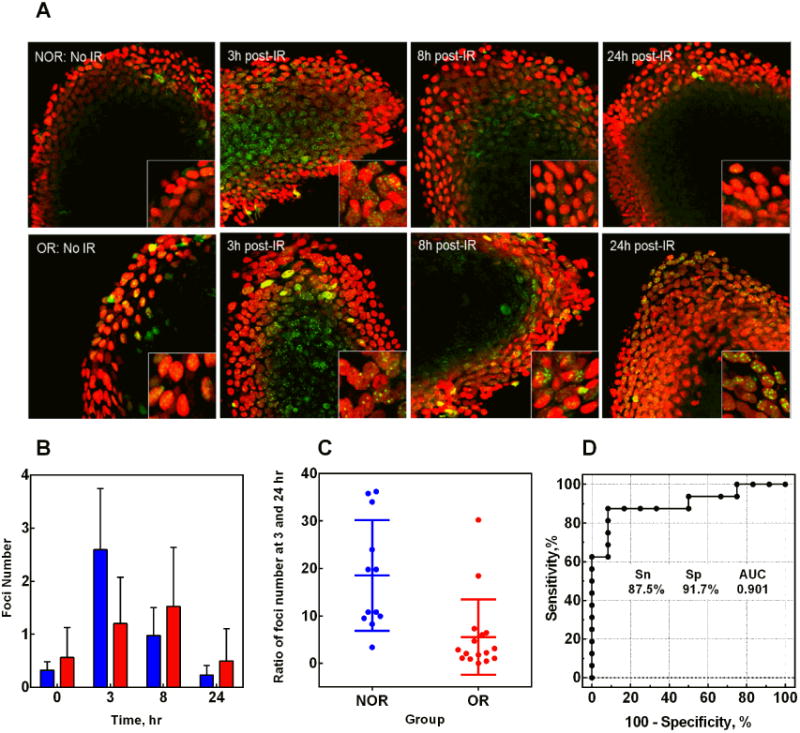
(A) Representative maximum projection images obtained from z-stacks of confocal microscopy images of hair follicles of NOR and OR patients, unirradiated and at various time intervals post-3Gy irradiation. Green, γ-H2AX; red, propidium iodide (nuclear stain). Magnification, 400×. Inserts in the bottom right corner are enlarged hair follicle cells for a better view of γ-H2AX foci. (B) Kinetics of γ-H2AX foci in hair follicles of NOR (blue bars) and OR (red bars) patients. Zero hr time point shows values for unirradiated hairs. (C) The scatter plot for the ratio of foci number at 3/24 hrs in NOR and OR patients. The average values are 18.5±3.5 and 5.5±2.0 for NOR and OR groups respectively, p=0.0017. (D) ROC curve for the ratio of foci number at 3/24 hr; AUC=0.90±0.06.
3.7. Genetic analysis of DNA repair genes in OR patients
To identify potential germline genetic drivers of the compromized DNA repair, 417 genes involved in DNA repair were sequenced in the 16 OR patients. Given that the rate of intrinsic RS is low, the 1000 normal controls from the LifePool study of comparable average age (58.8 ±9.9 years) were used as a surrogate for non-responders to provide the baseline frequency of loss-of-function (LoF) mutations. Considering only variants that were in genes harboring LoF variants at <1% in the Exome Aggregation Consortium (ExAC) database, we identified 8 mutations in 8 different DNA repair genes distributed amongst 5 OR patients (Table 3). Patients RS11 and RS15 each harbored LoF mutations in two DNA repair genes. The total gene level population frequency of LoF mutations in the 8 genes identified are low, ranging from 1/400 individuals for ATM to less than 3/100,000 for PTEN and ABL1. The difference in the total number of LoF mutations in the 16 OR patients compared to the controls was highly statistically significant (p<0.0001).
Table 3.
Germline loss of function mutations detected in 16 OR patients for 417 genes involved in DNA repair.
| Patient ID | 1 Mutation type | Gene Name | Mutation | 2 Total number LoF and ess mutations in local controls (n=1,001) | 3 Total LoF and ess variants in ExAc (n= up to 60,500) | RS phenotype | γ-H2AX assay status (RS map) |
|---|---|---|---|---|---|---|---|
| RS1 | LoF | HINFP | p.Arg9Ter | 0 | 0.01% | Acute: G3 Mucositis, G2 Dermatitis, G3 Odynophagia Late: G1 Skin, G1 SC, G2 Salivary, G3 Dental |
RS |
| RS5 | ess | CHEK2 | c.-334+1N>A | 0 | 0.52% | Acute: G3 Mucositis, G3 Odynophagia Late: Hearing loss, vestibular nerve dysfunction, xerostomia |
RS |
| ess | XRCC2 | c.39+1N>A | 0 | 0.06% | |||
| RS8 | LoF | PTEN | p.Ala120GlnfsTer14 | 0 | 0.003% | Acute: G3 Skin Late: Breast oedema, cancer recurrence |
RS |
| RS11 | LoF | ABL1 | p.Glu834LysfsTer9 | 0 | 0.003% | Acute: G2-3 Skin Late: Brachial plexopathy, telangiectasia on cord |
RS |
| LoF | ZFYVE26 | p.Leu1249ProfsTer19 | 9 | 0.28% | |||
| RS15 | LoF | AP5Z1 | p.Trp441Ter | 2 | 0.13% | Acute: G3 Mucositis Late: G2-3 stomia, osteoradionecrosis trismus |
RS |
| LoF | ATM | :p.Arg2136Ter | 3 | 0.26% | |||
| Total | 8 | 14 | 4 P =<0.0001 | ||||
LoF, loss of function including frameshift, nonsense, stop gain, stop lost mutation; ess, essential splice site mutation;
Local controls are participants from Lifepool;
The total number of individuals in ExAC for a particular genes varies depending on the sequencing performance;
Fishers exact test (two tailed).
All OR patients with identified mutations (RS1, 5, 8, 11, 15) are well-separated from the NOR group in the RS map (Figure 3A); RS5 (with two essential splice site mutations (ess) in CHEK2 and XRCC2) is the closest to the “normal” zone. All these patients were also defined as RS by the pairwise analysis, based on both Q and R, with an exception of RS5, who however was defined as RS based on the R value (Supplementary Table 2).
4. Discussion
From this retrospective study of OR ex-RT patients who experienced severe late reactions of normal tissues, and control NOR patients, we have developed a modified version of an assay based on the DNA repair response of PBL after ex-vivo irradiation, using the γ-H2AX endpoint. Compared to previous studies, the key modifications are the evaluation of DNA repair by non-linear regression analysis of the experimental data, and the statistical approach used in comparing the OR and NOR datasets. The two suggested descriptors reflect the fraction of the radiation-induced damage that is apparently unrepairable (Q) and the rate of repair (R). The combination of these descriptors allows sensitivity and specificity suitable for a potential clinical test to predict individual RS. The important outcome of this retrospective study is the emergence of the “RS map” algorithm that illustrates the implementation of the combination of two classifiers. We previously introduced a visual representation of RS status to display variations in RS amongst severe combined immunodeficiency (SCID) patients 43.
Parallel studies with hair follicles suggest that PBL is a valid surrogate for RS of at least some other normal tissues. Although DSB repair efficiency can be different in different cell types, i.e, in terminally differentiated vs. stem cells, proliferating vs. non-proliferating cells 41, 48, 49, the use of PBL seems to be a reasonable compromise, given the impracticability of the alternatives. Inclusion of the analysis of hair follicles in larger scale prospective studies is unlikely, because the method is manual and not amenable for automation.
Similarly, although the colocalization endpoint has some potential, at this stage it is logistically too demanding to be considered for a routine assay with a large number of patients. Nevertheless, the results of studies of colocalization of γ-H2AX and 53BP1 foci in irradiated PBL, support the proposal that the RS phenotype is associated with compromised DNA repair. The lower colocalization, reflecting decreased cooperation of DNA repair factors, presumably impacts on the efficiency of processing of DSBs.
For a deeper insight to the connection between RS and compromised DNA repair, we investigated the genotype of our OR patients. While a range of DNA repair genes are known to cause RS, few studies have specifically investigated the prevalence of LoF mutations among individuals in an OR cohort. Using strict criteria for pathogenicity and population prevalence, among the 417 DNA repair genes sequenced, 5 patients harboured likely LoF mutations (HINFP, CHEK2, XRCC2, PTEN, ABL1, ZFYVE26, AP5Z1, ATM).
Do deficiencies in any of these genes have a strong OR effect in the heterozygous state? A good example is ataxia telangiectasia mutated (ATM), where non-null deficiencies have been associated with increased RS and decreased survival50. An altered level of ATM activity correlates with the preservation of neurological function, the impaired DNA DSB repair, genomic instability, cancer predisposition and cellular and clinical RS30, 51-54. ATM deficiencies have implications for RT-related clinical RS; a study of breast cancer OR RT patients found that 33% of the patients had ATM protein levels < 55%, compared to the NOR group55, and in a small study of breast cancer patients the risk of radiation-induced Grade 3 subcutaneous fibrosis was reported to be associated with one particular ATM genetic variant in both the homozygous and heterozygous state12. However, while RT is generally avoided in patients with homozygous genetic mutations in ATM due to the high risk of severe adverse normal tissue toxicity, modifications of treatment protocols for individuals with heterozygous ATM defects have not been yet established. Several studies have evaluated whether individuals heterozygous for LoF mutations in other genes involved in DNA damage response are also had an increased risk of normal tissue complications and reported some interesting candidates, but without a clear consensus in finding associations with RT-related RS 13.
Since the sample numbers in this study are small, it is premature to definitively assign the OR phenotype in these individuals to these genes, but the expected population frequency of LoF mutations is extremely low for several of these genes, suggesting that the cooccurrence of the mutation and an OR phenotype is not a chance finding. Also, it is important to realize that the activities of various cellular pathways, such as those involved in cell survival, death and inflammation vary between patients, These differences provide a heterogeneous background for the impact of genetic defects in DNA repair on RS.
It is interesting to extrapolate from the data obtained in our retrospective study, to a hypothetical prospective scenario. Assuming RS patients constitute 5% of the population, at the threshold providing 100% specificity (i.e. all patients with normal RS are classified as such), from 5 RS patients in a population of 100, one of the 5 would be expected to be classified as normal (due to 87% sensitivity). In this scenario, application of the assay would improve the outcome for 4 of the 5 OR patients. Also, more aggressive therapy could be contemplated for the 95 NOR patients. However, this analysis assumes that the discriminator threshold will not change in the prospective study, which is unlikely. Both the prior RT necessarily associated with the retrospective design, and the much larger proportion of the NOR group to be encountered in a prospective study, may influence the results.
In conclusion, we propose that the modified PBL assay is now suitable for larger prospective studies with RT patients. It is likely that further modifications will evolve, arising from the expanded dataset, and from the elimination of possible confounding factors associated with the retrospective design. The proposed prospective study is the next step in the goal to develop a predictive assay to identify RS individuals before they are scheduled for RT. Looking further ahead, the results of the limited genetic analysis associated with our reported retrospective study suggest the possibility of a predictive assay that combines both functional and genetic components.
Supplementary Material
Highlights.
Every patient responds to radiotherapy in individual manner.
Some suffer severe side-effects because of their intrinsic radiosensitivity.
γ-H2AX assay can detect such patients.
“RS map” allows judging radiosensitivity, based on post-irradiation γ-H2AX kinetics.
Acknowledgments
The study was supported by the Peter MacCallum Cancer Foundation and initially by the Intramural Program at the National Cancer Institute, National Institutes of Health, USA.
Abbreviations
- RT
radiation therapy
- RS
radiosensitivity
- γ-H2AX
phosphorylated histone H2AX
- 53BP1
p53 binding protein 1
- DSB
double-strand break
- PBL
peripheral blood lymphocytes
- OR
over-responders
- NOR
not-over-responders
- PMCC
Peter Maccallum Cancer Centre
- ROC
receiver operating characteristics
- RTOG
Radiation Therapy Oncology Group
- AUC
area under the ROC curve
- FBS
foetal bovine serum
- EDTA
ethylenediaminetetraacetic acid
- PBS
phosphate buffered saline
- N(t)
number of foci at time t
- NM
maximum foci number
- R
repair rate
- Q
fraction of unrepairable component
- LoF
loss of function
- ess
essential splice site mutations
- ExAC
Exome Aggregation Consortium
Footnotes
Publisher's Disclaimer: This is a PDF file of an unedited manuscript that has been accepted for publication. As a service to our customers we are providing this early version of the manuscript. The manuscript will undergo copyediting, typesetting, and review of the resulting proof before it is published in its final citable form. Please note that during the production process errors may be discovered which could affect the content, and all legal disclaimers that apply to the journal pertain.
References
- 1.Fletcher G. Introduction to the Regaud lecture. Radiotherapy & Oncology. 1990;17 [Google Scholar]
- 2.Ho AY, Atencio DP, Peters S, Stock RG, Formenti SC, Cesaretti JA, Green S, Haffty B, Drumea K, Leitzin L, Kuten A, Azria D, Ozsahin M, Overgaard J, Andreassen CN, Trop CS, Park J, Rosenstein BS. Genetic predictors of adverse radiotherapy effects: the Gene-PARE project. Int J Radiat Oncol Biol Phys. 2006;65:646–55. doi: 10.1016/j.ijrobp.2006.03.006. [DOI] [PubMed] [Google Scholar]
- 3.Forrester HB, Li J, Leong T, McKay MJ, Sprung CN. Identification of a radiation sensitivity gene expression profile in primary fibroblasts derived from patients who developed radiotherapy-induced fibrosis. Radiotherapy and oncology : journal of the European Society for Therapeutic Radiology and Oncology. 2014;111:186–93. doi: 10.1016/j.radonc.2014.03.007. [DOI] [PubMed] [Google Scholar]
- 4.Barnett GC, West CM, Dunning AM, Elliott RM, Coles CE, Pharoah PD, Burnet NG. Normal tissue reactions to radiotherapy: towards tailoring treatment dose by genotype. Nature reviews Cancer. 2009;9:134–42. doi: 10.1038/nrc2587. [DOI] [PMC free article] [PubMed] [Google Scholar]
- 5.Andreassen CN, Alsner J, Overgaard J. Does variability in normal tissue reactions after radiotherapy have a genetic basis--where and how to look for it? Radiother Oncol. 2002;64:131–40. doi: 10.1016/s0167-8140(02)00154-8. [DOI] [PubMed] [Google Scholar]
- 6.Gatti RA. The inherited basis of human radiosensitivity. Acta Oncol. 2001;40:702–11. doi: 10.1080/02841860152619115. [DOI] [PubMed] [Google Scholar]
- 7.Fachal L, Gomez-Caamano A, Barnett GC, Peleteiro P, Carballo AM, Calvo-Crespo P, Kerns SL, Sanchez-Garcia M, Lobato-Busto R, Dorling L, Elliott RM, Dearnaley DP, Sydes MR, Hall E, Burnet NG, Carracedo A, Rosenstein BS, West CM, Dunning AM, Vega A. A three-stage genome-wide association study identifies a susceptibility locus for late radiotherapy toxicity at 2q24.1. Nature genetics. 2014 doi: 10.1038/ng.3020. [DOI] [PubMed] [Google Scholar]
- 8.Barnett GC, Thompson D, Fachal L, Kerns S, Talbot C, Elliott RM, Dorling L, Coles CE, Dearnaley DP, Rosenstein BS, Vega A, Symonds P, Yarnold J, Baynes C, Michailidou K, Dennis J, Tyrer JP, Wilkinson JS, Gomez-Caamano A, Tanteles GA, Platte R, Mayes R, Conroy D, Maranian M, Luccarini C, Gulliford SL, Sydes MR, Hall E, Haviland J, Misra V, Titley J, Bentzen SM, Pharoah PD, Burnet NG, Dunning AM, West CM. A genome wide association study (GWAS) providing evidence of an association between common genetic variants and late radiotherapy toxicity. Radiotherapy and oncology : journal of the European Society for Therapeutic Radiology and Oncology. 2014;111:178–85. doi: 10.1016/j.radonc.2014.02.012. [DOI] [PubMed] [Google Scholar]
- 9.Pavlopoulou A, Oktay Y, Vougas K, Louka M, Vorgias CE, Georgakilas AG. Determinants of resistance to chemotherapy and ionizing radiation in breast cancer stem cells. Cancer letters. 2016;380:485–93. doi: 10.1016/j.canlet.2016.07.018. [DOI] [PubMed] [Google Scholar]
- 10.Chua ML, Rothkamm K. Biomarkers of radiation exposure: can they predict normal tissue radiosensitivity? Clin Oncol (R Coll Radiol) 2013;25:610–6. doi: 10.1016/j.clon.2013.06.010. [DOI] [PubMed] [Google Scholar]
- 11.Nikitaki Z, Hellweg CE, Georgakilas AG, Ravanat JL. Stress-induced DNA damage biomarkers: applications and limitations. Frontiers in chemistry. 2015;3:35. doi: 10.3389/fchem.2015.00035. [DOI] [PMC free article] [PubMed] [Google Scholar]
- 12.Andreassen CN, Overgaard J, Alsner J, Overgaard M, Herskind C, Cesaretti JA, Atencio DP, Green S, Formenti SC, Stock RG, Rosenstein BS. ATM sequence variants and risk of radiation-induced subcutaneous fibrosis after postmastectomy radiotherapy. International journal of radiation oncology, biology, physics. 2006;64:776–83. doi: 10.1016/j.ijrobp.2005.09.014. [DOI] [PubMed] [Google Scholar]
- 13.Andreassen CN, Alsner J. Genetic variants and normal tissue toxicity after radiotherapy: a systematic review. Radiotherapy and oncology : journal of the European Society for Therapeutic Radiology and Oncology. 2009;92:299–309. doi: 10.1016/j.radonc.2009.06.015. [DOI] [PubMed] [Google Scholar]
- 14.Goodarzi AA, Jeggo PA. Irradiation induced foci (IRIF) as a biomarker for radiosensitivity. Mutation research. 2012;736:39–47. doi: 10.1016/j.mrfmmm.2011.05.017. [DOI] [PubMed] [Google Scholar]
- 15.Bonner WM, Redon CE, Dickey JS, Nakamura AJ, Sedelnikova OA, Solier S, Pommier Y. gammaH2AX and cancer. Nature reviews Cancer. 2008;8:957–67. doi: 10.1038/nrc2523. [DOI] [PMC free article] [PubMed] [Google Scholar]
- 16.Ivashkevich A, Redon CE, Nakamura AJ, Martin RF, Martin OA. Use of the gamma-H2AX assay to monitor DNA damage and repair in translational cancer research. Cancer letters. 2012;327:123–33. doi: 10.1016/j.canlet.2011.12.025. [DOI] [PMC free article] [PubMed] [Google Scholar]
- 17.Hutchinson L. Radiotherapy: DNA repair--a marker of late toxicity. Nature reviews Clinical oncology. 2014;11:121. doi: 10.1038/nrclinonc.2014.7. [DOI] [PubMed] [Google Scholar]
- 18.Bourton EC, Plowman PN, Smith D, Arlett CF, Parris CN. Prolonged expression of the gamma-H2AX DNA repair biomarker correlates with excess acute and chronic toxicity from radiotherapy treatment. International journal of cancer Journal international du cancer. 2011 doi: 10.1002/ijc.25953. [DOI] [PMC free article] [PubMed] [Google Scholar]
- 19.Brzozowska K, Pinkawa M, Eble MJ, Muller WU, Wojcik A, Kriehuber R, Schmitz S. In vivo versus in vitro individual radiosensitivity analysed in healthy donors and in prostate cancer patients with and without severe side effects after radiotherapy. International journal of radiation biology. 2012;88:405–13. doi: 10.3109/09553002.2012.666002. [DOI] [PubMed] [Google Scholar]
- 20.Chua ML, Somaiah N, A'Hern R, Davies S, Gothard L, Yarnold J, Rothkamm K. Residual DNA and chromosomal damage in ex vivo irradiated blood lymphocytes correlated with late normal tissue response to breast radiotherapy. Radiotherapy and oncology : journal of the European Society for Therapeutic Radiology and Oncology. 2011;99:362–6. doi: 10.1016/j.radonc.2011.05.071. [DOI] [PubMed] [Google Scholar]
- 21.Chua ML, Horn S, Somaiah N, Davies S, Gothard L, A'Hern R, Yarnold J, Rothkamm K. DNA double-strand break repair and induction of apoptosis in ex vivo irradiated blood lymphocytes in relation to late normal tissue reactions following breast radiotherapy. Radiation and environmental biophysics. 2014;53:355–64. doi: 10.1007/s00411-014-0531-z. [DOI] [PubMed] [Google Scholar]
- 22.Djuzenova CS, Elsner I, Katzer A, Worschech E, Distel LV, Flentje M, Polat B. Radiosensitivity in breast cancer assessed by the histone gamma-H2AX and 53BP1 foci. Radiat Oncol. 2013;8:98. doi: 10.1186/1748-717X-8-98. [DOI] [PMC free article] [PubMed] [Google Scholar]
- 23.Finnon P, Kabacik S, MacKay A, Raffy C, A'Hern R, Owen R, Badie C, Yarnold J, Bouffler S. Correlation of in vitro lymphocyte radiosensitivity and gene expression with late normal tissue reactions following curative radiotherapy for breast cancer. Radiotherapy and oncology : journal of the European Society for Therapeutic Radiology and Oncology. 2012;105:329–36. doi: 10.1016/j.radonc.2012.10.007. [DOI] [PubMed] [Google Scholar]
- 24.Fleckenstein J, Kuhne M, Seegmuller K, Derschang S, Melchior P, Graber S, Fricke A, Rube CE, Rube C. The impact of individual in vivo repair of DNA double-strand breaks on oral mucositis in adjuvant radiotherapy of head-and-neck cancer. International journal of radiation oncology, biology, physics. 2011;81:1465–72. doi: 10.1016/j.ijrobp.2010.08.004. [DOI] [PubMed] [Google Scholar]
- 25.Goutham HV, Mumbrekar KD, Vadhiraja BM, Fernandes DJ, Sharan K, Kanive Parashiva G, Kapaettu S, Bola Sadashiva SR. DNA double-strand break analysis by gamma-H2AX foci: a useful method for determining the overreactors to radiation-induced acute reactions among head-and-neck cancer patients. International journal of radiation oncology, biology, physics. 2012;84:e607–12. doi: 10.1016/j.ijrobp.2012.06.041. [DOI] [PubMed] [Google Scholar]
- 26.Greve B, Bolling T, Amler S, Rossler U, Gomolka M, Mayer C, Popanda O, Dreffke K, Rickinger A, Fritz E, Eckardt-Schupp F, Sauerland C, Braselmann H, Sauter W, Illig T, Riesenbeck D, Konemann S, Willich N, Mortl S, Eich HT, Schmezer P. Evaluation of different biomarkers to predict individual radiosensitivity in an inter-laboratory comparison--lessons for future studies. PloS one. 2012;7:e47185. doi: 10.1371/journal.pone.0047185. [DOI] [PMC free article] [PubMed] [Google Scholar]
- 27.Li P, Du CR, Xu WC, Shi ZL, Zhang Q, Li ZB, Fu S. Correlation of dynamic changes in gamma-H2AX expression in peripheral blood lymphocytes from head and neck cancer patients with radiation-induced oral mucositis. Radiat Oncol. 2013;8:155. doi: 10.1186/1748-717X-8-155. [DOI] [PMC free article] [PubMed] [Google Scholar]
- 28.Martin NT, Nahas SA, Tunuguntla R, Fike F, Gatti RA. Assessing ‘radiosensitivity’ with kinetic profiles of gamma-H2AX, 53BP1 and BRCA1 foci. Radiotherapy and oncology : journal of the European Society for Therapeutic Radiology and Oncology. 2011;101:35–8. doi: 10.1016/j.radonc.2011.05.065. [DOI] [PMC free article] [PubMed] [Google Scholar]
- 29.Mumbrekar KD, Fernandes DJ, Goutham HV, Sharan K, Vadhiraja BM, Satyamoorthy K, Bola Sadashiva SR. Influence of double-strand break repair on radiation therapy-induced acute skin reactions in breast cancer patients. International journal of radiation oncology, biology, physics. 2014;88:671–6. doi: 10.1016/j.ijrobp.2013.11.218. [DOI] [PubMed] [Google Scholar]
- 30.Rube CE, Fricke A, Schneider R, Simon K, Kuhne M, Fleckenstein J, Graber S, Graf N, Rube C. DNA repair alterations in children with pediatric malignancies: novel opportunities to identify patients at risk for high-grade toxicities. International journal of radiation oncology, biology, physics. 2010;78:359–69. doi: 10.1016/j.ijrobp.2009.08.052. [DOI] [PubMed] [Google Scholar]
- 31.Schuler N, Palm J, Kaiser M, Betten D, Furtwangler R, Rube C, Graf N, Rube CE. DNA-damage foci to detect and characterize DNA repair alterations in children treated for pediatric malignancies. PloS one. 2014;9:e91319. doi: 10.1371/journal.pone.0091319. [DOI] [PMC free article] [PubMed] [Google Scholar]
- 32.van Oorschot B, Hovingh SE, Moerland PD, Medema JP, Stalpers LJ, Vrieling H, Franken NA. Reduced activity of double-strand break repair genes in prostate cancer patients with late normal tissue radiation toxicity. International journal of radiation oncology, biology, physics. 2014;88:664–70. doi: 10.1016/j.ijrobp.2013.11.219. [DOI] [PubMed] [Google Scholar]
- 33.Vasireddy RS, Sprung CN, Cempaka NL, Chao M, McKay MJ. H2AX phosphorylation screen of cells from radiosensitive cancer patients reveals a novel DNA double-strand break repair cellular phenotype. British journal of cancer. 2010;102:1511–8. doi: 10.1038/sj.bjc.6605666. [DOI] [PMC free article] [PubMed] [Google Scholar]
- 34.Werbrouck J, De Ruyck K, Beels L, Vral A, Van Eijkeren M, De Neve W, Thierens H. Prediction of late normal tissue complications in RT treated gynaecological cancer patients: potential of the gamma-H2AX foci assay and association with chromosomal radiosensitivity. Oncology reports. 2010;23:571–8. [PubMed] [Google Scholar]
- 35.Werbrouck J, Duprez F, De Neve W, Thierens H. Lack of a correlation between gammaH2AX foci kinetics in lymphocytes and the severity of acute normal tissue reactions during IMRT treatment for head and neck cancer. International journal of radiation biology. 2011;87:46–56. doi: 10.3109/09553002.2010.518213. [DOI] [PubMed] [Google Scholar]
- 36.Olive PL, Banath JP, Keyes M. Residual gammaH2AX after irradiation of human lymphocytes and monocytes in vitro and its relation to late effects after prostate brachytherapy. Radiotherapy and oncology : journal of the European Society for Therapeutic Radiology and Oncology. 2008;86:336–46. doi: 10.1016/j.radonc.2007.09.002. [DOI] [PubMed] [Google Scholar]
- 37.Markova E, Somsedikova A, Vasilyev S, Pobijakova M, Lackova A, Lukacko P, Belyaev I. DNA repair foci and late apoptosis/necrosis in peripheral blood lymphocytes of breast cancer patients undergoing radiotherapy. Int J Radiat Biol. 2015:1–12. doi: 10.3109/09553002.2015.1101498. [DOI] [PubMed] [Google Scholar]
- 38.van Oorschot B, Hovingh S, Dekker A, Stalpers LJ, Franken NA. Radiation research. 2016. Predicting Radiosensitivity with Gamma-H2AX Foci Assay after Single High-Dose-Rate and Pulsed Dose-Rate Ionizing Irradiation. [DOI] [PubMed] [Google Scholar]
- 39.Adams G, Martin OA, Roos DE, Lobachevsky PN, Potter AE, Zacest AC, Bezak E, Bonner WM, Martin RF, Leong T. Enhanced intrinsic radiosensitivity after treatment with stereotactic radiosurgery for an acoustic neuroma. Radiotherapy and oncology : journal of the European Society for Therapeutic Radiology and Oncology. 2012;103:410–4. doi: 10.1016/j.radonc.2012.03.011. [DOI] [PMC free article] [PubMed] [Google Scholar]
- 40.Ivashkevich AN, Martin OA, Smith AJ, Redon CE, Bonner WM, Martin RF, Lobachevsky PN. gammaH2AX foci as a measure of DNA damage: a computational approach to automatic analysis. Mutat Res. 2011;711:49–60. doi: 10.1016/j.mrfmmm.2010.12.015. [DOI] [PMC free article] [PubMed] [Google Scholar]
- 41.Martin OA, Ivashkevich A, Choo S, Woodbine L, Jeggo PA, Martin RF, Lobachevsky P. Statistical analysis of kinetics, distribution and co-localisation of DNA repair foci in irradiated cells: cell cycle effect and implications for prediction of radiosensitivity. DNA repair. 2013;12:844–55. doi: 10.1016/j.dnarep.2013.07.002. [DOI] [PubMed] [Google Scholar]
- 42.Zweig MH, Campbell G. Receiver-operating characteristic (ROC) plots: a fundamental evaluation tool in clinical medicine. Clinical chemistry. 1993;39:561–77. [PubMed] [Google Scholar]
- 43.Lobachevsky P, Woodbine L, Hsiao KC, Choo S, Fraser C, Gray P, Smith J, Best N, Munforte L, Korneeva E, Martin RF, Jeggo PA, Martin OA. Evaluation of Severe Combined Immunodeficiency and Combined Immunodeficiency Pediatric Patients on the Basis of Cellular Radiosensitivity. The Journal of molecular diagnostics : JMD. 2015 doi: 10.1016/j.jmoldx.2015.05.004. [DOI] [PMC free article] [PubMed] [Google Scholar]
- 44.Sedelnikova OA, Horikawa I, Redon C, Nakamura A, Zimonjic DB, Popescu NC, Bonner WM. Delayed kinetics of DNA double-strand break processing in normal and pathological aging. Aging Cell. 2008;7:89–100. doi: 10.1111/j.1474-9726.2007.00354.x. [DOI] [PubMed] [Google Scholar]
- 45.Paull TT, Rogakou EP, Yamazaki V, Kirchgessner CU, Gellert M, Bonner WM. A critical role for histone H2AX in recruitment of repair factors to nuclear foci after DNA damage. Curr Biol. 2000;10:886–95. doi: 10.1016/s0960-9822(00)00610-2. [DOI] [PubMed] [Google Scholar]
- 46.Celeste A, Fernandez-Capetillo O, Kruhlak MJ, Pilch DR, Staudt DW, Lee A, Bonner RF, Bonner WM, Nussenzweig A. Histone H2AX phosphorylation is dispensable for the initial recognition of DNA breaks. Nature cell biology. 2003;5:675–9. doi: 10.1038/ncb1004. [DOI] [PubMed] [Google Scholar]
- 47.Tobias F, Lob D, Lengert N, Durante M, Drossel B, Taucher-Scholz G, Jakob B. Spatiotemporal dynamics of early DNA damage response proteins on complex DNA lesions. PloS one. 2013;8:e57953. doi: 10.1371/journal.pone.0057953. [DOI] [PMC free article] [PubMed] [Google Scholar]
- 48.Schneider L, Fumagalli M, d'Adda di Fagagna F. Terminally differentiated astrocytes lack DNA damage response signaling and are radioresistant but retain DNA repair proficiency. Cell death and differentiation. 2012;19:582–91. doi: 10.1038/cdd.2011.129. [DOI] [PMC free article] [PubMed] [Google Scholar]
- 49.Dickey JS, Baird BJ, Redon CE, Avdoshina V, Palchik G, Wu J, Kondratyev A, Bonner WM, Martin OA. Susceptibility to bystander DNA damage is influenced by replication and transcriptional activity. Nucleic acids research. 2012;40:10274–86. doi: 10.1093/nar/gks795. [DOI] [PMC free article] [PubMed] [Google Scholar]
- 50.Barlow C, Eckhaus MA, Schaffer AA, Wynshaw-Boris A. Atm haploinsufficiency results in increased sensitivity to sublethal doses of ionizing radiation in mice. Nature genetics. 1999;21:359–60. doi: 10.1038/7684. [DOI] [PubMed] [Google Scholar]
- 51.Taylor AM, Byrd PJ. Molecular pathology of ataxia telangiectasia. Journal of clinical pathology. 2005;58:1009–15. doi: 10.1136/jcp.2005.026062. [DOI] [PMC free article] [PubMed] [Google Scholar]
- 52.Lobrich M, Jeggo PA. The two edges of the ATM sword: co-operation between repair and checkpoint functions. Radiotherapy and oncology : journal of the European Society for Therapeutic Radiology and Oncology. 2005;76:112–8. doi: 10.1016/j.radonc.2005.06.027. [DOI] [PubMed] [Google Scholar]
- 53.O'Driscoll M, Jeggo PA. The role of the DNA damage response pathways in brain development and microcephaly: insight from human disorders. DNA repair. 2008;7:1039–50. doi: 10.1016/j.dnarep.2008.03.018. [DOI] [PubMed] [Google Scholar]
- 54.Swift M, Morrell D, Massey RB, Chase CL. Incidence of cancer in 161 families affected by ataxia-telangiectasia. The New England journal of medicine. 1991;325:1831–6. doi: 10.1056/NEJM199112263252602. [DOI] [PubMed] [Google Scholar]
- 55.Fang Z, Kozlov S, McKay MJ, Woods R, Birrell G, Sprung CN, Murrell DF, Wangoo K, Teng L, Kearsley JH, Lavin MF, Graham PH, Clarke RA. Low levels of ATM in breast cancer patients with clinical radiosensitivity. Genome integrity. 2010;1:9. doi: 10.1186/2041-9414-1-9. [DOI] [PMC free article] [PubMed] [Google Scholar]
Associated Data
This section collects any data citations, data availability statements, or supplementary materials included in this article.