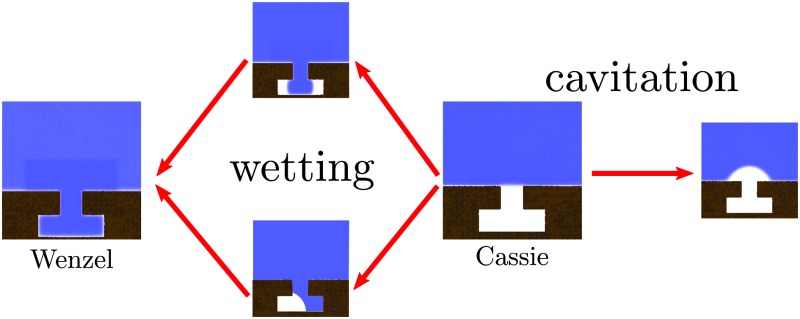
 Rare event methods combined with molecular dynamics and macroscopic calculations reveal multiple pathways for the breakdown of the superhydrophobic Cassie state through wetting or cavitation.
Abstract
In this contribution we study the wetting and nucleation of vapor bubbles on nanodecorated surfaces via free energy molecular dynamics simulations. The results shed light on the stability of superhydrophobicity in submerged surfaces with nanoscale corrugations. The re-entrant geometry of the cavities under investigation is capable of sustaining a confined vapor phase within the surface roughness (Cassie state) both for hydrophobic and hydrophilic combinations of liquid and solid. The atomistic system is of nanometric size; on this scale thermally activated events can play an important role ultimately determining the lifetime of the Cassie state. Such a superhydrophobic state can break down by full wetting of the texture at large pressures (Cassie–Wenzel transition) or by nucleating a vapor bubble at negative pressures (cavitation). Specialized rare event techniques show that several pathways for wetting and cavitation are possible, due to the complex surface geometry. The related free energy barriers are of the order of 100k B T and vary with pressure. The atomistic results are found to be in semi-quantitative accord with macroscopic capillarity theory. However, the latter is not capable of capturing the density fluctuations, which determine the destabilization of the confined liquid phase at negative pressures (liquid spinodal).
1. Introduction
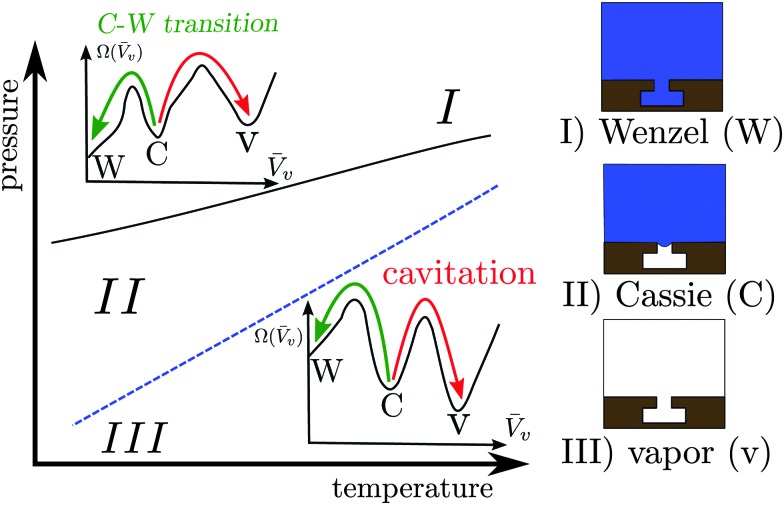
Confined fluids exhibit distinctive properties, which may significantly depart from their bulk counterparts. A class of properties of notable technological relevance is superhydrophobicity, which proceeds from the shifted liquid–vapor coexistence induced by confinement within surface roughness (Fig. 1). Surfaces in the superhydrophobic state are self-cleaning, ultra liquid repellent, and may help in reducing drag.1–4
Fig. 1. Sketch of the phase diagram for the Cassie, Wenzel, and vapor states. Typical free-energy profiles (with the same notation as in the main text below) are shown in the region where the Wenzel state (I) and the vapor state (III) are thermodynamically stable, respectively. The Cassie state is thermodynamically stable in the intermediate region (II). The blue dashed line represents two-phase coexistence for the bulk liquid and vapor phases along which P l(T) – P v(T) ≡ ΔP(T) = 0. The black solid line is the coexistence curve for the Cassie and Wenzel states. The coexistence of the Cassie and vapor states coincides with the bulk two-phase coexistence line at ΔP = 0. The arrows indicate the Cassie–Wenzel transition (green) and cavitation (red) through which superhydrophobicity is lost.
However, the confined gaseous bubbles, which constitute the so-called Cassie state, may break down via two main mechanisms5 illustrated in Fig. 1: intrusion of the liquid into the surface roughness, giving rise to the so-called Wenzel state (Cassie–Wenzel transition), or formation of a critical vapor cavity (cavitation) and its subsequent dispersion in the liquid bulk. It is therefore of paramount importance for technological applications to determine quantitatively the stability of the superhydrophobic Cassie state and the kinetics of vapor loss.
A common strategy to stabilize the superhydrophobic state consists of decreasing the characteristic size of surface roughness in order to increase the capillary forces which can counteract the liquid pressure. Present-day technologies6 are capable of producing regular nanopatterns on arbitrarily large areas, which have been exploited in the study of superhydrophobicity in nanoconfinement.7 This “shrinking” strategy is also exploited in hierarchical surfaces, which combine a nanostructure for enhancing the bubble stability and a microstructure for increasing the entrapped bubble volume.8 In principle, it would be convenient to push the miniaturization down to scales at which the macroscopic models of capillarity show their limits.5 This technological challenge however calls for a more fundamental understanding of superhydrophobicity at the nanoscale. In order to address these open issues, here we use full-atom simulations and compare the results with macroscopic capillarity theory.
The Cassie–Wenzel transition and cavitation through which superhydrophobicity breaks down are, for most of the phase diagram illustrated in Fig. 1, first order transitions, in which the stable and metastable states are separated by free-energy barriers. On the nanoscale, such barriers can be overcome by thermal fluctuations, with the typical exponential dependence of the average time between transitions on the free energy barrier9 (see eqn (1) below). For barriers larger than the thermal energy k B T, this time becomes very long, giving rise to rapid but very infrequent transitions, the so-called rare events. Rare events are challenging both from the experimental and from the simulative point of view, because they require sampling of two very different timescales. In the present theoretical work, dedicated atomistic simulation techniques – the restrained molecular dynamics (RMD)10 – and continuum methods – the continuum rare events method (CREaM)11 – are adopted in order to tackle rare events.
The aim of the present work is therefore to investigate the Cassie–Wenzel transition and cavitation on a nanodecorated surface. The re-entrant structure with a typical size of 5 nm and the two surface chemistries here considered – hydrophilic and hydrophobic – are similar to those already explored in a recent communication.5 Such re-entrant geometries are exploited in order to realize the Cassie state even with liquids having low surface tension (omniphobicity).12–15 Microscopic insights into the phenomena are given by free-energy molecular dynamics simulations, which resolve the atomistic structure of the fluids and of the solid. The validity of the macroscopic capillarity theory – in which the liquid–vapor interface is sharp – is assessed against them. We find that the two descriptions yield surprisingly similar results; however, qualitative differences emerge close to the Wenzel state due to the inherent compressibility of the atomistic model. Multiple transition pathways are possible for the breakdown of superhydrophobicity each characterized by different kinetics; the number of possible pathways increases for hydrophilic surfaces. Furthermore quantitative differences in the free energy barriers are observed far from two-phase coexistence.
This paper is organized as follows. In the first section the continuum rare event method and restrained molecular dynamics are briefly reviewed. In the second section the results are discussed while the last section is left for conclusions.
2. Models and methods
2.1. The problem of rare events
When a physical system is characterized by more than one (meta)stable configuration, e.g., the Wenzel, Cassie, and vapor states in Fig. 1, thermal fluctuations can drive the system between any two states. When the transition occurs on a short timescale as compared to the waiting time before the next thermally activated transition, we refer to this as a rare event.16 The minima of the system free energy (indicated in the following with Ω, see eqn (2) below) correspond to the thermodynamically stable configuration of the system (absolute minimum), or to the other metastable states (local minima). The transition pathway is defined as the collection of intermediate system configurations visited during the transition between two states. As will be shown in the following, two states can be connected by different transition pathways, each characterized by a free-energy barrier ΔΩ †, given by the free energy difference between the free-energy minimum from which the transition starts and the maximum along the pathway (transition state). The average time τ needed for overcoming the free-energy barrier and thus accomplishing a transition is given by:9
| τ ∼ exp(βΔΩ†), | 1 |
where β = 1/(k B T) is the inverse of the thermal energy with T being the temperature of the system and k B being the Boltzmann constant. Thus if the thermal energy k B T available to the system is less than the free-energy barriers k B T < ΔΩ †, the transition occurs on a long timescale (rare). The barriers can be computed from the maximum of the free energy along a given transition pathway.
The free energy of a system can be expressed as a functional of some relevant quantity; e.g., in density functional theory it is the density ρ(x) of the system in the ordinary space x for which Ω ≡ Ω[ρ(x)]. In such a complex and high dimensional free-energy landscape computing the transition pathways and the related free-energy barriers is a daunting task. To alleviate this issue a reduced set of variables is often employed in order to characterize the transition. The number and the particular expression of these variables are dictated by the physics of the problem under investigation. In this work we assume that the free energy depends on a single variable, related to the filling of the cavity, see Fig. 2. For the atomistic case, this variable is usually referred to as a collective variable (CV), reflecting the fact that the atomistic degrees of freedom are mapped into a single macroscopic observable. In Section 2.4 we present a model potential to illustrate the approximations introduced by describing the system via a single variable.
Fig. 2. (a) Sketch of the system used in CREaM calculations; the liquid phase is in blue, the vapor phase in white. The contact angle θ, the radius of curvature R ≡ R 1 (in 2D, R 2 = ∞), the corner angle φ, and the angle β used in the main text are defined in the inset. (b) Atomistic system used in RMD simulations; the fluid particles are in blue while the solid particles are in brown. The yellow box corresponds to the control region used in the definition of the collective variable N cav (see Section 2.3).
2.2. Continuum model and the CREaM
Our capillary system is described via a sharp interface model, which assumes that the properties of the liquid and vapor phases are constant and equal to the bulk values up to the liquid–vapor interface, where there is a sharp change in the properties. The solid is fixed and forms a T-shaped cavity, see Fig. 2. Using the macroscopic capillarity theory, the thermodynamics of this three-phase system can be described using the grand potential Ω̃, which depends on the chemical potential μ, on the total volume V, and on the temperature T:
| Ω̃(μ, V, T) = –Pl Vl – Pv Vv + γlvAlv + γsv Asv + γsl Asl, | 2 |
where P l and P v are the pressures of the liquid and vapor phases, respectively, V l and V v their volume, γ is the surface tension of the corresponding liquid–vapor (lv), solid–liquid (sl) and solid–vapor (sv) interfaces, and A their area. The total volume of the system available to the liquid and to the vapor phases, V = V l + V v, is fixed. Also the total area of the solid surface A s = A sv + A sl is constant. These two constraints allow one to express the grand potential parametrically in terms of the variables V v, A lv and A sv:
| Ω(μ, V, T) ≡ Ω̃ – Ωref = ΔP Vv + γlv (Alv + Asv cos θY), | 3 |
where Ω is the excess grand potential, Ω ref = P l V + γ sl A s is the reference grand potential computed in the Wenzel state, ΔP ≡ P l – P v, and θ Y is the Young angle defined as: cos θ Y ≡ (γ sv – γ sl)/γ lv.
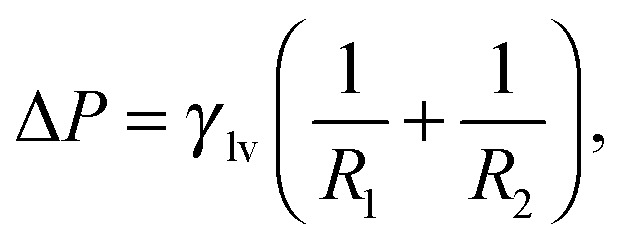
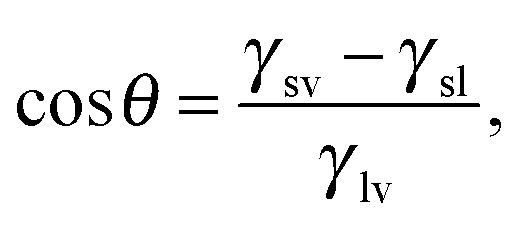
By minimizing the grand potential functional in eqn (3) w.r.t. V v, A lv, and A sv, one finds the (meta)stable configurations of the system. The conditions for stationarity are:
 |
4a |
 |
4b |
where R 1 and R 2 are the principal radii of curvature of the liquid–vapor interface, taken to be positive if lying in the liquid domain and negative otherwise, and θ is the contact angle (see Fig. 2). Eqn (4a) and (4b) are the Laplace and Young equations, respectively. Eqn (4b) holds at the liquid–vapor–solid contact line where the solid surface is smooth. At the corners of the T-shaped cavity, the normal to the solid surface jumps discontinuously. There the Young boundary condition is replaced by the Gibbs criterion,17 which requires that all the possible contact angles should be in the range θ Y + φ – π < β < θ Y (grey area in the inset of Fig. 2) where θ Y + φ – π and θ Y are the Young contact angles on the horizontal and vertical surfaces, respectively. Similarly, at the inner corners θ Y < β < θ Y + π – φ (see Fig. 2 for the definition of β and φ).
The solutions of the Laplace equation with Young or Gibbs boundary conditions correspond to the stationary points of the functional in eqn (3), which can be minima (stable or metastable states, e.g., Cassie or Wenzel), maxima, or saddle points (transition states, e.g., a critical vapor bubble nucleating from the surface). However, this procedure gives no information about the actual transition pathway(s) between two metastable states. In turn, the transition pathway selects the free-energy barrier which is relevant for determining the kinetics of the transition viaeqn (1).
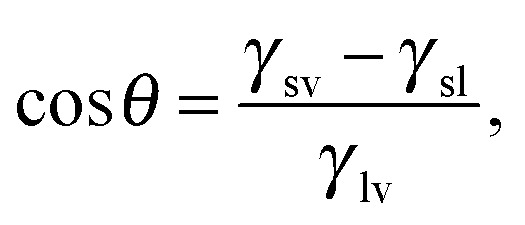
The Continuum Rare Events Method (CREaM) has been introduced to investigate the states beside the metastable ones and to construct the transition pathways for the wetting or cavitation on arbitrary geometries. The details of this formulation are discussed in ref. 11 and 18 and here only briefly recapitulated. The basic idea consists of finding the constrained stationary points of eqn (3) under the condition of a fixed volume of vapor V v, which is the progress variable used for the description of the Cassie–Wenzel transition and cavitation. This procedure is carried out using the method of the Lagrange multipliers. The constrained grand potential is defined as I = Ω – λ(V v – V v), where λ is the Lagrange multiplier and V v is the chosen value for the volume of vapor. Imposing the stationarity of the constrained functional I yields:11
 |
5a |
 |
5b |
| Vv = Vv, | 5c |
where eqn (5a) is a modified Laplace equation in which the Lagrange multiplier λ plays the role of an extra pressure term forcing the system to explore states beyond the metastable ones. Eqn (5b) is the usual Young boundary condition and eqn (5c) enforces the volume constraint. Eqn (5) can be solved numerically; here this task is performed using the Surface Evolver.19 Fixing the value of V v and the appropriate boundary conditions (eqn (5b) or the Gibbs criterion where needed) Surface Evolver allows one to find the vapor configuration corresponding to a minimum of eqn (3) under the fixed volume constraint. From the triplet (V v, A lv, A sv) computed by the Surface Evolver it is then possible to evaluate the free energy of the minimal configuration viaeqn (3) (see the ESI† for details). While eqn (5) in principle describes all the stationary constrained states, the saddle points are not easy to detect via standard numerical methods involving minimization, see, e.g., ref. 20. In practice only minima are accessible. At a fixed V v multiple minima can be found, which correspond to different configurations of the interfaces enclosing the same volume. Repeating the numerical minimization procedure for various V v between the Wenzel state (V v = 0) and large vapor volumes, which are relevant to the cavitation regime, we are able to find the collection of the constrained free-energy minima. This information is used to construct (pieces of) possible transition pathways between metastable states, which are characterized in terms of the free-energy profile Ω(μ,V,T;V v).
2.3. Atomistic model and RMD
The atomistic model used in molecular dynamics (MD) simulations consists of a Lennard-Jones (LJ) fluid, defined by the pair interaction potential V LJ(r) = 4ε[(σ/r)12 – (σ/r)6], where ε and σ are the LJ energy and length scales, respectively, and r is the inter atomic distance between two fluid particles. The solid walls (Fig. 2b) are also made of LJ atoms; the lower wall is characterized by a T-shaped nanocavity (Fig. 2). Solid and fluid atoms interact via a modified version of the LJ potential: V(r) = 4ε[(σ/r)12 – c(σ/r)6]. The coefficient c multiplying the repulsive part of V(r) is used to tune the chemistry of the surface. The two LJ potentials completely define the interactions used in the atomistic system. The results coming from the MD simulations can be expressed in reduced units,21 for example the reduced distance is defined as r* = r/σ, the reduced pressure as P* = Pσ 3/ε and the reduced temperature as T* = k B T/ε. From now on the superscript *, denoting dimensionless quantities, will be omitted. Two surface chemistries are considered in this work: a hydrophobic one (c = 0.6) with a Young contact angle θ Y = 110° and a hydrophilic one (c = 0.8) with θ Y = 55°. Further details on the choice of the coefficient c and on the calculation of the contact angle are found in ref. 5.
The atoms of the lower solid wall are kept fixed at their initial positions forming an fcc lattice. The upper solid wall, instead, is used as a piston to control the pressure P l of the liquid phase. This is achieved by applying to each particle belonging to the upper wall a constant force in the y direction (for details see ref. 22 and the ESI†). A velocity Verlet scheme is used for the time evolution of the upper solid wall. The temperature of the liquid is kept fixed at T = 0.8 via the Nosé–Hoover chain thermostat.23 The liquid temperature T, together with the liquid pressure P l, sets the thermodynamic conditions of the system. The cavity dimensions are specified in Fig. 2, with the characteristic length being w ≃ 13. The system extends for 7σ in the z direction. Periodic boundary conditions are applied in the x and z directions. The position of the upper wall fluctuates along the y direction to enforce the required pressure, implying that the height of the computational box changes in time. In the simulation campaign we explore a range of positive and negative liquid pressures, in the interval –0.08 ≤ P l ≤ 0.16.
As anticipated before, the occurrence of rare events implies that MD trajectories are trapped in the high probability regions of the phase space, the metastable states, and transitions between these regions are infrequent as compared to the timescale accessible to MD simulations.24 A convenient description of the system is given in terms of the collective variables φ i(r), which depend on the microscopic state of the system r = {r 1,…,r N}. For the system in Fig. 2b the simplest choice is a single collective variable counting the number of particles inside the T-shaped nanocavity (yellow rectangle).25 This is a natural choice which can be directly related to the volume V v of the vapor domain employed in the continuum approach in Section 2.2. Relevant information about the process can be extracted by computing the probability that the observable φ(r) assumes a given value N cav, p(P l,T;φ(r) = N cav), which depends also on the thermodynamic conditions P l and T. From p(P l,T;N cav) (where the dependence on φ(r) is omitted) we define the Landau free energy:
| Ω(Pl, T ; Ncav) = –kBT ln p(Pl, T ; Ncav). | 6 |
The above microscopic expression for the free energy can be compared with the macroscopic grand potential profile Ω(μ,V,T;N cav) found via the CREaM (see below).
Here Ω(P l,T;N cav) is computed via the restrained MD method10 (RMD), which amounts to adding a biasing potential of the form V bias(r) = k(φ(r) – N cav)2/2 to the physical one. This harmonic-like potential, for suitable values of the spring constant k, restrains the system close to φ(r) = N cav, forcing it to explore also regions of the phase space with low probability which are otherwise unaccessible to brute force simulations. Further details are found in reviews on rare event methods;16,26 in brief, via RMD it is possible to evaluate the gradient of Ω(P l,T;N cav) according to:
 |
7 |
where …bias represents the average computed over the biased ensemble. In practice the right-hand side of eqn (7) is computed as the time average over a biased MD simulation. Each restrained simulation starts from an initial configuration chosen in the Cassie basin. The system is driven away from the Cassie state by progressively changing the value of N cav until the desired condition φ(r) = N cav is reached. After a standard equilibration phase the statistics for the average in eqn (7) is collected. The spring constant is chosen to be k = 0.2 which guarantees an accurate estimation of eqn (7). Summing up, in order to evaluate the free-energy profile Ω(P l,T;N cav), the free-energy gradient (eqn (7)) is computed on a set of equidistant points N cav,i via independent RMD simulations so that the full profile can be reconstructed using a simple numerical integration:
 |
8 |
where Ω 0 is the free energy computed at N cav,0 and ΔN cav = N cav,i+1 – N cav,i = 130 is the fixed difference in N cav between successive RMD points.
The MD engine used in these simulations is the open source code LAMMPS.27 The biasing force is computed using the rare events plugin PLUMED28 which can be interfaced with the LAMMPS.
2.4. A simple two-dimensional example: the Müller potential
The Müller potential30 reported in Fig. 3a is a two dimensional potential which is useful to illustrate rare events on a rough free-energy landscape, see, e.g., E et al. 31 The Müller potential is characterized by three (meta)stable states, labeled α, β, and γ in Fig. 3a.
Fig. 3. (a) Color plot and isolines for the Müller potential (arbitrary units; red corresponds to low values, while violet to large ones). α, β and γ are the minima of the potential. The blue and green points are the constrained minima along the line x = const. The black dashed curve is the actual transition pathway connecting the free-energy minima (taken from ref. 29). (b) Free-energy profile computed along the constrained minima (blue and green lines), and along the minimum energy pathway (dashed black line). (c) Müller potential computed along the line x = 0.7 (grey line in panel a), showing two minima and the free-energy barrier separating them.
Consider the case in which in order to describe the transition from α to γ only one variable is known (or can be observed), say the x variable in Fig. 3; this is by construction an approximation since the Müller potential is two dimensional. In this section we will try to clarify which are the approximations introduced with this reduced set of variables. Applying the CREaM in one variable to Müller potential amounts to perform a constrained minimization on the line x = const. This procedure yields the set of minima at a fixed x, see, e.g., the blue and green points in Fig. 3a. This set of points is then used to construct a candidate transition pathway connecting the two minima, which is formed by piecewise smooth branches roughly corresponding to the bottom of the valleys of the potential. Finally, the value of the potential computed along the pathways yields the free-energy profile reported in Fig. 3b with solid lines.
A similar result would be obtained by applying an RMD procedure to the same problem, provided that the MD trajectory remains confined to a “valley”. Indeed, the main difference between the CREaM and RMD, even when the same variable is used to describe the system, is the fact that atomistic trajectories are affected by thermal motion. Thanks to thermal fluctuations of the order of k B T MD can escape from shallow minima. For the Müller potential, depending on temperature, thermal fluctuations could overcome the orthogonal barriers shown in Fig. 3c, leading to a more effective sampling of the phase space.
Fig. 3a and b show that the cusps in the free-energy profiles are a symptom of the presence of two neighboring valleys. Around the cusp, the reduced description of the phase space via the variable x is insufficient. In RMD, due to the integration (8), even smooth free-energy profiles can hide jumps between valleys (see, e.g., Fig. 6) which become evident only by considering additional observables (e.g., y for the Müller potential).
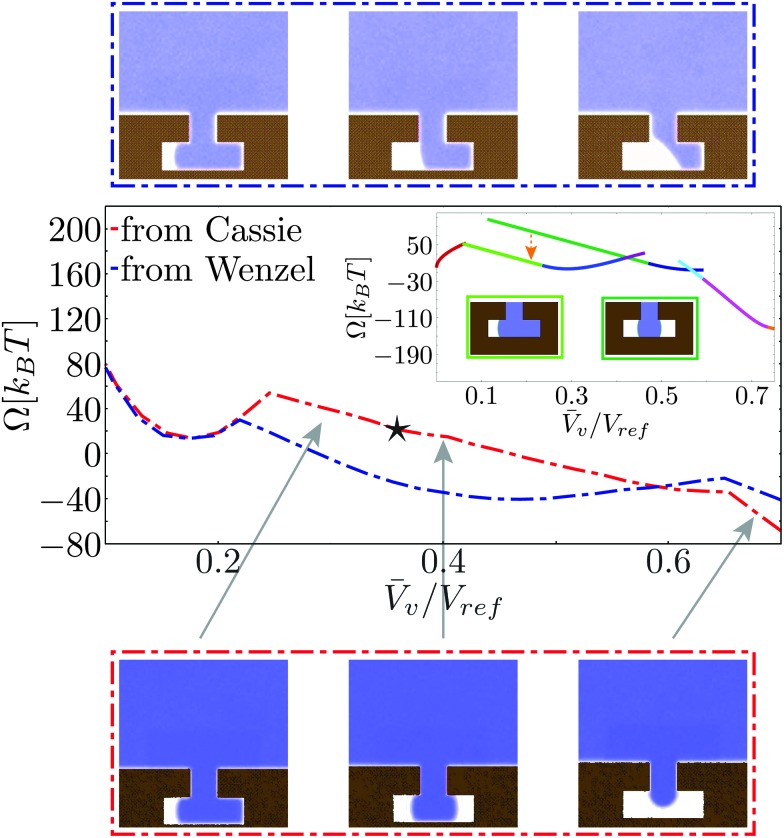
Fig. 6. Details of the atomistic (dash-dotted lines) and continuum (inset) free-energy profiles in the region of the Cassie–Wenzel transition for the hydrophobic chemistry. The red (blue) curve represents RMD results obtained by initializing the simulation from atomistic configurations in the Cassie (Wenzel) state; the same color code applies for the average fluid density fields reported in the upper (Wenzel) and lower (Cassie) strips. The star in the main panel and the orange arrow in the inset identify the approximate location of the jump between orthogonal valleys illustrated in the sketches above and explained in detail in the text.
In this two dimensional example the exact transition pathway connecting the metastable states α and γ can be computed29 (black dashed line in Fig. 3a). In Fig. 3b the free energy along the actual transition pathway is computed and projected on the x axis for comparison with the CREaM approximation. As shown in Fig. 3a, the CREaM or RMD solutions are close to the exact transition pathway when the “valleys” are deep. The two descriptions differ appreciably only near the transition state, where the reduced description in terms of x apparently breaks down. However, the location of the metastable states and the barriers separating them are similar.
Although the Cassie–Wenzel transition and cavitation are intrinsically high-dimensional problems, a recent study32 has shown that the scenario of a free-energy landscape with deep valleys illustrated in the example above also applies to capillary problems similar to that in Fig. 3. In other words the approximation in terms of a single collective variable is generally viable, except in the vicinity of jumps between neighboring valleys.
3. Results and discussion
3.1. Matching of continuum and atomistic parameters
The continuum free energy defined in eqn (3) depends on few thermodynamic parameters and material properties which need to be specified in order to match the atomistic results: ΔP, γ lv, and θ Y in addition to the geometrical dimensions of the system. Eqn (3) describes a system at constant chemical potential μ, temperature T, and total volume V. In particular the dependence of the free energy on T and μ is via the equation of state ΔP(μ,T). Thus, fixing the chemical potential and the temperature is equivalent to fixing ΔP. In the atomistic simulations the system is characterized by a constant temperature T and a constant pressure P l in the bulk liquid. In addition, since the pressure P v of the vapor phase depends primarily on T, fixing the temperature is equivalent to fixing P v. Hence ΔP = P l – P v is constant in the MD simulations; in practice, ΔP is measured in simulations (for more details see the ESI†) and is set as an input parameter for the macroscopic model. Two other physical parameters must be provided, i.e., the liquid–vapor surface tension γ lv and the Young contact angle θ Y. The surface tension is γ lv = 0.57 ± 0.02 as estimated via equilibrium simulations of liquid–vapor slabs (see ESI† for details). From the simulations γ lv is found to be independent of the size of the liquid–vapor interface up to the investigated scale. Finally the Young contact angle is computed following the same procedure described in ref. 5, which yields θ Y = 55° and θ Y = 110° for the hydrophilic and the hydrophobic chemistry, respectively. Cavity dimensions are the same for both chemistries (see Fig. 2).
Having fixed the thermodynamic and material parameters, we need to find a relationship connecting the atomistic collective variable N cav and the corresponding order parameter V v used in the CREaM. These two variables can be related using the so-called sharp kink approximation according to which the bulk properties of the liquid and vapor phases are extended up to the interface. With this approximation, the total number of particles N cav in the control volume is simply given by N cav = ρ l V l + ρ v V v, where ρ l and ρ v are the bulk density of the liquid and of the vapor phases, respectively. Considering that the total control volume V is fixed, V = V v + V l, we can write N cav = (ρ v – ρ l)V v + const. Here the constant is chosen such that V v coincides for the atomistic and continuum cases at ΔP = 0 (see Fig. 4). Finally, in all the figures V v is normalized with the volume V ref of the T-shaped microstructure, which serves as a reference.
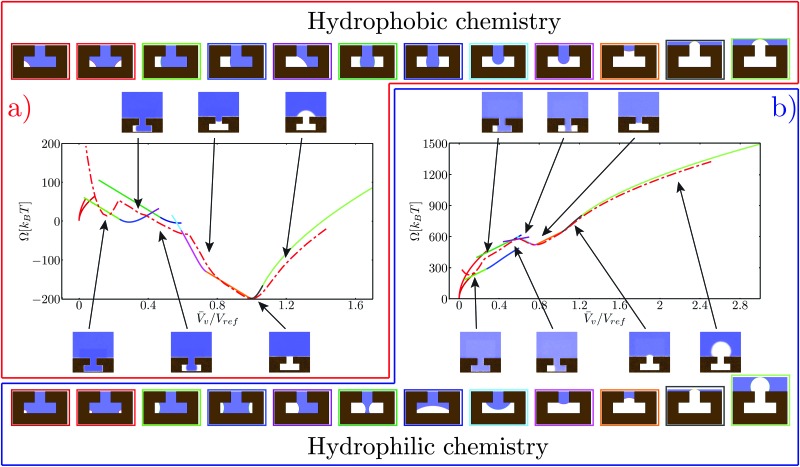
Fig. 4. Free-energy profiles for the hydrophobic (a) and hydrophilic (b) chemistries. The atomistic free energy is plotted with a red dash-dotted line. The free energy computed via the CREaM (eqn (5)) is the solid line, with each color representing a different configuration of the liquid–vapor interface. Such configurations are illustrated in the top and bottom strips for the hydrophobic and hydrophilic cases, respectively. The color of the rectangle enclosing each configuration corresponds to the branch of the same color in the CREaM free-energy profile. The insets show the atomistic average density field computed in RMD simulations, with the arrows indicating the corresponding V v.
3.2. Free-energy profiles
The free-energy profiles at ΔP ≃ 0 are reported in Fig. 4a and b for the hydrophobic and hydrophilic case, respectively. The CREaM solutions are plotted with solid lines, each color encoding a different family of vapor domains. The top and bottom rows of Fig. 4 show the corresponding shapes of the vapor bubble for the hydrophobic and hydrophilic cases, respectively. It is seen that at fixed V v several CREaM solutions are possible; for visual clarity only those with lowest free energy are shown in Fig. 4. Both atomistic and continuum free-energy profiles show two minima for hydrophilic and hydrophobic chemistries. The minimum at V v ≃ 0 corresponds to the Wenzel state; while the minimum with V v close to unity is the Cassie state. The shape of the meniscus in the Cassie state is predicted by macroscopic capillarity theory: at ΔP ≃ 0, the equilibrium condition, eqn (4a), renders an infinite radius of curvature which corresponds to a flat interface. This condition must hold together with the appropriate boundary condition. Thus an equilibrium Cassie state can be obtained only when the liquid–vapor interface is pinned at the corner of the T-structure and the angle β can take the value β = π/2. According to Gibbs criterion explained in Section 2.2, this condition is attained at the outer corner for the hydrophobic chemistry (V v = V ref) and at the inner corner for the hydrophilic one (V v = 0.75V ref).
In CREaM profiles, the macroscopic Wenzel state is attained by construction at V v = 0 while the MD profiles have slightly different values. This discrepancy is due to the liquid density depletion near the solid wall in the nanostructure.33 This depletion layer is not taken into account in the sharp interface approximation used to relate N cav and V v. Its thickness depends on the chemistry of the surface and on the liquid pressure, with the larger values corresponding to the hydrophobic solid and to low pressures; this explains why the Wenzel state for the hydrophilic chemistry is closer to V v = 0.
In the following discussion, in order to make a quantitative comparison between the microscopic and macroscopic description of the Cassie–Wenzel transition and of cavitation, we divide the free-energy profile in three regions
• V v ≥ 0.7V ref which is relevant to the cavitation regime;
• 0.2V ref ≤ V v ≤ 0.7V ref which includes the configurations explored in the Cassie–Wenzel transition;
• V v ≤ 0.2V ref which corresponds to the Wenzel basin.
In the first region, the free-energy barriers and the critical volumes are compared for atomistic and macroscopic models. Only the hydrophilic chemistry is considered, since the critical bubbles for the hydrophobic case are too large (in the x-direction, see, e.g., the inset of Fig. 4a for V v > 1) for the definition of the collective variable given in Fig. 2. In the second region, atomistic and macroscopic Cassie–Wenzel transition pathways are compared. Finally, in the third region, the behavior of the two models near the Wenzel state is analyzed.
3.3. Cavitation
At negative pressures ΔP < 0 the free-energy profiles show a maximum for V
v ≥ V
ref which corresponds to a critical cavitation bubble of volume Vcrv(ΔP) (inset of Fig. 5a). The ensuing free-energy barrier 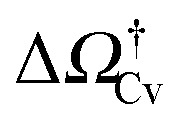 separates the Cassie state from the thermodynamically stable vapor state. This barrier, as stated before, dictates the kinetics of cavitation viaeqn (1). Fig. 5a reports
 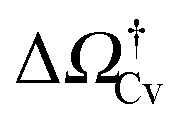 as a function of ΔP for the atomistic simulations (red symbols) and for the CREaM (black solid line). For the simple cavitation pathways shown in Fig. 4, the findings of the CREaM coincide with the classical nucleation theory (CNT).34 The trend shows that the atomistic barrier is always less than the macroscopic one. These findings are in agreement with previous simulation studies35,36 which predict that CNT overestimates the height of the barrier for the case of homogeneous nucleation. The pressure at which
  disappears is designated as spinodal pressure for the Cassie–vapor transition, PCvsp; the atomistic value for PCvsp is less than the macroscopic counterpart.
Fig. 5. (a) Atomistic (red symbols) and continuum (black line) free-energy barriers for cavitation as a function of ΔP computed for the hydrophilic surface. The definition of the Cassie–vapor free-energy barrier 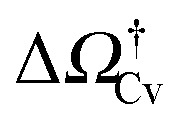 is reported in the inset, showing a detail of the atomistic and continuum free-energy profiles for a representative negative pressure. (b) Critical volumes computed via atomistic (red symbols) and continuum (solid lines) approaches as a function of ΔP. Two different configurations of the critical bubble exist: a pinned bubble (blue line and related inset) and a depinned one nucleating on the flat solid surface (green line and related inset).
The volume Vcrv of the critical bubble is reported in Fig. 5b as a function of ΔP. For the CREaM, the critical volume (solid lines) is dictated by the Laplace law, eqn (4a), which, in two-dimensions, gives R c = γ lv/ΔP with R c the radius of curvature of the critical bubble. The critical volume Vcrv can be easily computed from R c. There are two possible configurations for the critical bubble. For largely negative pressures the critical bubble is pinned at the outer corner of the T-shaped structure (blue line in Fig. 5b). For moderately negative pressures, the critical bubble meets the solid wall with the Young contact angle (green line in Fig. 5b). The atomistic critical volume (red symbols in Fig. 5b) is in fair agreement with the macroscopic ones at moderately negative pressures for which the critical bubble is not pinned. In conclusion, the Laplace equation predicts rather accurately Vcrv at the nanoscale and over a broad range of pressures.
3.4. Pathways for the Cassie–Wenzel transition
Fig. 6 reports the free-energy profile and the Cassie–Wenzel transition pathway on a hydrophobic cavity for the atomistic (red dash-dotted lines) and the macroscopic approaches (inset). The initial conditions for these RMD simulations are in the Cassie state as for the profiles in Fig. 4.
Both RMD and the CREaM free-energy profiles show cusps, which are signatures of the transition between orthogonal shallow valleys as discussed in the model potential of Section 2.4. The first cusp, near the Wenzel state, is discussed in detail in the next subsection. The second cusp, at V v ≃ 0.65V ref in the red RMD profile, corresponds to the transition between an interface pinned at the inner corner (right branch) and one with the liquid touching the cavity bottom (left branch, see the lower strip in Fig. 6).
As the liquid touches the bottom, the atomistic transition pathway switches between two different configurations: a symmetric one, with two vapor bubbles in the arms of the T-structure and an asymmetric one, with a vapor bubble in only one arm, see Fig. 6. In the macroscopic profile these two states correspond to different solutions of eqn (5). The occurrence of this morphological transition in RMD can be explained as a thermally activated jump between two shallow valleys, as illustrated in Fig. 3c. In other words, there is a free-energy barrier in the subspace orthogonal to that spanned by the collective variable N cav which in RMD is overcome by thermal fluctuations. Clearly, the atomistic description cannot follow each single branch separately because the orthogonal free-energy barriers are of the order of k B T. In contrast, the macroscopic model is capable of following more branches but is unable to jump between any two of them and to evaluate the orthogonal free-energy barriers. The jump occurring in the atomistic simulations, identified by a star in Fig. 6, cannot be detected simply by looking at the free-energy profile, which is smooth (no cusps). However, the jump is easily revealed by examining the corresponding density fields along the transition pathways. The observed abrupt change of configuration corresponds to a free-energy jump between the two valleys identified by the CREaM, shown by the orange dashed arrow between the dark and light green profiles in Fig. 6. These two branches share, at least in the CREaM, the same free-energy gradient. Based on the observed agreement between the atomistic and macroscopic results, the same mean force is expected in eqn (7) irrespective of which of the two branches is visited by the dynamics. In this way the morphological transition is concealed by the thermodynamic integration used to reconstruct the RMD profile (eqn (8)). The macroscopic expression for the free energy, instead, is capable of distinguishing the (absolute, with no undetermined integration constant) free energy of the two branches revealing that the single bubble configuration is energetically favored.
A second atomistic pathway is reported in Fig. 6, which is generated by choosing the initial condition for the RMD simulations in the Wenzel basin (blue dash-dotted line). It is seen that the pathway selected by these initial conditions is different from the one started from Cassie. In particular, the system dynamics cannot explore the valley corresponding to two “symmetric” menisci because this is at higher free energy by ca. 20k B T (see the orange arrow for CREaM calculation). Thus the system is stuck in asymmetric configurations of the meniscus, which first pins at the lower corner of the re-entrant mouth and eventually detaches from it (top strip). This result confirms that the free-energy landscape is extremely complex and suggests that for the Cassie–Wenzel transition and for cavitation two different pathways can be followed. In order to confirm this insight, more sophisticated techniques should be used, such as the string method in collective variables.37
Similar arguments apply also to the system with hydrophilic chemistry. However in this case the number of alternative valleys is very large (see Fig. 4b and ESI†), making a detailed analysis like the one reported for the hydrophobic case very cumbersome.
3.5. Wenzel state
Looking at the free-energy profiles in Fig. 4 it appears that, for both chemistries, atomistic and macroscopic models have qualitatively different behaviors close to the Wenzel basin: the concave atomistic free energy can be roughly described as a parabola with an upward concavity in contrast with the macroscopic one which has an opposite curvature. Strictly speaking, the parabolic approximation is valid only around the Wenzel minimum at ΔP = 0; for larger V v, deviations from parabolicity, the so-called fat tails,39 cannot be excluded on the basis of the present computations. The parabolic trend indicates that, close to the Wenzel state, the probability distribution p(N cav) for the atomistic collective variable is Gaussian as per eqn (6). This behavior is typical of liquids under confinement and accounts for the fluid density fluctuations at the wall.38,39 These fluctuations can be related to the compressibility of the (confined) liquid.40 The upward concavity of the Wenzel basin implies a positive compressibility, which is naturally captured by the atomistic system. For the macroscopic case, instead, the free-energy behavior is completely different since the compressibility vanishes altogether by the sharp-kink approximation (ρ l and ρ v are constant), entailing a different trend. This can be made explicit by expanding close to the Wenzel state the expression for the macroscopic free energy, which scales as the liquid–vapor surface area Ω ∝ V v 2/3, which is quite different from the atomistic scaling ≃V v 2. Similar results are found by Remsing et al.,41 who investigated the liquid/vapor transition between two flat hydrophobic surfaces of nanometric extension. They also found that near the pure liquid state the free energy is harmonic as opposed to the V v 2/3 trend predicted by the (incompressible) classical nucleation theory. Another connection with the present results is the “kink” that these authors find in free-energy profiles which could probably be interpreted in the light of the simple model in Fig. 3.
A direct consequence of the upward concavity of the Wenzel basin is the existence of a liquid (or Wenzel) spinodal ΔPWsp which has no counterpart in the (incompressible) macroscopic model, see the insets in Fig. 7b and in Fig. 7a, respectively. This reflects the physical fact that superhydrophobicity can be restored at sufficiently low pressures. In contrast, the classical nucleation theory fails to capture this feature, predicting finite free energy barriers for all pressures.18
Fig. 7. Derivatives of the free energy with respect to V v (main panels) and free-energy profiles (insets) for the hydrophobic system obtained by CREaM calculations (a) and RMD simulations (b). Two pressures are reported: greater (red) and less (blue) than the liquid spinodal pressure ΔPWsp.
In order to make these observation more quantitative, we report in Fig. 7 the free-energy profiles Ω(V v/V ref) (insets) and their derivative dΩ/d(V v/V ref) for pressures greater (red) and less (blue) than the liquid spinodal. For the macroscopic model, it is seen that the Wenzel state is attained by construction at V v = 0, while the point at which the free-energy derivative jumps from positive to negative values corresponds to the free-energy maximum (Fig. 7a). Decreasing the pressure amounts to shifting the free-energy derivative dΩ/d(V v/V ref) ≡ λ by a constant, see eqn (5). Since, however, dΩ/d(V v/V ref) has a vertical asymptote for V v → 0, a maximum always exists in the continuum model. This maximum is a regular point for large negative pressures, corresponding to a critical bubble nucleating in the corner, while it is a cusp for moderately negative pressures. This cusp is generated by the presence of two valleys having different slopes, cf. Fig. 3.
In the atomistic case, instead, the free-energy derivative changes the sign twice for ΔP ≥ ΔPWsp. These two stationary points are the Wenzel and transition states, respectively, as shown in Fig. 7b. Upon decreasing pressures, the Wenzel state gradually shifts to larger V v, see also ref. 42. When ΔP ≤ ΔPWsp, no stationary point exists and the Wenzel state becomes unstable. Because of the peculiar shape of the Wenzel basin, in the atomistic case the maximum is always attained at the cusp where the free-energy derivative has a discontinuity.
4. Conclusions
In the present work wetting and cavitation on nanostructured surfaces have been studied via molecular dynamics and macroscopic capillarity models. Rare event methods have been used in order to determine the wetting and cavitation pathways and the related free energy barriers, which dictate the thermally activated kinetics of the two phenomena. The systems considered here consist of a re-entrant nano-cavity with hydrophobic and hydrophilic chemistry, respectively. Given the re-entrant geometry, both chemistries allow for the presence of a Cassie state. We have found that the free energy landscape is characterized by many “valleys”, indicating that many pathways are possible for wetting and cavitation on nanostructured surfaces. These pathways and the kinetics of the process strongly depend on the chemistry and on the geometry of the surface, with the hydrophilic chemistry showing the largest number of transition pathways.
Comparison of the present results with previous work on simpler textures11,18 shows that the number of possible pathways dramatically increases with the complexity of the surface texture. For instance, rectangular grooves admit ca. 7 different single-bubble families,11 which constitute chunks of the overall pathway; since two rectangular ends are present in the re-entrant geometry considered here, the number of pathways doubles just because of the trivial replication of the bubble shapes at the left and at the right ends. The re-entrant mouth further increases the number of possible bubble configurations to at least 20 (cf. Fig. 4 in which the symmetric configurations are not shown). It is expected that three-dimensional geometries also induce an analogous increase in the number of pathways. This explosion of complexity may seem to preclude in practice the applicability of the CREaM/Surface Evolver framework to more sophisticated textures. However, we note that only the few pathways with the lowest free energy need to be considered, while the vast majority of them is extremely improbable; symmetry arguments are able to identify bubble configurations that are equiprobable and thus need to be computed only once (e.g., the left/right symmetry mentioned above). Furthermore, simple arguments can be devised a priori on the number and combination of bubbles which are energetically favored.11
The present results allowed for a detailed quantitative comparison of the atomistic and continuum models at the nanoscale. The major qualitative difference concerns the curvature of the free energy profile close to the Wenzel state. For the atomistic model this curvature is positive, accounting for density fluctuations of the confined liquid.38 The macroscopic model, instead, due to the assumption of liquid incompressibility, does not capture density fluctuations and features a negative curvature. This discrepancy is reflected in the different (non-classical) pathways to wetting and nucleation, which in turn lead to different estimates for the kinetics.41 Strictly related to the compressibility is the presence of a liquid spinodal – shifted by confinement as compared to the bulk one – which is only captured by the atomistic model. Quantitative differences emerge in the free energy barriers connected with cavitation, with the macroscopic model (classical nucleation theory) overestimating them. As expected, the largest discrepancies are found away from two-phase coexistence, where the size of the critical bubble becomes nanometric.
The complex free energy landscape connected with wetting and cavitation on structured surfaces has required particular attention in interpreting the results of the rare event atomistic simulations and continuum calculations. The approximation introduced by a reduced description of the transition in terms of a single variable (the volume of the vapor bubble) has been discussed in detail. This convenient choice, which is normally used, e.g., in classical nucleation theory, is capable of identifying most of the pathways, but fails when there is a morphological transition.32 Sufficient but not necessary symptoms of the failure of a reduced description are the presence of cusps in the free energy profile. Furthermore, thermodynamic integration, which is often used in atomistic free-energy methods, may fail to capture significant free-energy jumps. In order to overcome these limitations, a full description of the fluid density field would be required in order to capture the details of the phenomenon and the exact free energy barriers. The latter results call for a more profound understanding of the coarse grained description of a liquid.
Acknowledgments
The research leading to these results has received funding from the European Research Council under the European Union's Seventh Framework Programme (FP7/2007-2013)/ERC Grant agreement no. [339446]. We acknowledge PRACE for awarding us access to resource FERMI based in Italy at Casalecchio di Reno.
Footnotes
References
- Lafuma A., Quéré D. Nat. Mater. 2003;2:457–460. doi: 10.1038/nmat924. [DOI] [PubMed] [Google Scholar]
- Zhang X., Shi F., Niu J., Jiang Y., Wang Z. J. Mater. Chem. 2008;18:621–633. [Google Scholar]
- Nosonovsky M., Bhushan B. Curr. Opin. Colloid Interface Sci. 2009;14:270–280. [Google Scholar]
- Yan Y., Gao N., Barthlott W. Adv. Colloid Interface Sci. 2011;169:80–105. doi: 10.1016/j.cis.2011.08.005. [DOI] [PubMed] [Google Scholar]
- Amabili M., Giacomello A., Meloni S., Casciola C. M. Adv. Mater. Interfaces. 2015;2:1500248. [Google Scholar]
- Checco A., Rahman A., Black C. T. Adv. Mater. 2014;26:886–891. doi: 10.1002/adma.201304006. [DOI] [PubMed] [Google Scholar]
- Checco A., Ocko B. M., Rahman A., Black C. T., Tasinkevych M., Giacomello A., Dietrich S. Phys. Rev. Lett. 2014;112:216101. [Google Scholar]
- Verho T., Korhonen J. T., Sainiemi L., Jokinen V., Bower C., Franze K., Franssila S., Andrew P., Ikkala O., Ras R. H. Proc. Natl. Acad. Sci. U. S. A. 2012;109:10210–10213. doi: 10.1073/pnas.1204328109. [DOI] [PMC free article] [PubMed] [Google Scholar]
- Eyring H. J. Chem. Phys. 1935;3:107. [Google Scholar]
- Maragliano L., Vanden-Eijnden E. Chem. Phys. Lett. 2006;426:168–175. [Google Scholar]
- Giacomello A., Chinappi M., Meloni S., Casciola C. M. Phys. Rev. Lett. 2012;109:226102. doi: 10.1103/PhysRevLett.109.226102. [DOI] [PubMed] [Google Scholar]
- Marmur A. Langmuir. 2008;24:7573–7579. doi: 10.1021/la800304r. [DOI] [PubMed] [Google Scholar]
- Joly L., Biben T. Soft Matter. 2009;5:2549–2557. [Google Scholar]
- Savoy E. S., Escobedo F. A. Langmuir. 2012;28:16080–16090. doi: 10.1021/la303407r. [DOI] [PubMed] [Google Scholar]
- Tuteja A., Choi W., Mabry J. M., McKinley G. H., Cohen R. E. Proc. Natl. Acad. Sci. U. S. A. 2008;105:18200–18205. doi: 10.1073/pnas.0804872105. [DOI] [PMC free article] [PubMed] [Google Scholar]
- Bonella S., Meloni S., Ciccotti G. Eur. Phys. J. B. 2012;85:1–19. [Google Scholar]
- Gibbs J. W., The Scientific Papers of J. Willard Gibbs, Thermodynamics, Dover Publications, New York, 1961, vol. 1, p. 434. [Google Scholar]
- Giacomello A., Chinappi M., Meloni S., Casciola C. M. Langmuir. 2013;29:14873–14884. doi: 10.1021/la403733a. [DOI] [PubMed] [Google Scholar]
- Brakke K. A. Experim. Math. 1992;1:141–165. [Google Scholar]
- Kusumaatmaja H. J. Chem. Phys. 2015;142:124112. doi: 10.1063/1.4916389. [DOI] [PubMed] [Google Scholar]
- Frenkel D. and Smit B., Understanding molecular simulation: from algorithms to applications, Academic Press, 2001. [Google Scholar]
- Gentili D., Bolognesi G., Giacomello A., Chinappi M., Casciola C. M. Microfluid. Nanofluid. 2014;16:1009–1018. [Google Scholar]
- Martyna G. J., Klein M. L., Tuckerman M. J. Chem. Phys. 1992;97:2635–2643. [Google Scholar]
- Bolhuis P. G., Chandler D., Dellago C., Geissler P. L. Annu. Rev. Phys. Chem. 2002;53:291–318. doi: 10.1146/annurev.physchem.53.082301.113146. [DOI] [PubMed] [Google Scholar]
- Giacomello A., Meloni S., Chinappi M., Casciola C. M. Langmuir. 2012;28:10764–10772. doi: 10.1021/la3018453. [DOI] [PubMed] [Google Scholar]
- Ciccotti G., Meloni S. Phys. Chem. Chem. Phys. 2011;13:5952–5959. doi: 10.1039/c0cp01335h. [DOI] [PubMed] [Google Scholar]
- Plimpton S. J. Comput. Phys. 1995;117:1–19. [Google Scholar]
- Bonomi M., Branduardi D., Bussi G., Camilloni C., Provasi D., Raiteri P., Donadio D., Marinelli F., Pietrucci F., Broglia R. A. Comput. Phys. Commun. 2009;180:1961–1972. [Google Scholar]
- E W., Ren W., Vanden-Eijnden E. Phys. Rev. B: Condens. Matter Mater. Phys. 2002;66:052301. [Google Scholar]
- Müller K., Brown L. D. Theor. Chim. Acta. 1979;53:75–93. [Google Scholar]
- E W., Ren W., Vanden-Eijnden E. J. Chem. Phys. 2007;126:164103. doi: 10.1063/1.2720838. [DOI] [PubMed] [Google Scholar]
- Giacomello A., Meloni S., Müller M., Casciola C. M. J. Chem. Phys. 2015;142:104701. doi: 10.1063/1.4913839. [DOI] [PubMed] [Google Scholar]
- Janecek J., Netz R. R. Langmuir. 2007;23:8417–8429. doi: 10.1021/la700561q. [DOI] [PubMed] [Google Scholar]
- Beischer D. Z. Elektrochem. Angew. Phys. Chem. 1940;46:327. [Google Scholar]
- González M. A., Menzl G., Aragones J. L., Geiger P., Caupin F., Abascal J. L., Dellago C., Valeriani C. J. Chem. Phys. 2014;141:18C511. doi: 10.1063/1.4896216. [DOI] [PubMed] [Google Scholar]
- ten Wolde P. R., Frenkel D. J. Chem. Phys. 1998;109:9901–9918. [Google Scholar]
- Maragliano L., Fischer A., Vanden-Eijnden E., Ciccotti G. J. Chem. Phys. 2006;125:024106. doi: 10.1063/1.2212942. [DOI] [PubMed] [Google Scholar]
- Lum K., Chandler D., Weeks J. D. J. Phys. Chem. B. 1999;103:4570–4577. [Google Scholar]
- Patel A. J., Varilly P., Chandler D. J. Phys. Chem. B. 2010;114:1632–1637. doi: 10.1021/jp909048f. [DOI] [PMC free article] [PubMed] [Google Scholar]
- Evans R., Stewart M. C. J. Phys.: Condens. Matter. 2015;27:194111. doi: 10.1088/0953-8984/27/19/194111. [DOI] [PubMed] [Google Scholar]
- Remsing R. C., Xi E., Vembanur S., Sharma S., Debenedetti P. G., Garde S., Patel A. J. Proc. Natl. Acad. Sci. U. S. A. 2015;112:8181–8186. doi: 10.1073/pnas.1503302112. [DOI] [PMC free article] [PubMed] [Google Scholar]
- Patel A. J., Varilly P., Jamadagni S. N., Hagan M. F., Chandler D., Garde S. J. Phys. Chem. B. 2012;116:2498–2503. doi: 10.1021/jp2107523. [DOI] [PMC free article] [PubMed] [Google Scholar]
Associated Data
This section collects any data citations, data availability statements, or supplementary materials included in this article.


