SUMMARY
Finite Element Analysis (FEA) has been used for prediction of stress and strain between dental implant components and bone in the implant design process.
Purpose
Purpose of this study was to characterize and analyze stress and strain distribution occurring in bone and implants and to compare stress and strain of three different implant designs.
Materials and methods
Three different mini dental implant designs were included in this study: 1. a mini dental implant with an internal implant-abutment connection (MDIi); 2. a mini dental implant with an external implant-abutment connection (MDIe); 3. a single piece mini dental implant (MDIs). All implant designs were scanned using micro-CT scans. The imaging details of the implants were used to simulate models for FEA. An artificial bone volume of 9×9 mm in size was constructed and each implant was placed separately at the center of each bone model. All bone-implant models were simulatively loaded under an axial compressive force of 100 N and a 45-degree force of 100 N loading at the top of the implants using computer software to evaluate stress and strain distribution.
Results
There was no difference in stress or strain between the three implant designs. The stress and strain occurring in all three mini dental implant designs were mainly localized at the cortical bone around the bone-implant interface. Oblique 45° loading caused increased deformation, magnitude and distribution of stress and strain in all implant models.
Conclusions
Within the limits of this study, the average stress and strain in bone and implant models with MDIi were similar to those with MDIe and MDIs. The oblique 45° load played an important role in dramatically increased average stress and strain in all bone-implant models.
Clinical implications
Mini dental implants with external or internal connections have similar stress distribution to single piece mini dental implants. In clinical situations, the three types of mini dental implant should exhibit the same behavior to chewing force.
Keywords: mini dental implants, finite element analysis, stress and strain distribution, implant-abutment connection
Introduction
In some situations, such as inadequate interdental space, reduced interocclusal space, close proximity of adjacent tooth roots, convergent adjacent tooth roots, or narrow atrophic osseous contour, narrow neck implants or mini dental implants might be a suitable treatment option (1). Mini implants may be immediately loaded in appropriate osseous situations and may also provide an alternative treatment if osseous conditions preclude a standard-sized implant approach. Mini implants may also provide solutions in patients where there is severe osseous atrophy that standard-sized implant treatment cannot be conducted.
The use of mini dental implants to retain removable partial and complete dentures has become a common treatment with high efficacy (1). In highly selected situations, mini dental implants can be used to support fixed partial or complete dentures. Much research has also been conducted on mini implants for orthodontic use. Mini implants may be relatively easy to place and restore using appropriate preoperative data collection, such as osseous ridge contour and gingival quantity.
There are many brands and designs of mini dental implants from various manufacturers. Before series production, each implant design must be evaluated according to the effects of a prototype on natural bone tissue. One important process is to evaluate stress and strain occurring in the implant and the surrounding bone. Studying the effects of the loading forces is necessary in implant dentistry as a precaution and to improve the survival of implant-supported prostheses (2). The biomechanical study method that is increasingly used to demonstrate and predict stress distribution in the contact area of the implants and the surrounding bone is finite element analysis (FEA) (3–5).
Finite element analysis (FEA) is a computer technique for stress analysis. The effect of loading forces on a prosthesis or peri-implant region can be evaluated by using the equivalent stress (von Mises stress), expressed in megapascals (MPa) (6). The equivalent stress in the affected object can be calculated from two- or three-dimensional loading forces, using the von Mises formula. The results of the von Mises equation, equivalent stress, subsequently are compared with the yield stress of the object (3, 7). FEA is a useful technology for prediction of the impacts of stress on the implant and its surrounding bone.
The amount of stress around the peri-implant regions and prosthetic structures are presented by different colors. Each color indicates the different amount of the stress at the prosthesis and peri-implant region.
FEA studies of dental implants have shown that there are differences in stress and strain in implants depending on the type of loading, bone-implant interface, length and diameter of implants, shape and characteristics of implant surfaces, prosthetic type and quality and quantity of the surrounding bone (4, 5, 8–12).
In centric loading, some FEA studies of osseointegrated implants mention that when maximum stress concentration is located in cortical bone, it occurs in the contact area with the implant (13–15). When the maximum stress concentration is located in trabecular bone, it is around the apex of the implant. In cortical bone, stress distribution is restricted to the immediate area surrounding the implant, but in the trabecular bone, the stress distribution is over a broader area.
In small diameter implants, stress occurring in the surrounding bone is higher and wider in distribution than in large implant in both vertical and lateral loads (16). The stress magnitude and stress distribution decline proportionally to increased implant diameter (4). Strain and displacement are also high in mini dental implants and are decreased by increasing implant diameters. Nevertheless, using the largest diameter implant may not be the best choice. Holmgren et al. suggested that morphologic limits of the stress and the surrounding bone should be considered for choosing an optimum dental implant size to reduce the stress magnitude at the bone-implant interface (4, 16).
Mini dental implants have been widely used in clinical practice because of their benefits; no complex surgery, flapless operation and immediate loading. One of the most useful treatment is to retain mandibular complete denture. With its small size, it is not necessary for bone grafting surgery and surgical procedure is very simple. The use of mini dental implants to retain removable partial and complete dentures is widely documented (1). Mini implants can retain maxillary or mandibular removable prostheses. The supporting bone density should be the type I or II for appropriate long-term success. The purpose of this study was to characterize stress and strain distribution in both implant and bone and to compare stress and strain between three different designs of commercially available mini dental implants.
Material and methods
Model generation
1. Bone model
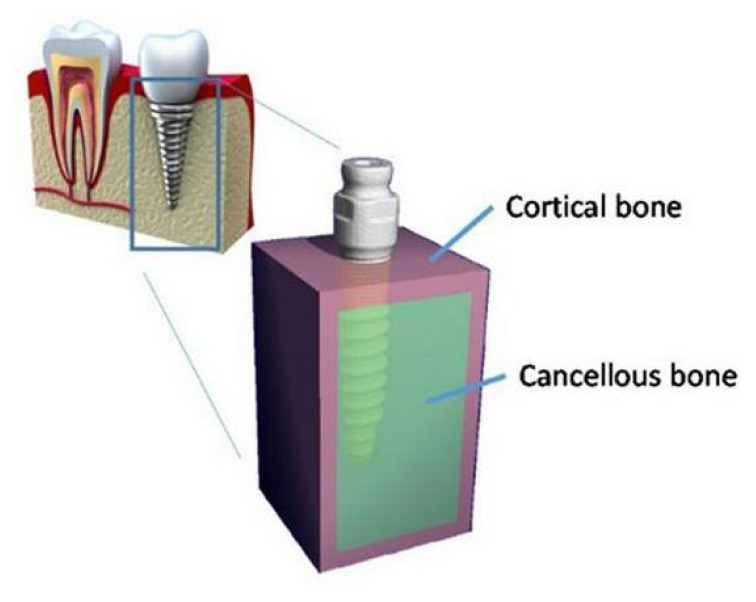
The bone was modeled as a simulated square of 9×9 mm in size. The bone models were assumed as a generalized homogenous volume, filled with cancellous bone and surrounded by a 1-mm cortical shield at the top/bottom and on the medial/lateral side. No cortical bone was modeled at the posterior/anterior surfaces since the bone should represent a segment of a mandible. This bone representation was used for all implants to make it possible to compare the results between each implant.
2. Implant models
The implants used in this study were:
Mini dental implant 2.75 mm (PW plus®, PWSE, Nakhon Pathom, Thailand). This implant is of root-formed shape consisting of two pieces, abutment and implant, with an internal connection (MDIi). The implant length was 12 mm.
Mini dental implant (Locator®, Zest Anchors, Escondido, California, USA) with a diameter of 2.4 mm and length of 12 mm. This product also consisted of two pieces, abutment and implant, but with an external connection (MDIe).
-
Mini dental implant (MDI®, 3M ESPE, St. Paul, Minnesota, USA), a single-piece, 2.4-mm mini dental implant of 13 mm length (MDIs).
Each implant was scanned by micro-CT (Scanco μCT 35 desktop micro CT Scanner from Scanco Medical, Zurich, Switzerland).
During micro-CT scanning, all implants were aligned to the Z-axis to make sure that all implants were exactly in the same position. The resolution was reduced to 40 microns to reduce the number of elements generated in the process of developing the finite element models. The CT images were thresholded to segment only of the implants.
3. Bone-Implant model generation
To generate the bone-implant model, each implant was placed at the center of the bone volume.
Therefore, each implant was surrounded by 3 mm of bone. The tip of each implant was also adjusted to be 3 mm above the bone surface and the collar of each implant was set just inside the bone region. The implants were assumed to be fully bonded to the cortical and cancellous bone (Figure 1).
Figure 1.
The FE model represents a 9 mm thick slab of mandibular bone with the implant at the center.
Finite element analysis
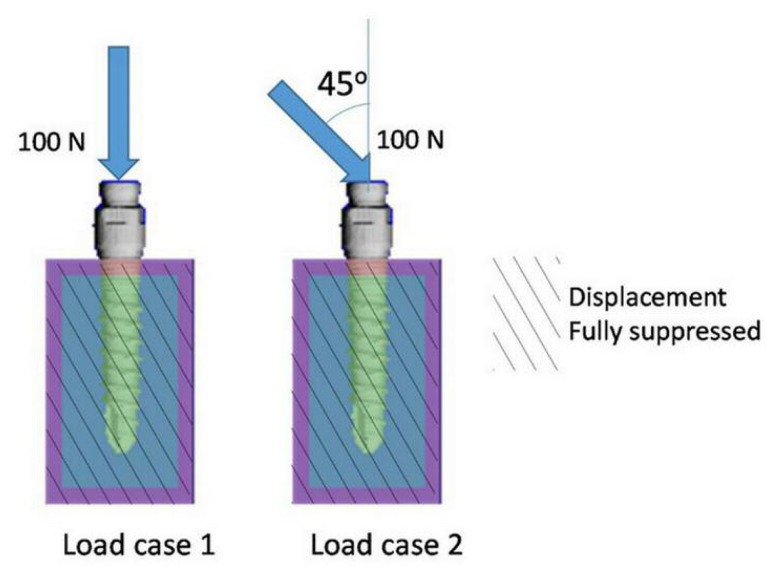
The simulated bone-implant models were set into two groups, each consisting of models of three different commercial implants. The first group of bone-implant models was placed under an axial load of 100 N, acting on the top of the implant (load case 1). The second group was loaded with a force of 100 N, acting at 45° to the top of the implant (load case 2). The anterior and posterior sides of the bone model, which had no full cortical bone layer, were fully suppressed in displacement.
Material properties were assigned to represent the different materials: 10 GPa for cortical bone, 500 MPa for cancellous bone and 110 GPa for the titanium implant (Figure 2).
Figure 2.
Loading conditions applied with load case 1 and load case 2. At the anterior and posterior (front and back) surface of the model, displacement was fully suppressed.
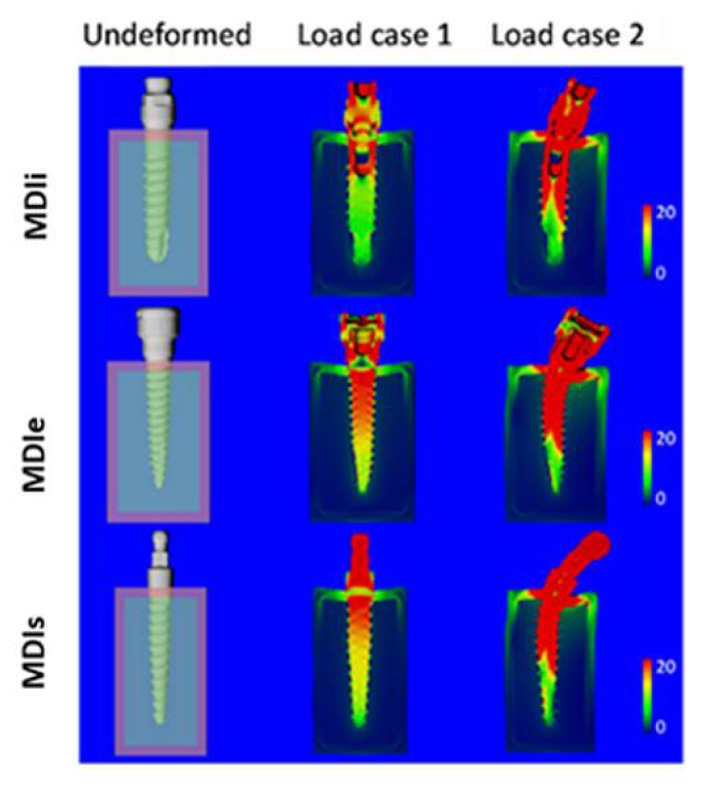
After loading, plots of the deformed shapes of the implants resulting from the loading were made to reveal the deformation mode of the implants. Because the deformations were very small, they were scaled by a factor 50 to make these visible. Stresses were quantified by the Von Mises stress.
These were calculated from the individual stress and strain components in the following equation:
Strains were quantified by the energy equivalent strain, which was calculated as:
With E, the Young’s modulus and U, the strain energy density was defined as:
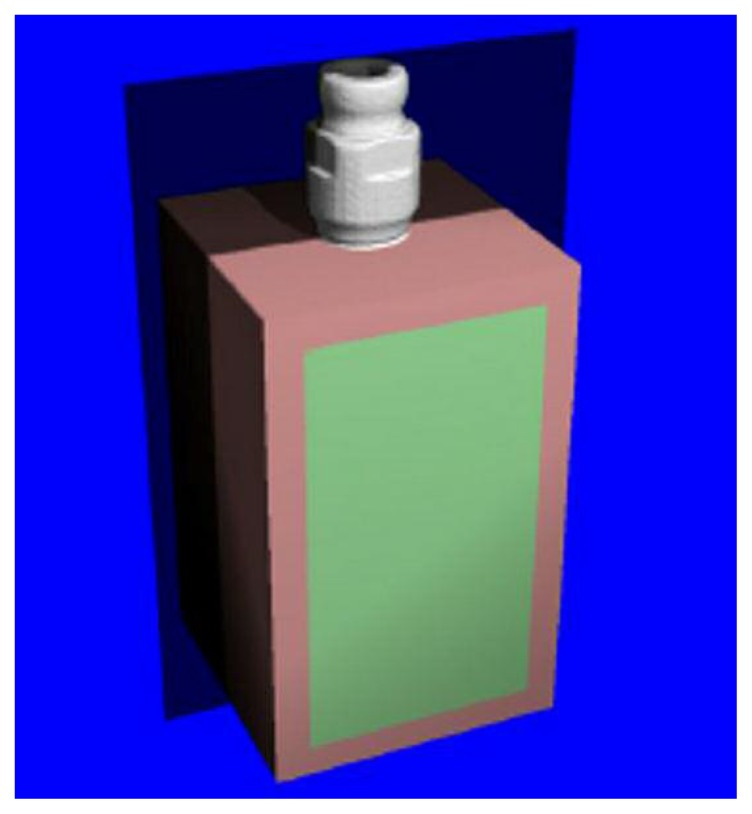
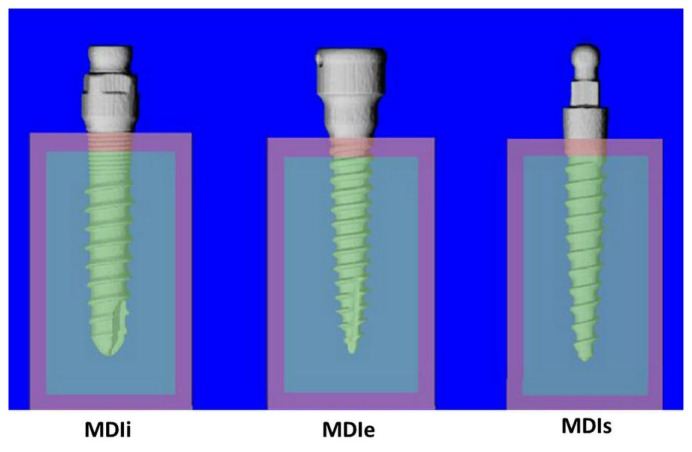
To reveal the stress and strain within the bone and implant, the 3-D models of each implant were cut in half, as shown in Figure 3. The bone was made transparent to indicate visibility of the position of the implant. The final models are shown in Figure 4.
Figure 3.
The plane along which the models are ‘cut’ to reveal the stress and strain distributions inside the bone and implant.
Figure 4.
Bone-implants models. Pink represents cortical bone and green represents cancellous bone.
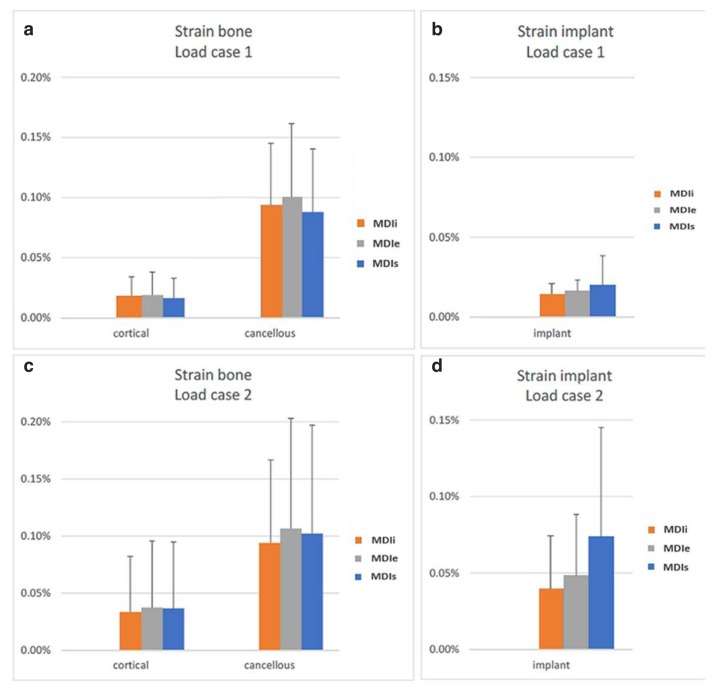
The average stress and strain was calculated for each of the different regions of the model: cortical bone, cancellous bone and implant. Averages of stress and strain and their standard deviations were plotted in bar graphs.
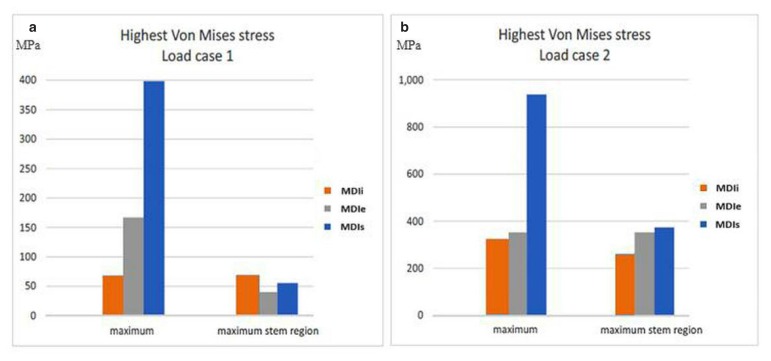
Finally, for the implant only, the highest stress values were quantified by the 95th percentile of the Von Mises stress distribution and by the maximum Von Mises value found in any element of the implant. The maximal stress of only the part of the implant that was within the bone was also calculated to obtain a more accurate representation of the maximum stress.
Results
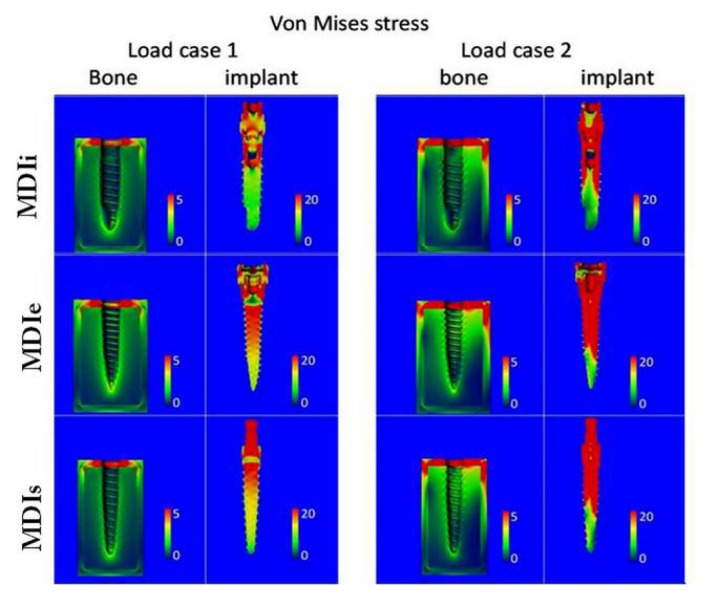
The average stress in load case 2 are generally greater than in load case 1 in both implants and bone. The average stress in the cortical bone of load case 2 was roughly double that of load case 1; however, the stresses in the cancellous bone remained almost unchanged. The distribution of stress and strain in load case 2 was also greater than that in load case 1 (Figure 5).
Figure 5.
Contour plots of the Von Mises stress in the bone and in the implant for load case 1 (left) and load case 2 (right). Units are MPa. Note the different scales for bone and implant plots.
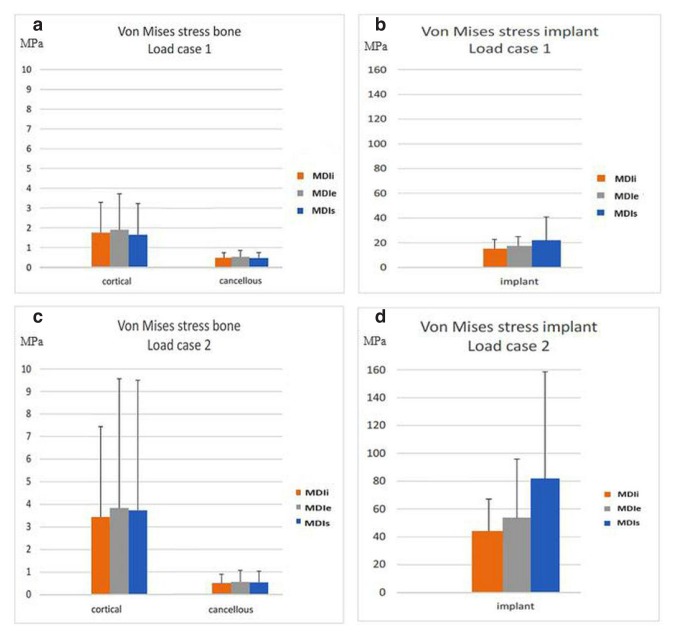
In the bone, the stress occurring in the cortical bone was greater than in cancellous bone (Figures 6a, c). The stress occurring in the peri-implant region was greater than in regions far away from the implant. There was no difference in the stress occurring in cortical and cancellous bone among the three difference implant designs (Figures 6b–d).
Figure 6.
a) Average Von Mises stress in bone for load case 1. b) Average Von Mises stress in implant for load case 1. c) Average Von Mises stress in bone for load case 2. d) Average Von Mises stress in implant for load case 2.
In the implants, the highest stress values in both load case 1 and 2 were in MDIs and the lowest stress values were in MDIi.
Stress in bone and implant
Highest stress in implants
Comparing the maximum stresses occurring in the implants in both loading directions (Figures 7a, b), the greatest maximal stress value was in the MDIs, the maximal stress in the MDIe was less and the maximal stress in the MDIi was the least. However, the stress in the stem region of the mini dental implants under axial load in the MDIi was the greatest, that in the MDIs was less and that in the MDIe was the least. For load case 2 only, the locations where high loads occurred were identified by making plots in which only the regions loaded beyond 250 MPa were colored, whereas the rest of the implant was made transparent (Figure 8). In all cases, the locations of greatest stress were in the collar region where the implant was in contact with the cortical bone.
Figure 7.
a) The highest Von Mises stress in the implants for load case; b) The highest Von Mises stress in the implants for load case 2.
Figure 8.
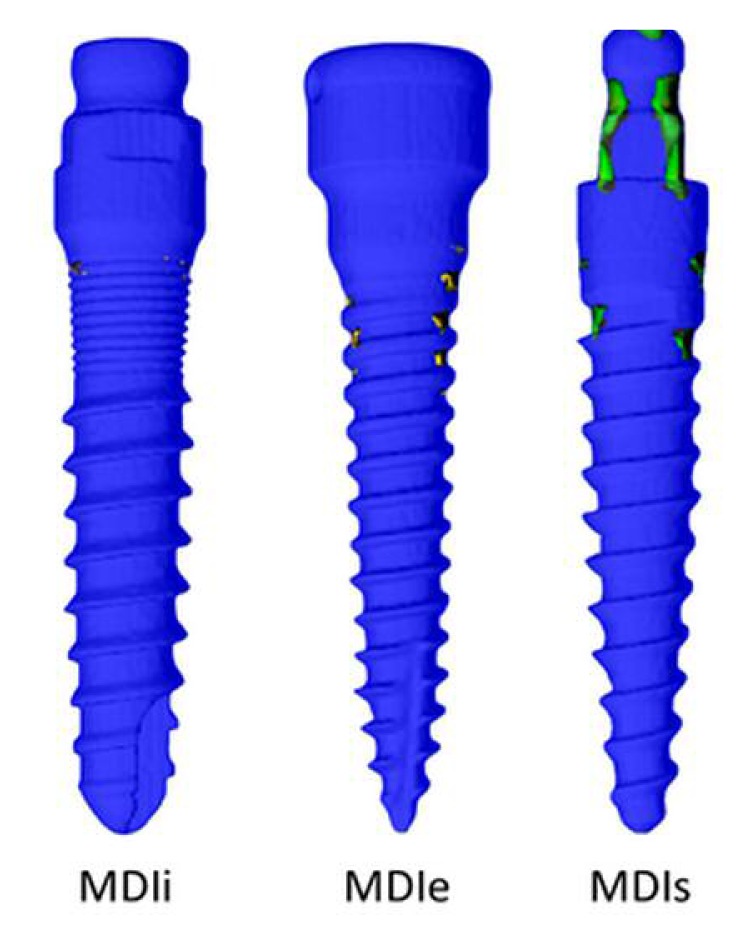
Locations where the Von Mises stress exceeds 250 MPa are indicated by the colored spots. The rest of the implant was made transparent.
Von Mises Stress > 250 MPa Load case 2(45°)
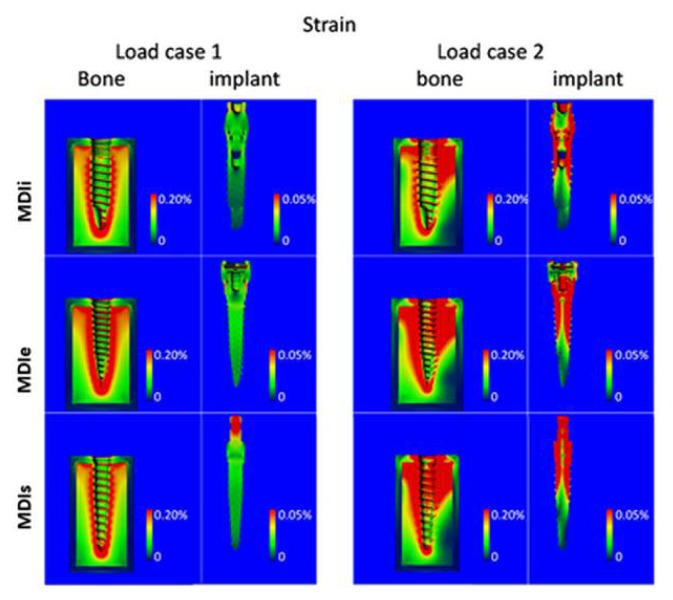
In contrast to the stress, the strains in the cancellous bone were greater than in the cortical bone (Figures 9, 10a, c). However, the distribution of the strains was also mainly in the peri-implant region. The strains occurring in the bone were no different among each implant-bone model. Considering strain in the implants, the highest equivalent strain was in the MDIs and the lowest strain was in the MDIi (Figures 10b, d).
Figure 9.
Contour plots of the equivalent strain in bone and in implant for load case 1 (left) and load case 2 (right).
Figure 10.
a) Average equivalent strain in bone for load case 1. b) Average equivalent strain in implant for load case 1. c) Average equivalent strain in bone for load case 2. d) Average equivalent strain in implant for load case 2.
Deformed plots
In Figure 11 the undeformed and the deformed configurations are shown for load case 1 and load case 2. Note that deformations were exagerated by a factor of 50. According to Figure 11, there was a dramatic difference in deformations between the two loading cases. Deformations were greater in load case 2 than in load case 1. In load case 1, there was no obvious deformation of the implant.
Figure 11.
Undeformed (left) and deformed configurations for load case 1 (middle) and load case 2 (right) for the different screw designs. Colors in the deformed configuration represent Von Mises stress where red indicates high and dark blue low stresses. Units were MPa. Deformations were exaggerated by a factor of 50.
The visible deformations were seen only in the bone. In load case 2 all implants were bent by the oblique force and the deformations in bone were more obvious.
Discussion
In cancellous and cortical bone, differences in stress and strain generated by the different implants were small. Varying the loading direction, however, results in much larger changes in the stresses. The 45° loading direction roughly doubled the average stresses and strains in cortical bone compared to the axial loading direction, although stresses and strains in cancellous bone remained almost unchanged. When looking at the absolute values in both load cases investigated, stresses in the cortical bone were well below (2–4 MPa) the values reported for cortical bone strength (100–150 MPa). For cancellous bone, the strength largely depends on the bone volume fraction (4). In cancellous bone, the stresses with a value of around 1 MPa are similar to values reported in general for hip implants and can be considered in the physiological range for cancellous bone.
The overall values of strain in bone did not much exceed 0.1%. Physiological strain values during rigorous activities in this study were around 0.3%. Therefore, strain values found around these implants were less than those expected for rigorous activities, but they might have been high enough to trigger a remodeling response. Frost et al. (17) described the mechanostat theory and bone remodelling related to stress and strain. Strains in the range of 50–1500 microstrain represented the physiological range (lazy zone). Strain in the range of 1500–3000 microstrain may cause apposition and strain less than 50 microstrain may cause bone resorption.
When comparing the stresses and strains in the implants, it is clear that average stresses and strains in MDIs were the greatest, followed by those in MDIe, and those in MDIi were the least. This may be explained by the slightly larger diameter of an MDli (2.75 mm.) than that of an MDIe (2.4 mm). According to the suggestion of Luigi et al. (5) the implant diameter might result in a greater effect on stress and strain than implant length. However, the maximum stress in the stem region for MDIe was the lowest for axial loading in this study. For the implants also, the loading direction plays an important role. The 45° loading direction resulted in bending of the implant (Figure 5) and caused an average stress and strain 2–4 times higher than that caused by axial loading. When looking at the maximum stress values found in implants, values in the range of 266 to 938 MPa were found for load case 2. In all cases, however, these highest stresses occurred in the implant collars and in the regions where the abutment would be placed. To avoid bending of an implant and the resultant bone resorption and other complications, the stresses in those regions should be reduced. Rieger et al. (18) reported that the serrated geometry of implant led to high stress concentration at the tips of bony ingrowths and near the necks of implants. When focusing on the stem region that is inside the bone, the Von Mises stress ranges from 259 to 373 MPa. Titanium Ti-6Al-4V (Grade 5) has a compressive yield strength of around 970 MPa and a fatigue strength of around 240 MPa. The maximum Von Mises stress, therefore, can exceed the fatigue strength of the implant.
A few limitations of the present study should be noted. First, the stress and strain calculations in the implants may have been inaccurate for the part of the implant into which the abutment was screwed, since contact between the abutment screw and the implant largely depended on the image settings. Although this can affect the stress/strain distribution in this region, it is not expected to affect the stress/strain distribution either in the screw part of the implant or in the bone. Second, boundary conditions were chosen to fully suppress the displacements at two faces of the model, suggesting that the bone segment is rigidly supported at both these ends. In reality, the support is not rigid and might differ at both ends. The deformations and strains found in this study, therefore, likely represent the low end of those that can be expected in vivo. Third, the full bonding of the implant to the bone is realistic only for implants with a coating to which the bone can attach (e.g. hydroxyapatite coating). In the bonded model, tensile forces can occur between the bone and implant which is not realistic for uncoated implants. Fourth, the bone was modeled as a homogeneous material, whereas in reality, it is not. Modeling the bone as a trabecular architecture might lead to different results. Although such analyses would be straight forward to perform in the same way as performed here, the results might largely depend on the actual bone microarchitecture that is modeled. Such microstructural analyses thus might require the analyses of a range of different microstructures to obtain reliable results.
The elasticity moduli of different implant materials also affect the stress that occurs at the bone-implant interface. It is recommended that the implant materials with too low modulus should be avoided (4). This stress concentration should be emphasized when using implants made from materials with low elasticity moduli. When using non-tapered, screw-type implants with low elasticity moduli, high stress concentrations occur at the neck of the implant model. On the other hand, high stress occurs at the base of implants made from materials with high elasticity moduli (4).
The long-term success of dental implant placement depends on the preservation of good bone quality, which depends on appropriate bone remodeling and on the avoidance of bone microfracture (19). In the crestal bone, where progressive bone loss is usually observed, the bone loss is possibly related to the low stress in the peri-implant region. Increased retention elements at the implant neck counteract the marginal bone resorption, according to Wolff’s law (17). However, too high interfacial shear stress leads to marginal bone loss as well. In the cortical bone, the quality and quantity of the surrounding bone affects the loading force that is transferred from the implant to the bone. Implant placement in high-density bone leads to less micromovement than in low-density bone, and reduces stress concentration. The stress concentration usually occurs around the implant neck. Due to the elastic limit of the cortical bone, high oblique loads may lead to microfractures and the subsequent healing may result in local fatigue failure and bone resorption at the neck of the implant. Clinically, the stress and strain distribution in bone of 3 implant design may not be different because the implant only retain the denture, but the tissue underneath the denture support the chewing load. Implant retained overdenture need implant for retention but posterior tissue for supporting. The occlusal force is mainly supported by posterior tissue (load bearing area) such as buccal shelf area and residual edentulous ridge. Overdentures are connected to mini dental implants by various attachment. Almost mini dental implants are single piece. The main problem of single piece implant is that transmucosal abutment cannot be changed when it is distorted. In this study, the head of MDIi and MDIe can be changed if they are worn. Occlusion for implant retained overdenture are bilateral balance, lingualization and monoplane (20). The occlusal force for mandibular implant retained overdenture at molar, canine and incisor are about 161N, 93N and 94N respectively (21). In the study, 3 mini dental implant designs were loaded under 100N related to clinical circumstance. In term of clinical application, using of two piece mini dental implant might be preferable treatment option because of changeable transmucosal abutment.
Conclusions
Within the limits of the study, the average stress and strain in the bone and implant models of the MDIi were similar to those in the other two mini dental implant designs. The oblique 45° load played an important role in the dramatically increased average stress and strain in all bone-implant models.
Acknowledgements
We would like to acknowledge B. van Rietbergen, Consultant at Scanco Medical AG, Switzerland, for the finite element analysis of the dental implants. We would like to express our sincere thanks to Prof. Peter A. Reichart, Professor Emeritus for Oral Surgery and Oral Medicine University of Berlin, Germany and Consultant to the Centre of Excellence for dental implantology, Faculty of Dentistry, and to Dr. M. Kevin O Carroll, Professor Emeritus of the University of Mississippi School of Dentistry, USA and Faculty Consultant at Faculty of Dentistry, Chiang Mai University, Thailand, for their advice on manuscript preparation.
References
- 1.Flanagan D, Mascolo A. The mini dental implant in fixed and removable prosthetics: A review. J Oral Implantol. 2011;27:123–32. doi: 10.1563/AAID-JOI-D-10-00052.1. [DOI] [PubMed] [Google Scholar]
- 2.Sagat G, Yalsin S, Gultekin BA, Mijiritsky E. Influence of arch shape and implant position on stress distribution around implants supporting fixed full-arch prosthesis in edentulous maxilla. Implant Dent. 2010;19:498–508. doi: 10.1097/ID.0b013e3181fa4267. [DOI] [PubMed] [Google Scholar]
- 3.Gultekin B, Gultekin P, Yalcin S. Application of finite element analysis in implant dentistry. Finite element analysis-New trends and Developments. 2012:21–54. [Google Scholar]
- 4.Geng J, Tan K, Liu G. Application of finite element analysis in implant dentistry: A review of the literature. J Prosthet Dent. 2001;85:585–598. doi: 10.1067/mpr.2001.115251. [DOI] [PubMed] [Google Scholar]
- 5.Luigi B, Ilaria C, Michele G, Franco M. The influence of implant diameter and length on stress distribution of osseointegrated implants related to crestal bone geometry: A three-dimensional finite element analysis. J Prosthet Dent. 2008;100:422–31. doi: 10.1016/S0022-3913(08)60259-0. [DOI] [PubMed] [Google Scholar]
- 6.Canullo L, Pace F, Coelho P, Sciubba E, Vozza I. The incluence of platform switching on the biomechanical aspects of the implant-abutment system. A three dimensional finite element study. Med Oral Patol Oral Cir Bucal. 2011;16:852–856. doi: 10.4317/medoral.17243. [DOI] [PubMed] [Google Scholar]
- 7.Bayraktar M. PhD Thesis. Istanbul University, Institute of Health Science, Department of Prosthetic Dentistry; 2011. The influence of crown-implant ratio and dental implant parameters on implant and periim-plant bone: A finite element analysis. [Google Scholar]
- 8.Barbier L, Vander J, Krzesinski G, Schepers E, Van der Perre G. Finite element analysis of non-axial versus axial loading of oral impalnts in the mandible of the dog. J Oral Rehabil. 1998;25:847–858. doi: 10.1046/j.1365-2842.1998.00318.x. [DOI] [PubMed] [Google Scholar]
- 9.Meyer U, Vollmer D, Runte C, Bourauel C, Joos U. Bone loading pattern around implants in average and atrophic edentulous maxillae: a finite-element analysis. J Craniomaxillofac Surg. 2001;29:100–105. doi: 10.1054/jcms.2001.0198. [DOI] [PubMed] [Google Scholar]
- 10.Holmes DC, Loftus JT. Influence of bone quality on stress distribution for endosseous implants. J Oral Implantol. 1997;23:104–111. [PubMed] [Google Scholar]
- 11.Tada S, Stegaroiu R, Kitamura E, Miyakawa O, Kusakari H. Influence of implant design and bone quality on stress/strain distribution in bone around implants: a 3-dimensional finite element analysis. Int J Oral Maxillofac Implants. 2003;18:357–368. [PubMed] [Google Scholar]
- 12.Hasan I, Heinemann F, Ailahrach M, Bourauel C. Biomechanical finite element analysis of small diameter and short dental implant. Biomed Tech. 2010;55:341–350. doi: 10.1515/BMT.2010.049. [DOI] [PubMed] [Google Scholar]
- 13.Ma Xuanxianz LT. Single implant prosthesis. In: Lianping Geng., editor. Newly developed technology of prosthetic dentistry in China in 1990s. Chengdu: Sichuang Science and Technology Publishing House; 1998. pp. 1–20. [Google Scholar]
- 14.Clift SE, Fisher J, Watson CJ. Finite element stress and strain analysis of the bone surrounding a dental implant: effect of variations in bone modulus. Proc Inst Mech Eng. 1992;206:233–241. doi: 10.1243/PIME_PROC_1992_206_295_02. [DOI] [PubMed] [Google Scholar]
- 15.Geng J, Liu H. Exceptional prosthodontics. Hong Kong Tranfer Publishing Co Ltd. 1999:60–76. [Google Scholar]
- 16.Holmgren ET, Seckinger RJ, Kilgren LM, Mante F. Evaluating parameters of osseointegrated dental implants using finite element analysis: a two-dimensional comparative study examining the effects of implant diameter, implant shape, and load direction. J Oral Implantol. 1998;24:80–88. doi: 10.1563/1548-1336(1998)024<0080:EPOODI>2.3.CO;2. [DOI] [PubMed] [Google Scholar]
- 17.Frost HM. A 2003 update of bone physiology and Wolff’s Law for clinicians. Angle Orthod. 2004;74:3–15. doi: 10.1043/0003-3219(2004)074<0003:AUOBPA>2.0.CO;2. [DOI] [PubMed] [Google Scholar]
- 18.Rieger R, Fareed K, Adams K, Tanquist A. Bone stress distribution for three endosseous implants. J Prosthet Dent. 1989;61:223–228. doi: 10.1016/0022-3913(89)90379-x. [DOI] [PubMed] [Google Scholar]
- 19.Misch CE. Contemporary implant dentistry. 3rd ed. Elsevier Mosby; 2008. pp. 68–88.pp. 544–546. [Google Scholar]
- 20.Kim Y, Oh TJ, Misch CE, Wang HL. Occlusal considerations in implant therapy: clinical guidelines with biomechanical rationale. Clin Oral Implants Res. 2005;16:26–35. doi: 10.1111/j.1600-0501.2004.01067.x. [DOI] [PubMed] [Google Scholar]
- 21.Kaul AS, Deepak G. Bite force comparison of implant-retained mandibular overdentures with conventional complete dentures: an in vivo study. IJOICR. 2011;2(3):140–144. [Google Scholar]


