ABSTRACT
Adipocyte cell culture is an important tool for mechanistic studies of energy metabolism. Many factors affect the differentiation of adipocytes in culture. Oil red O staining can be used to assess the degree of differentiation. However, the validity of this method for quantitative analysis has not yet been established. Here we show that a protocol with arbitrarily chosen parameters does not measure in the linear range and is not suitable for quantitative analysis (R2 = 0.077, p = 0.382), and develop and validate an optimized protocol for quantitative oil red O staining of cultured adipocytes. 3T3-L1 preadipocytes and adipocytes are fixed with 4% formaldehyde and stained with 0.2% oil red O solution in 40% 2-propanol for 30 minutes. Dye is eluted with 2-propanol, and absorption of the eluate is measured photometrically at 510 nm. This optimized protocol achieves excellent correlation between defined amounts of differentiated adipocytes on constant-size culture plates and photometric absorption (R2 = 0.972, p = 6.585E-14). The performance of the method is independent of the culture plates used. Thus, the optimized oil red O staining protocol can be universally employed to quantitatively assess adipocyte differentiation.
KEYWORDS: adipocytes, cells and tissues, insulin resistance, lipids, obesity, triglycerides, metabolic disease, methods
Introduction
Adipose tissue is a pivotal component of the maintenance of energy homeostasis. Malfunctioning adipose tissue causes metabolic disease, and disturbed metabolism can directly affect adipose tissue. Adipocyte cell culture has proven indispensable for the study of the cellular pathophysiology of energy metabolism. 3T3-L1 is one of the most commonly used adipocyte cell lines. 3T3-L1 preadipocytes lend themselves very well to the study of adipogenesis. Their degree of differentiation is highly dependent on culture conditions including hormonal supplements, timing of induction, passage number, and even on the person(s) involved with the cell culture.
Oil red O is a dye that strongly stains lipids.1 It is inexpensive and nonhazardous, and staining can be performed within a few hours. Oil red O has been used to discern preadipocytes from adipocytes, i.e. qualitative analysis, for more than 40 years.2-4 Recently, oil red O staining is also being used for quantitative analysis of adipocyte differentiation5-15 (Table 1). To enable quantitative measurements, the dye is commonly eluted from the cells using 2-propanol, and absorbance is photometrically determined at or near the absorbance maximum of oil red O, 518 nm. However, the published protocols differ in many details, and almost no data has been reported on the performances of the assays, putting the validity of this method at question.
Table 1.
Synopsis of published protocols for quantitative oil red O staining of adipocytesa This table lists individual protocols for quantitative oil red O staining with as much detail as published, in chronological order of publication. A dash signifies that no information was given, which may indicate that a certain step was either not performed, or performed according to the base protocol, or performed differently but not reported. Protocols cited in the ‘based on’ column that are not explicitly listed are not quantitative protocols 24 or use a stain other than oil red O 25.
| First author, year | Based on | Wash | Fixate | Wash | Stain | Wash | Dry | Elute | Measure |
|---|---|---|---|---|---|---|---|---|---|
| Ramirez-Zacarias 1992 5 | 26 | — | 1 h RT 10% FA | water | 2 h RT 0.2% in 57% 2-prop | exhaustively | 32°C | 1 ml 2-prop | 510 nm |
| Bennett 2002 6 | 24 | — | — | — | — | — | — | 15 min 4% Igepalb | 520 nm |
| Janderova 2003 7 | 5 | — | 1 h RT 10% FA | 60% 2-prop | 10 min u/c in 60% 2-prop | water, repeatedly | — | 15 min 2-prop | 500 nm |
| Yang 2007 8 | — | 2x PBS | 1 h RT 10% FA | — | 1 h RT 0.6% in 60% 2-prop | 3x 60% 2-prop | — | 4% NP-40 in 2-prop | 490 nm |
| Mäuser 2007 9 | — | — | 15 min FA | — | 1 h 0.25% in 60% 2-prop | water, several times | — | 2-prop | 500 nm |
| Arsenescu 2008 10 | 5,25 | 1x PBS | 5 min RT 10% FA | — | 30 min 0.3% in 60% 2-prop | 2-prop | 510 nm | ||
| Rossmeislova 2013 11 | 7 | — | — | — | — | — | — | — | — |
| Wang 2015 12 | — | PBS | 30 min 4% FA | — | 20 min 0.3% | — | — | 2-prop | 518 nm |
| Cheung 2015 13 | — | — | — | — | — | — | — | 2-prop | 580 nm (sic) |
| Koc 2015 14 | 11 | — | — | — | — | — | — | — | — |
| Kim 2015 15 | —c | PBS | 1 h RT 10% FA | 2-prop | 2 h proprietary solutionc | — | — | 100% 2-prop | 520 nm |
| Mori 2016 18 | — | 2x PBS | 1 h RT 3.7% FA | — | 0.6% in 60% 2-prop | — | — | n/a | aread |
| Arbitrary protocol (Fig. 1) | 1x PBS | 15 min 4% FA | — | 60 min 0.3% in 40% 2-prop | water, 5 times | — | 10 min 100% 2-prop | 510 nm | |
| This protocol | 5 | 1x PBS | 15 min 4% FA | — | 30 min 0.132 ml/cm2 0.2% in 40% 2-prop | water, 5 times | — | 0.263 ml/cm2 100% 2-prop | 510 nm |
Note.
Abbreviations used in this table: 2-prop, 2-propanol; conc., concentration; FA, formaldehyde; n/a, not applicable; PBS, phosphate-buffered saline; RT, room temperature; u/c, unspecified concentration
4% Igepal CA-630 in 2-propanol
No academic article was cited, but a commercially available assay kit from Cayman Chemical; the actual protocol described in the article deviates substantially from the instructions provided by the manufacturer.
In this protocol, quantitative data was obtained by analyzing the percentage of stained area in microphotographs.
To overcome this limitation, we developed and validated a quantitative staining protocol for cultured adipocytes that we report here.
Results
Performance of quantitative oil red O staining with arbitrary parameters
Published protocols for quantitative oil red O staining differ in concentrations, volumes, and durations, even though many of these protocols refer to the same original protocol that was published in 19925 (Table 1). To assess the validity of quantitative oil red O staining, we initially chose arbitrary parameters that roughly represent the average of the published protocols. Because it is not feasible to reliably control the number of fat cells experimentally by adjusting the culture protocol, we decided to first grow the cells to full confluence and let them differentiate, and then scrape off the cells of defined areas of the culture plates. Staining the remaining cells on the plate wells with 0.3% oil red O for 60 minutes followed by elution with 1 ml/well 2-propanol yielded dark-red eluates that could not be distinguished by visual inspection and produced absorbance measurements near the upper end of the dynamic range of the photometer (0–3.2 O.D.) (Fig. 1). The absorbances did not discriminate at all between varying amounts of differentiated adipocytes per well (R2 = 0.077, p = 0.382 by linear regression; Fig. 1).
Figure 1.
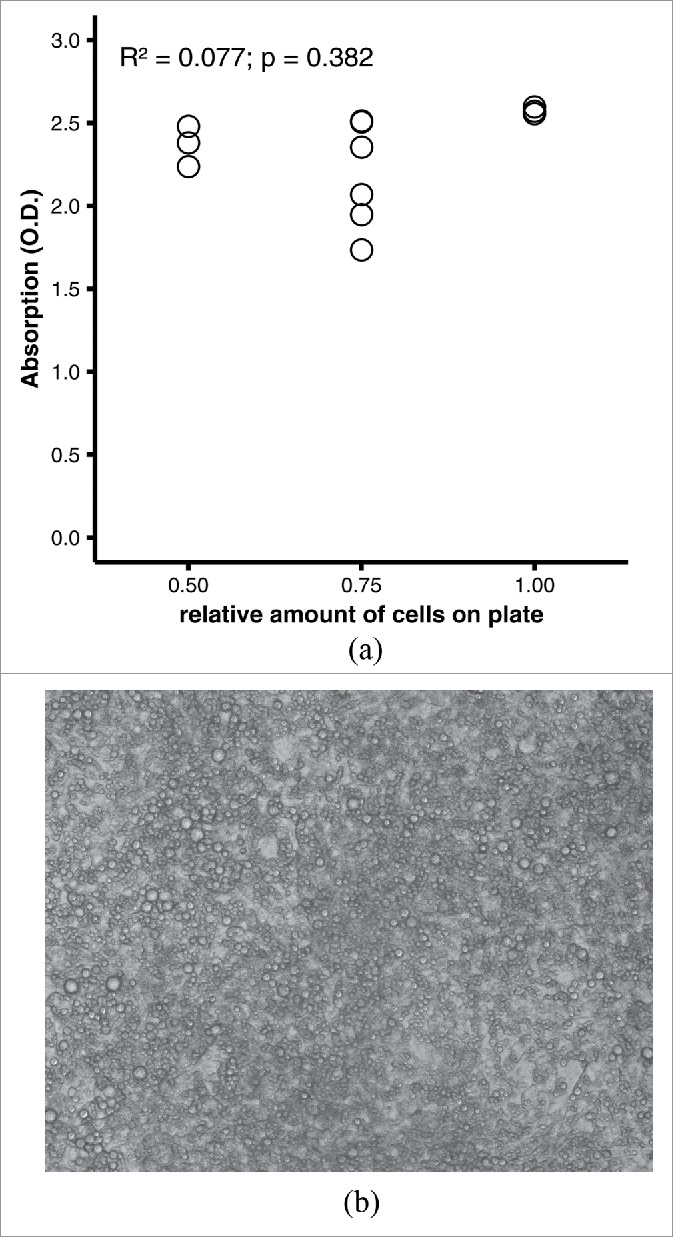
(A) Performance of quantitative oil red O staining with arbitrary parameters. 3T3-L1 adipocytes were fixed on a 12-well plate in 4% formaldehyde and stained with 0.3% oil red O in 40% 2-propanol for 60 min at room temperature. After washing, dye was eluted with 1 ml/well of 100% 2-propanol for 10 min at room temperature; 200 µl of eluate from each well were transferred to a microtiter plate. Scatter plot of photometric absorption vs. relative amount of cells. R2 = 0.077, p = 0.382 by linear regression. (B) Representative microphotograph of differentiated adipocytes. The picture was taken with a Zeiss AxioCam MRm at 20x lens magnification and was not digitally post-processed by the authors.
Performance of quantitative oil red O staining with the original protocol
We next assessed whether the original protocol produces valid measurements if performed exactly as published.5 The measurements obtained using this protocol were non-linear with saturation apparent above 50% of differentiated cells on the plate (Fig. 2). Best fit was achieved with a 2-degree polynomial curve (R2 = 0.953, p = 1.179e-10). Importantly, when the elution was carried out as described5 by adding and immediately removing 2-propanol from the wells by gentle pipetting, not all of the stain was eluted.
Figure 2.
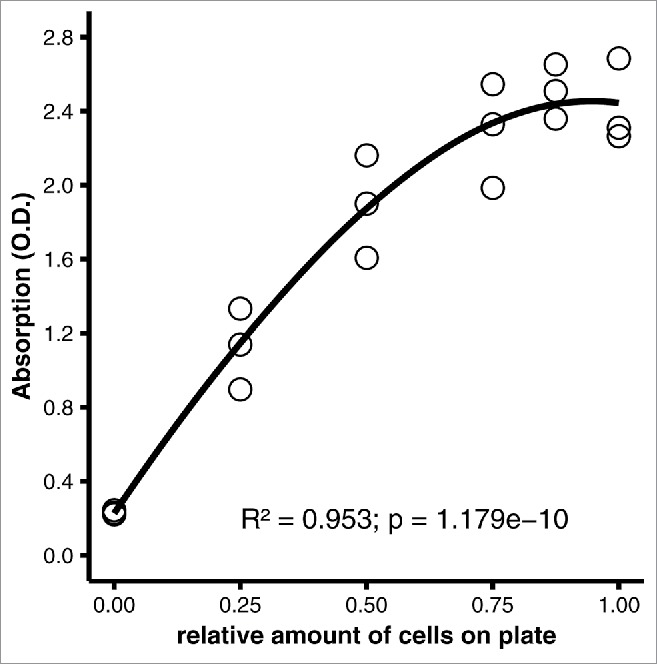
Performance of the original protocol, carried out as published.5 3T3-L1 adipocytes were fixed on a 6-well plate (35 mm well diameter) in 10% formaldehyde for 1 hour and stained with 0.2% oil red O in 57% 2-propanol for 2 hours at room temperature. After washing, plates were dried at 32°C as needed, and dye was eluted with 1 ml/well of 100% 2-propanol, which was removed immediately by gentle pipetting. 200 µl of eluate from each well were transferred to a microtiter plate. Scatter plot of photometric absorption vs. relative amount of cells. R2 = 0.953, p = 1.179e-10 by linear regression with second-order polynomial regression (optimum fit).
Validation of experimental approach
Scraping off the cells of a culture dish is of course a highly artificial procedure that may not be a valid surrogate for having undifferentiated cells in addition to differentiated adipocytes on one culture plate. To assess whether the removal of defined amounts of differentiated cells from a plate is a valid simulation of various amounts of undifferentiated (pre-)adipocytes, we compared a culture plate that had never been exposed to cells with one that had a fully confluent monolayer of (undifferentiated) preadipocytes entirely scraped off (A). On the cell-naïve plate, oil red O formed small precipitates that could not be washed off and yielded an eluate with significantly higher absorption than the eluate from the plate from which all cells had been removed (p = 0.001, Fig. 3A). When the ratio of area with preadipocytes to area with cells removed was varied experimentally, the absorbances undulated around 0.2 O.D. (Fig. 3B). Except for the plate with all cells scraped off, the ratio of areas did not influence the absorbance. The absorbances obtained from plates with varying amounts of cells removed were significantly lower than the absorbance obtained from the cell-naïve plate. On the other hand, increasing amounts of undifferentiated cells on a plate did not affect absorbance. Thus, scraping off the cells is a valid simulation of undifferentiated fat cells, and a culture plate with all cells scraped off serves as a negative control, while a culture plate that is fully covered by differentiated adipocytes is the positive control.
Figure 3.
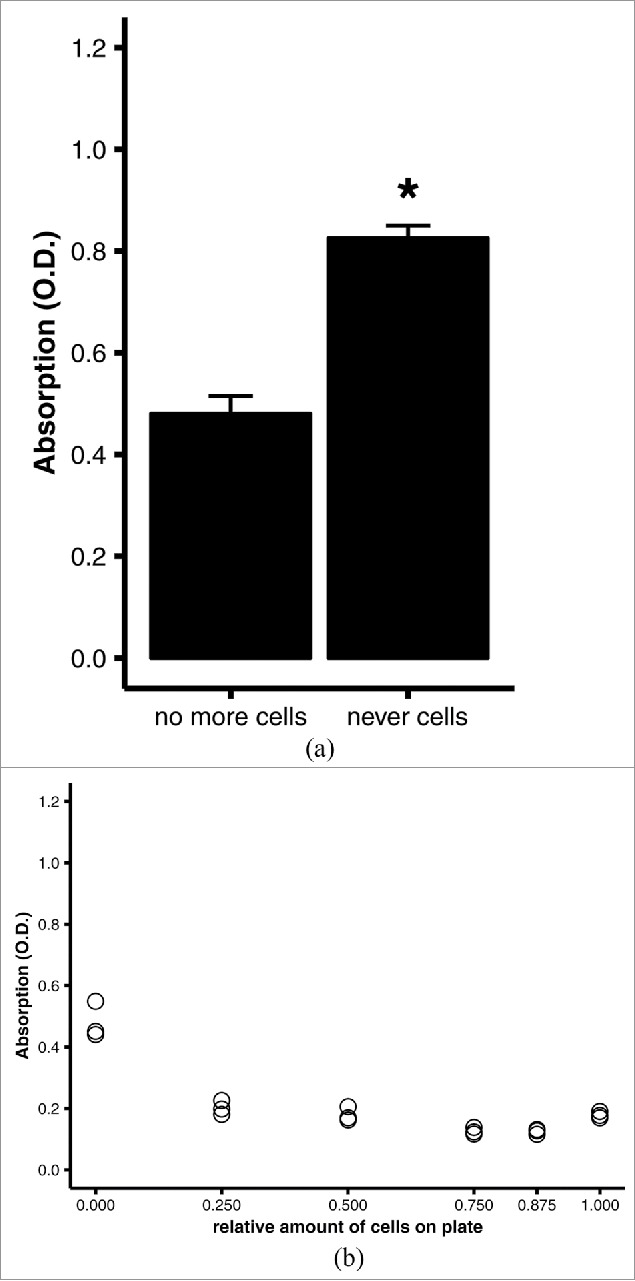
Quantitative oil red O staining of (undifferentiated) preadipocytes. 3T3-L1 preadipocytes were grown to confluence on 6-well plates, then stained using the optimized protocol (see Materials and Methods). (A) Comparison of quantitative staining of a well that was stained after all preadipocytes were scraped off (no more cells) and a well of a blank, cell-naïve polystyrene plate (never cells). Averages and standard errors of n = 3 replicates of a representative experiment. *, p = 0.001 by Student's t test. (B) Linear regression analysis of quantitative staining of varying amounts of cells in a well. All wells were initially covered with a confluent monolayer of preadipocytes; the amount of cells was varied experimentally by scraping off the cells. Efficacy of scraping was verified under the microscope.
Performance of quantitative oil red O staining with optimized parameters
To optimize the staining protocol, measurements were performed with fully differentiated adipocytes with different oil red O concentrations (0.03–0.3%), duration of staining (0.5–1.5 hours), and eluate volumes used for photometry (50–200 µl). Best linearity and the widest range of absorptions (0.2–1.0) were achieved with 0.2% oil red O, a staining duration of 30 min, and 200 µl eluate (R2 = 0.972, p = 6.585e-14; Fig. 4A). Again, culture plates that had never had contact with a cell monolayer yielded a much higher absorbance than plates with all cells scraped off (Fig. 4B), supporting the validity of the scraping method. The initial fixation with formaldehyde did not affect the assay performance. As long as fixation was performed at all, the formaldehyde concentration, duration of fixation, and number of washes had no influence on the slopes of the regression lines or measured absorptions (not shown).
Figure 4.
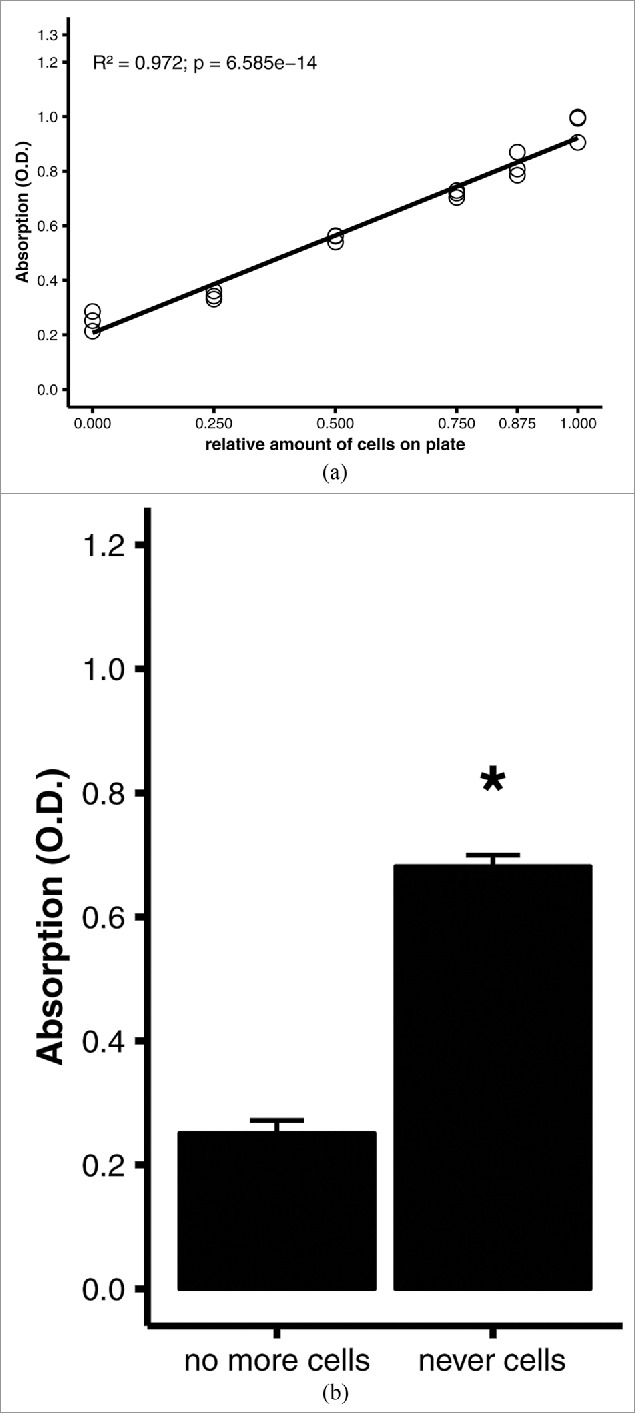
Quantitative oil red O staining of differentiated adipocytes. 3T3-L1 adipocytes were differentiated on 6-well plates, then stained using the optimized protocol (see Materials and Methods). (A) Linear regression analysis of quantitative staining of varying amounts of cells in a well. All wells were initially covered with a confluent monolayer of preadipocytes; the amount of cells was varied experimentally by scraping off the cells. Efficacy of scraping was verified under the microscope. (B) Comparison of quantitative staining of a well that was stained after all adipocytes were scraped off (no more cells) and a well of a blank, cell-naïve polystyrene plate (never cells). Averages and standard errors of n = 3 replicates of a representative experiment. *, p = 0.001 by Student's t test.
Applicability of the optimized protocol to different plate formats
The optimized protocol was developed with 12-well plates. We tested the applicability of the protocol for other plate formats by adjusting the volumes of oil red O working solution and eluant to the 2.5-fold greater surface area of a well on a 6-well plate, compared with a 12-well plate; we did not expect the volume of fixative to be a determining factor, and washing was performed with abundant volumes regardless of the plate format used. With 2.5-fold higher volumes of oil red O working solution and 2-propanol eluant, the measurements were similar to the measurements obtained with the 12-well plate (R2 = 0.982, p = 1.148e-20, Fig. 5).
Figure 5.
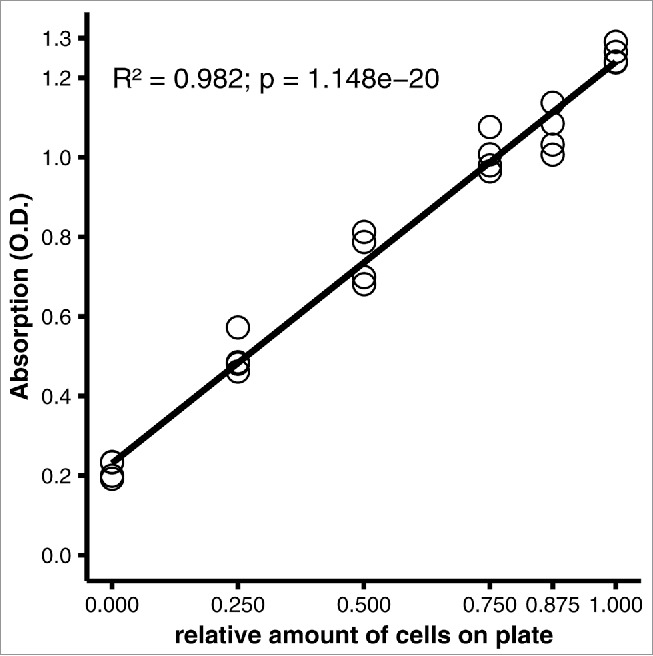
Applicability of the staining protocol to a different culture plate format. 3T3-L1 adipocytes were differentiated on 12-well plates, then stained using the optimized protocol (see Materials and Methods). Linear regression analysis of quantitative staining of varying amounts of cells in a well. All wells were initially covered with a confluent monolayer of preadipocytes; the amount of cells was varied experimentally by scraping off the cells. Efficacy of scraping was verified under the microscope.
Discussion
Oil red O staining distinguishes adipocytes from other cells and has recently been used as a quantitative method to assess differences in the degree of adipocyte differentiation in cell culture. However, there is considerable variation among the published protocols, and the validity of the method has never been confirmed and published. We here present a quantitative staining protocol that produces valid, reproducible measurements and can be applied to different culture plate formats.
The quantitative method that involves eluting the red dye from the cells and subjecting it to absorbance measurements was first described by Kuri-Harcuch and colleagues.5 All but one14 of the subsequently published protocols deviate explicitly from the original protocol (Table 1). While one article mentions the use of an oil red O standard curve,11 data on the validity, linearity, and dynamic range of the method has never been made public so far. In their seminal paper, Kuri-Harcuch and colleagues demonstrate the kinetics of the stain and adjust the timing to make sure that all cells are stained, but they do not report whether the volumes and concentrations used had been optimized as well. Using the original protocol, measurements are not linear if a culture plate contains more than 50% differentiated adipocytes (Fig. 2). Most absorbances obtained with this protocol lie above 1.0, with some measurements in the range of 2.0 to 2.4. It should be noted that absorbance (O.D.) is defined as the decadic logarithm of the ratio of light emitted from the photometer to light transmitted by the eluate; if no light is transmitted, absorbance is infinite. Consequentially, O.D. values greater than ∼1.5 indicate sub-maximum absorption (101.5 ≈100/3 ≈3.3% light transmitted) and are affected by an exponentially increasing error.16 An O.D. range of 1.0 to 2.4 corresponds to only 10% to 0.4% of light transmitted. Thus, it is not desirable to use the entire dynamic range of the photometer (0–3.2 O.D.). Our optimized protocol produces absorbances in the range of 0.2 to 1.2 irrespective of the culture plate format, which corresponds to 63% to 6.3% of light transmitted.
It is unknown why most published protocols deviate from the original protocol despite referencing it. Our data clearly show that arbitrary deviation from the original protocol invalidates the assay (Fig. 1).
Besides linearity and reliability, steepness of slope is one of the performance markers of a biological/biochemical assay.17 Steepness of slope may be assessed by performing linear regression analyses and examining the p value.17 The protocol with arbitrary parameters entails a non-significant p value on linear regression, rendering it inappropriate for quantitative measurements (Fig. 1). On the other hand, linear regression of the data obtained using our optimized protocol produces extremely small p values regardless of the culture plate format used (Figs. 4, 5).
During optimization, we adjusted all but one of the parameters in the protocol. Eluant volume was not formally optimized. However, the dye was completely eluted from the cells, indicating that the eluant was abundant. Our protocol yielded absorbances in the optimum range of 0.2 to 1.2. As discussed above, absorbances higher than 1.5 correspond to more than 97% extinction and are affected by increasing error.16 Thus, decreasing the eluant volume in order to further increase eluate dye concentration and absorbance is not desirable.
The most common application of quantitative oil red O staining is to assess the capacity of cultured preadipocytes to differentiate under different experimental conditions. Our protocol has a wide dynamic range and produces linear results from no differentiated cells on a culture plate to a plate fully covered with adipocytes. Therefore, it is suitable for a wide array of scientific questions, allowing for assessment of differentiation even at very early stages. Another potential application is to correct experimental data for differences in differentiation between culture plates within one experiment or between experiments that may otherwise confound the interpretation of data. To accomplish this, experimental data is divided by the absorbance of the eluate to account for differences in differentiation. It should be noted however that the absorbances must first be normalized to the lowest absorbance measured, because absorbances below 1 would produce incorrect results when used as a denominator.
There are other ways to quantitatively assess the degree of differentiation of adipocytes. Nakao and colleagues18 combined oil red O staining with image analysis. While this method avoids the pitfall of over-saturation, care must be taken to distinguish stained adipocytes from unstained adipocytes, and intermediate states may be difficult to adjudicate. In addition, image analysis requires more hands-on work to first obtain the images and then to analyze them. Similar to the photometric assay, the image-analysis approach produces summary data for an entire culture plate, but does not allow to draw conclusions with regard to individual cells. An alternative method that does not have this limitation is flow cytometry,19,20 which permits analysis at the level of individual cells. This can be useful if other information is collected simultaneously. Flow cytometry requires a much more sophisticated instrument that may not be available in many labs, unlike a photometric plate reader.
Taken together, the optimized oil red O protocol described here allows for fast, reliable, and valid assessment of the degree of differentiation of cultured adipocytes.
Materials and methods
Cell culture
3T3-L1 preadipocytes were obtained from the American Type Culture Collection via LGC Standards. All cells were grown on standard tissue culture-treated polystyrene culture plates (Corning, Berlin, Germany); the surfaces of these plates have been physically modified by corona discharge to facilitate cell binding.21 Preadipocytes were kept at 37°C with 5% CO2 in DMEM with 4.5 g/l glucose and 110 mg/l sodium pyruvate (Fisher Scientific), supplemented with 10% bovine calf serum (Fisher Scientific). Cultures were passaged every 2-3 days, when 80% confluence was reached. For differentiation, preadipocytes were seeded on 6-well (9.5 cm2/well, Corning #3506) or 12-well plates (3.8 cm2/well, Corning #3512), and kept in normal growth medium. Four days after confluence, differentiation was induced by replacing the growth medium with differentiating medium (DMEM, 10% FBS [Fisher Scientific], 1 µmol/l insulin) supplemented with 100 nmol/l dexamethasone, 1 µmol/l rosiglitazone, 500 µmol/l isobutylmethylxanthine, and 250 µmol/l indomethacine. After two days, this induction medium was replaced with differentiating medium, which was renewed every 2 days thereafter. Experiments were performed at least 10 days after the induction.
Simulation of various ratios of undifferentiated to differentiated cells
To simulate varying degrees of differentiation, i.e., the ratio of undifferentiated preadipocytes to differentiated adipocytes, culture wells were marked underneath with a permanent marker to delineate 25%, 50%, 75%, 87.5%, or 100% of the well area. Cells were then carefully scraped off the designated area, and complete removal of cells was verified microscopically. Staining was always performed on the cells that remained in the plates.
Oil red O stock and working solutions
Oil red O powder was obtained from Sigma-Aldrich (O0625). A stock solution was prepared by dissolving 0.2 g in 40 ml 2-propanol (0.5% w/v). This stock solution was stored at room temperature. The working solution was obtained by diluting the stock solution 2:3 with distilled water, yielding a concentration of 0.2% oil red O in 40% 2-propanol. The working solution was prepared freshly for each experiment and filtered once immediately before use.
Optimized oil red O protocol
After removing the supernatant from the culture plates, cells were washed once with phosphate-buffered saline (PBS) and fixed with 4% formaldehyde in PBS for 15 min at room temperature. The formalin was removed, and oil red O working solution was filled into the culture plates to safely cover the plate bottom (0.132 ml/cm2, i.e. 0.5 ml per well for 12-well plates, 1.25 ml per well for 6-well plates). The plates were incubated at room temperature for 30 min. They were then washed 5 times with distilled water. To elute the dye, 100% 2-propanol was added to the plates (0.263 ml/cm2, i.e., 1 ml per well for 12-well plates, 2.5 ml per well for 6-well plates). The plates were incubated for 10 min at room temperature on an orbital shaker. 2x 200 µl of eluate were transferred to a clear 96-well microtiter plate (polystyrene); a duplicate of wells on the microtiter plate was filled with 2x 200 µl 2-propanol. Absorption was measured in duplicate at 510 nm on an Asys UVM340 microtiter plate reader with a dynamic range of 0.000 O.D. to 3.200 O.D. (Biochrom, Cambridge, UK).
Statistical analysis
Statistical significance was tested by linear regression and Student's t test as indicated. Analyses were performed with Microsoft Excel with Daniel's XL Toolbox add-in22 and figures were produced with R with the ggplot2 package.23
Abbreviations
- 2-prop
2-propanol
- conc
concentration
- FA
formaldehyde
- n/a
not applicable
- O.D.
optical density
- PFA
paraformaldehyde
- RT
room temperature
- u/c
unspecified concentration
Disclosure of potential conflicts of interest
No potential conflicts of interest were disclosed.
Acknowledgments
The authors are indebted to Anja Sauer and Maria Scheurich for excellent technical assistance.
Funding
This work was funded in part by grants of the Deutsche Forschungsgemeinschaft (DFG) to D.K. and by institutional funds. This work is part of the doctoral thesis of N.K.
ORCID
Daniel Kraus http://orcid.org/0000-0002-6351-3706
References
- [1].Lillie RD, Ashburn LL. Supersaturated solutions of fat stains in dilute isopropanol for demonstration of acute fatty degeneration not shown by Herxheimer's technique. Arch Pathol 1943 [Google Scholar]
- [2].Green H, Kehinde O. Sublines of mouse 3T3 cells that accumulate lipid. Cell 1974; 1:113-6; http://dx.doi.org/ 10.1016/0092-8674(74)90126-3 [DOI] [Google Scholar]
- [3].Green H, Kehinde O. An established preadipose cell line and its differentiation in culture II. Factors affecting the adipose conversion. Cell 1975; 5:19-27; PMID:165899; http://dx.doi.org/ 10.1016/0092-8674(75)90087-2 [DOI] [PubMed] [Google Scholar]
- [4].Kuri-Harcuch W, Green H. Adipose conversion of 3T3 cells depends on a serum factor. Proc Natl Acad Sci U S A 1978; 75:6107-9; PMID:282628; http://dx.doi.org/ 10.1073/pnas.75.12.6107 [DOI] [PMC free article] [PubMed] [Google Scholar]
- [5].Ramírez-Zacarías JL, Castro-Muñozledo F, Kuri-Harcuch W. Quantitation of adipose conversion and triglycerides by staining intracytoplasmic lipids with Oil red O. Histochemistry 1992; 97:493-7; http://dx.doi.org/ 10.1007/BF00316069 [DOI] [PubMed] [Google Scholar]
- [6].Bennett CN, Ross SE, Longo KA, Bajnok L, Hemati N, Johnson KW, Harrison SD, MacDougald OA. Regulation of Wnt signaling during adipogenesis. J Biol Chem 2002; 277:30998-1004; PMID:12055200; http://dx.doi.org/ 10.1074/jbc.M204527200 [DOI] [PubMed] [Google Scholar]
- [7].Janderová L, McNeil M, Murrell AN, Mynatt RL, Smith SR. Human mesenchymal stem cells as an in vitro model for human adipogenesis. Obes Res 2003; 11:65-74; http://dx.doi.org/ 10.1038/oby.2003.11 [DOI] [PubMed] [Google Scholar]
- [8].Yang Y, Shang W, Zhou L, Jiang B, Jin H, Chen M. Emodin with PPARgamma ligand-binding activity promotes adipocyte differentiation and increases glucose uptake in 3T3-Ll cells. Biochem Biophys Res Commun 2007; 353:225-30; PMID:17174269; http://dx.doi.org/ 10.1016/j.bbrc.2006.11.134 [DOI] [PubMed] [Google Scholar]
- [9].Mäuser W, Perwitz N, Meier B, Fasshauer M, Klein J. Direct adipotropic actions of atorvastatin: differentiation state-dependent induction of apoptosis, modulation of endocrine function, and inhibition of glucose uptake. Eur J Pharmacol 2007; 564:37-46; http://dx.doi.org/ 10.1016/j.ejphar.2007.02.024 [DOI] [PubMed] [Google Scholar]
- [10].Arsenescu V, Arsenescu RI, King V, Swanson H, Cassis LA. Polychlorinated biphenyl-77 induces adipocyte differentiation and proinflammatory adipokines and promotes obesity and atherosclerosis. Environ Health Perspect 2008; 116:761-8; PMID:18560532; http://dx.doi.org/ 10.1289/ehp.10554 [DOI] [PMC free article] [PubMed] [Google Scholar]
- [11].Rossmeislová L, Mališová L, Kračmerová J, Tencerová M, Kováčová Z, Koc M, Šiklová-Vítková M, Viquerie N, Langin D, Štich V. Weight Loss Improves the Adipogenic Capacity of Human Preadipocytes and Modulates Their Secretory Profile. Diabetes 2013; 62:1990-5; http://dx.doi.org/ 10.2337/db12-0986 [DOI] [PMC free article] [PubMed] [Google Scholar]
- [12].Wang W, Zhang Y, Lu W, Liu K. Mitochondrial Reactive Oxygen Species Regulate Adipocyte Differentiation of Mesenchymal Stem Cells in Hematopoietic Stress Induced by Arabinosylcytosine. PLoS ONE 2015; 10:e0120629; PMID:25768922; http://dx.doi.org/ 10.1371/journal.pone.0120629 [DOI] [PMC free article] [PubMed] [Google Scholar]
- [13].Cheung SY, Huang Y, Kwan HY, Chung HY, Yao X. Activation of Transient Receptor Potential Vanilloid 3 Channel Suppresses Adipogenesis. Endocrinology 2015; 156:2074-86; PMID:25774551; http://dx.doi.org/ 10.1210/en.2014-1831 [DOI] [PubMed] [Google Scholar]
- [14].Koc M, Mayerová V, Kračmerová J, Mairal A, Mališová L, Štich V, Langin D, Rossmeislová L. Stress of endoplasmic reticulum modulates differentiation and lipogenesis of human adipocytes. Biochem Biophys Res Commun 2015; 460:684-90; PMID:25813485; http://dx.doi.org/ 10.1016/j.bbrc.2015.03.090 [DOI] [PubMed] [Google Scholar]
- [15].Kim GY, Jeong HH, Yeom SJ, Lee CS, Roh C. Efficient and reliable screening of anti-obesity agents on a micro cell pattern chip. J Chem Technol Biotechnol 2015; :n/a-n/a. [Google Scholar]
- [16].Youmans HL, Brown VH. Selection of optimum ranges for photometric analysis. Anal Chem 1976; 48:1152-5; http://dx.doi.org/ 10.1021/ac50002a022 [DOI] [Google Scholar]
- [17].The United States Pharmacopeial Convention <1032> Design and development of biological assays In: General Information. Rockville, MD: The United States Pharmacopeial Convention; 2015. page 769-86 [Google Scholar]
- [18].Mori E, Fujikura J, Noguchi M, Nakao K, Matsubara M, Sone M, Taura D, Kusakabe T, Ebihara K, Tanaka T, et al.. Impaired adipogenic capacity in induced pluripotent stem cells from lipodystrophic patients with BSCL2 mutations. Metabolism 2016; 65:543-56; PMID:26975546; http://dx.doi.org/ 10.1016/j.metabol.2015.12.015 [DOI] [PubMed] [Google Scholar]
- [19].Lee YH, Chen SY, Wiesner RJ, Huang YF. Simple flow cytometric method used to assess lipid accumulation in fat cells. J Lipid Res 2004; 45:1162-7; PMID:14993237; http://dx.doi.org/ 10.1194/jlr.D300028-JLR200 [DOI] [PubMed] [Google Scholar]
- [20].Aldridge A, Kouroupis D, Churchman S, English A, Ingham E, Jones E. Assay validation for the assessment of adipogenesis of multipotential stromal cells—a direct comparison of four different methods. Cytotherapy 2013; 15:89-101; PMID:23260089; http://dx.doi.org/ 10.1016/j.jcyt.2012.07.001 [DOI] [PMC free article] [PubMed] [Google Scholar]
- [21].Corning Cell Culture Product Selection Guide 2016; Available from: http://csmedia2.corning.com/LifeSciences/media/pdf/lp_cellculture_selection_guide_3_02_lslp_cc_006.pdf; accessed 2016 Oct 4 2016 [Google Scholar]
- [22].Kraus D. Consolidated data analysis and presentation using an open-source add-in for the Microsoft Excel spreadsheet software. Med Writ 2014; 23:25-8; http://dx.doi.org/ 10.1179/2047480613Z.000000000181 [DOI] [Google Scholar]
- [23].Wickham H. ggplot2: Elegant Graphics for Data Analysis [Internet]. Springer-Verlag; New York; 2009. Available from: http://ggplot2.org [Google Scholar]
- [24].Erickson RL, Hemati N, Ross SE, MacDougald OA. p300 coactivates the adipogenic transcription factor CCAAT/enhancer-binding protein α. J Biol Chem 2001; 276:16348-55; PMID:11340085; http://dx.doi.org/ 10.1074/jbc.M100128200 [DOI] [PubMed] [Google Scholar]
- [25].Hanlon PR, Ganem LG, Cho YC, Yamamoto M, Jefcoate CR. AhR- and ERK-dependent pathways function synergistically to mediate 2,3,7,8-tetrachlorodibenzo-p-dioxin suppression of peroxisome proliferator-activated receptor-gamma1 expression and subsequent adipocyte differentiation. Toxicol Appl Pharmacol 2003; 189:11-27; PMID:12758056; http://dx.doi.org/ 10.1016/S0041-008X(03)00083-8 [DOI] [PubMed] [Google Scholar]
- [26].Humason GL. Animal tissue techniques [Internet]. San Francisco, W.H. Freeman; 1962. [cited 2014 Jan 20]. Available from: http://archive.org/details/animaltissuetech00huma [Google Scholar]


