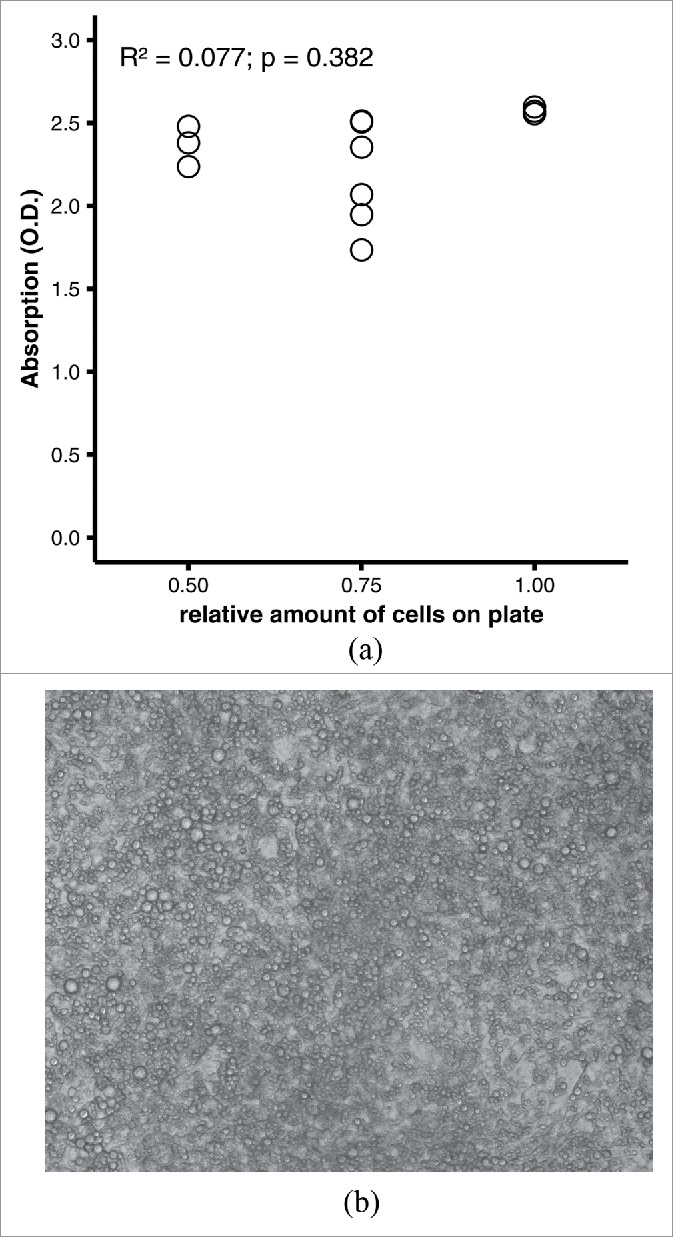
Figure 1.

(A) Performance of quantitative oil red O staining with arbitrary parameters. 3T3-L1 adipocytes were fixed on a 12-well plate in 4% formaldehyde and stained with 0.3% oil red O in 40% 2-propanol for 60 min at room temperature. After washing, dye was eluted with 1 ml/well of 100% 2-propanol for 10 min at room temperature; 200 µl of eluate from each well were transferred to a microtiter plate. Scatter plot of photometric absorption vs. relative amount of cells. R2 = 0.077, p = 0.382 by linear regression. (B) Representative microphotograph of differentiated adipocytes. The picture was taken with a Zeiss AxioCam MRm at 20x lens magnification and was not digitally post-processed by the authors.
