Abstract
The accessibility of nucleosomal DNA to transcription factors and other sequence-specific DNA binding proteins is of importance in the consideration of mechanisms of transcriptional control. Here, we report a simple novel assay which determines this accessibility at eight different rotationally equivalent sites on nucleosomal DNA and shows that linker histones and the chromosomal HMGB proteins, HMG-D and HMG-Z, have opposite effects on the accessibility of nucleosomal DNA. We compare this assay to previously described methods.
INTRODUCTION
To address the question of how transcription factors might access DNA target sites bound in a nucleosome core particle, Widom and co-workers (1–3) developed an assay for DNA accessibility by introducing a number of different restriction sites into a high-affinity nucleosome binding site. The designed sequence, 601.2, was then reconstituted into uniquely positioned nucleosomes and the rates of digestion by the different restriction endonucleases determined. The resulting data showed that the rate of digestion decreased progressively from the outermost to the most central site. On this basis, Widom (4) proposed that the accessibility of nucleosomal DNA to other DNA binding was dependent on transient unwrapping from one or other end of the wrapped DNA.
The assay, as originally designed, although in our hands entirely reproducible (5), contains several potentially complicating variables. The rotational position of the restriction sites with respect to the surface of the histone octamer is one such variable as also are the mechanisms and kinetic constants of the restriction enzymes used. We have sought to simplify these variables by creating a set of nucleosome binding sites, based on the 601.2 sequence, that differ only in the position of a single restriction site. In all the constructs, the rotational orientation of this restriction site is the same. With this system, we can assay in a single reaction the accessibility of the wrapped DNA at many different sites. In addition, we found it necessary to modify the published working equations for calculating the individual rate constants. Our data are not wholly consistent with the progressive transient unwrapping of nucleosomal DNA as a mechanism for generating accessibility to restriction enzymes (4,6). Instead, we suggest that such a mechanism may, on this nucleosome, be restricted primarily to the outermost contacts with histones H2A and H2B, while at the contacts with histones H3 and H4 accessibility may also be generated by transient local breakage of histone–DNA contacts.
THEORY
Consider an equilibrium of two nucleosome conformations (N, n), where only n is the conformation of nucleosomal DNA is susceptible to cleavage by a restriction enzyme
The event to the right of the dotted line follows the classical Michaelis–Menten relationship:
![]()
If [n] ≪ Km, Equation 1 reduces to
![]()
Define K = Vmax/Km, dn/dt = K · [n].
Schemea simplifies to
The rate of reduction of N, n can be written as:

Solving the pair:
![]()

where ![]() , a = k1 + k2 + K, n0 and N0 are initial values at time zero, when the two are in equilibrium N0k1 = n0k2. For the working equation, we combine Equations 2 and 3, substituting n0 and N0 in terms of
, a = k1 + k2 + K, n0 and N0 are initial values at time zero, when the two are in equilibrium N0k1 = n0k2. For the working equation, we combine Equations 2 and 3, substituting n0 and N0 in terms of ![]() .
.

MATERIALS AND METHODS
Preparation of 601.2 mutants
A HaeIII recognition sequence was generated at a chosen locus by each of the eight mutations on pGem-3Z carrying the 601.2 nucleosomal DNA sequence.
The original 601.2 sequence is as follows:

New HaeIII sites were then introduced individually by PCR mutagenesis as highlighted below on the sequence, and designated dyad to dyad-7 where the number indicates the number of helical turns from the dyad. In each case, the remainder of the sequence was unchanged except for the pre-existing HaeIII site. The positions of introduced sites correspond to averaged positions of maximum cleavage by hydroxyl radical of 601.2 DNA reassembled into nucleosomes.

Nucleosome reconstitution and restriction digests
DNA was 32P-labeled at one end by means of PCR. Eight species were mixed in equal amounts prior to reconstitution of nucleosome core particle by means of gradual salt dialysis using purified chicken erythrocyte histone octamers (5). Typically, this resulted in a 120 μl aliquot containing ∼50 nM nucleosome in 10 mM Tris–HCl, pH 7.4.
The enzyme reaction was carried out at 37°C by adding 1.2 μl of enzyme (at suitable concentrations) to 9.6 μl of reconstitute in a total volume of 12 μl containing 50 mM NaCl, 10 mM Tris–HCl, 10 mM MgCl2, 20 μg/ml BSA and 5% glycerol. The concentration of glycerol was constant at all enzyme concentrations. An aliquot of 1 μl of sample was removed at defined time intervals, quenched with 9 μl of gel-loading buffer containing 50 mM EDTA, 50% formamide, 7 M urea and 0.05% xylene cyanol. Reaction products were resolved on 8% denaturing acrylamide gels, and quantified by using a PhosphorImager.
For reactions including HMG-D/Z and histone H5, 1 μl of protein was mixed with 8.6 μl of reconstitute to final concentrations specified in the legend to Figure 4 and 1.2 μl of 10× enzyme reaction buffer for a 15 min incubation period at 37°C before the addition of enzyme as described above.
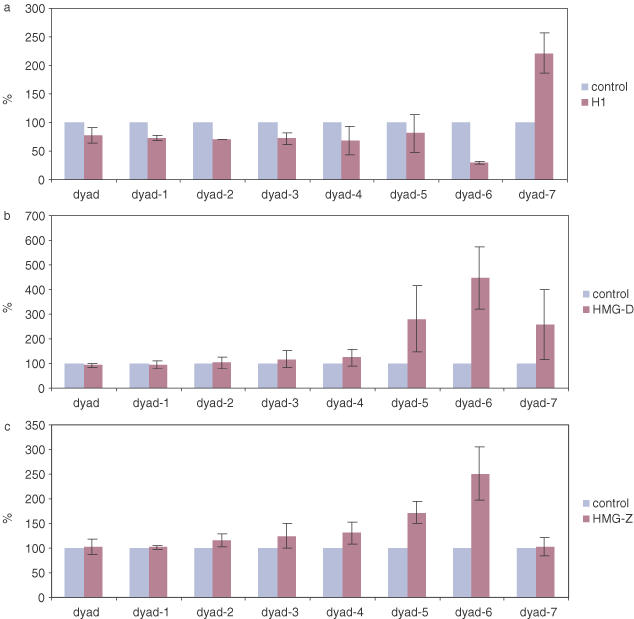
Figure 4.

Effects of linker histone H1 (a), HMG-D (b) and HMG-Z (c) compared in terms of normalized apparent rate constants. The final concentrations for H1, HMG-D and HMG-Z in the reaction mixtures were 19 nM, 2.1 μM and 2.3 μM, respectively.
Data analysis
Rate constants were obtained by the method of global curve fit (to Equation 4) combining results of different enzyme concentrations. The pair of constants, k1, k2 and K (scaled to enzyme level), were set as global parameters respectively for the same sites and enzyme concentrations, or otherwise as local parameters. Initial fits were set up in MicroSoft Excel Solver (7) and refined in the GraphPad Software Prism 4 where the best fit errors were calculated. The global method rules out the possibility of false solutions using one enzyme concentration alone, since reciprocal relations among rate constants can differ despite defining the same curve.
For simplicity in experiments with a fixed enzyme concentration studying the effects of HMG-D/Z and histone H5 on nucleosome binding, a single exponential decay was used for curve fitting instead of Equation 4. The apparent rate constants Kap were normalized to the values of control experiments using nucleosomes alone. Standard deviations were calculated from repeated experiments.
Experimental considerations
The enzymatic reactions are set up so that [n] ≪ Km, as this simplifies the derivation in that K = Vmax/Km. It is most likely k2 ≫ k1, maintaining a low level of effective substrate. Situations where [n] is not strictly ≪Km reduce the accuracy of K alone, as now K = Vmax/(Km + [n]), but affect little the values of k1 and k2. Given these considerations, the substrate concentrations used in this study satisfy the kinetic requirements.
The biphasic characteristic of a degradation curve ought to be negligible due to minute amounts of n0 (k2 ≫ k1), but may be more apparent as a result of free DNA released from histone octamer upon dilution (8,9). This causes k2 to be underestimated in curve fitting. For this reason, dilutions of reconstitutes in the final reaction mixture were minimized.
RESULTS
The implication of Scheme b is that proportionality can be seen between overall cleavage rate and low level of enzyme, having a low K counterbalancing a large k2. This linear relationship breaks down at high enzyme concentrations, once the extremity of reaction rate (limited by k1) is reached. Therefore for inner sites likely to have slower equilibrium (small k2), maximum cleavage rate is reached with low enzyme concentration and remains constant beyond further increase in enzyme concentrations. In view of this, an appropriate range of enzyme concentrations consistent with both scenarios ensures accurate estimates of k1 and k2 by curve fitting.
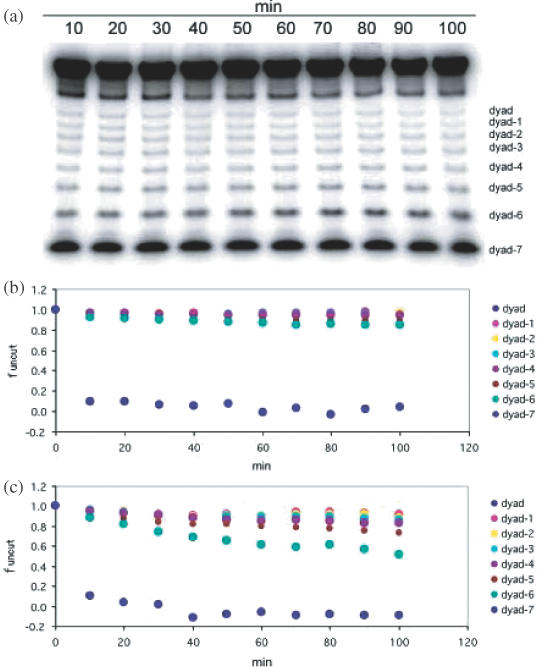
A typical experiment is shown in Figure 1. Bands on a denaturing gel (Figure 1a) were quantified and presented in Figure 1b as decline of substrates in time. Unlike other sites, complete cleavage appeared instantaneously at dyad-7. In a different experiment of higher enzyme concentration, shown in Figure 1c, there was an apparent increase in the extent of cleavage at dyad-6, in comparison to sites nearer the dyad whose cleavage rates remained largely unchanged suggesting low accessibility at these sites.
Figure 1.

(a) A digestion time course of cleavage using 500 U/ml HaeIII. (b) Product bands from experiment shown in (a) were quantified and expressed as uncut fractions. (c) Parallel experiment with a 10-fold higher enzyme concentration.
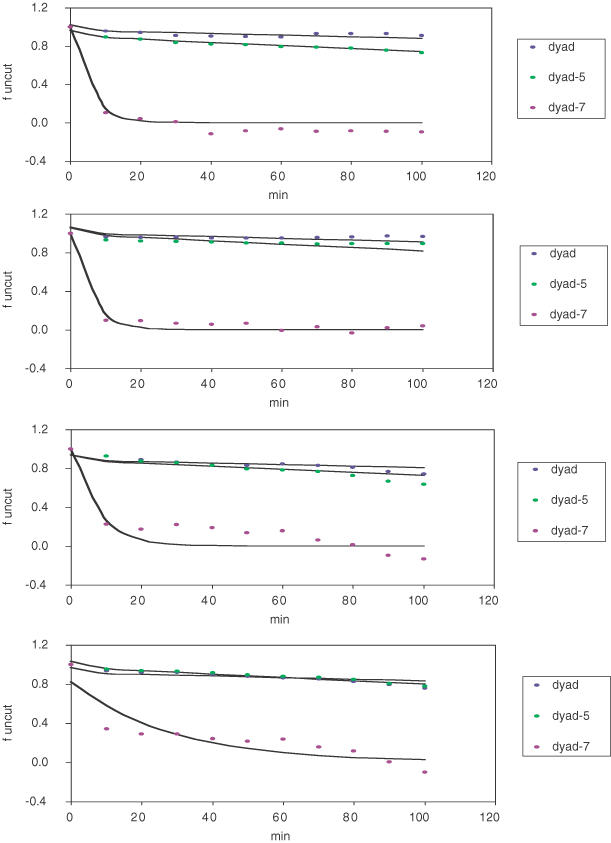
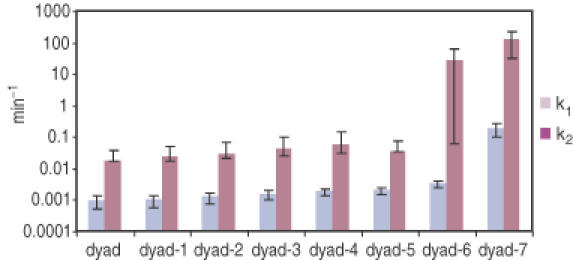
Representative sets of theoretical curves were drawn in Figure 2, each fitted to data points from a single experiment using a fixed enzyme concentration. Pairs of k1 and k2 thus obtained for all sites were plotted in Figure 3. As discussed, sites at dyad-7 and dyad-6 were more accessible, having high k1 and k2 values.
Figure 2.

Parallel experiments (conditions identical to Figure 1) were conducted using four enzyme concentrations (from top to bottom: 5000 U/ml, 500 U/ml, 50 U/ml and 5 U/ml). For clarity, experimental data points as well as best fit curves are shown for three sites.
Figure 3.

k1 and k2 obtained from experiments described in Figure 2 were plotted in pairs for all sites.
Different digestion patterns were observed when each of HMG-D, HMG-Z or linker histones was bound before enzyme addition. Histone H1 protected against cleavage at the majority of sites most obviously at dyad-6, while in contrast HMG-D and to a lesser extent HMG-Z increased the extent of cleavage at dyad-5, dyad-6 and dyad-7. Figure 4 compares the normalized values of Kap in the presence of the proteins with values in control experiment using nucleosomes alone. These observations confirm a previous report (5) that the two proteins tested have opposing effects on the accessibility of DNA exiting and entering the 601.2 nucleosome but differ from this report in the response close to the dyad. The increased accessibility induced by HMG-D at the dyad using the original Widom and Anderson assay (6) is also observed with other HMGB proteins (A. Ragab, unpublished data). We surmise that the different results with the two assays are intrinsic and may be related to the particular properties of the relevant restriction enzymes, e.g. differences in k3 or kp.
DISCUSSION
Validity of the assay
The aim of developing this assay is to simplify the original accessibility assay developed by Widom and co-workers (1–4,6) and in particular to reduce possible influences of different rotational positioning of restriction sites and of different assay conditions and enzymatic mechanisms. The variability in assay conditions used for the cleavages of sites on a single reconstituted nucleosome is relatively small and was thought unlikely to greatly influence the interpretation of the results. However, the other variables are less easy to quantify.
By introducing the same restriction site at different positions, we have created eight different DNA sequences in place of the single one used by Widom and co-workers. The sequences are designed so that the HaeIII site always occupies a rotational position with an outward-facing minor groove. The sequence of the HaeIII site, GGCC, is such that this position would be highly preferred (10). We therefore thought that it is extremely unlikely that any of the altered sequences would adopt a different rotational position. Indeed, the ExoIII digestion patterns of the original sequence and of the mixture of mutated sequences are essentially identical (data not shown). In some cases, for example to those at the dyad, the sequence changes are highly conservative. Another possibility is that the new sequences might differ significantly in affinity for the octamer from the original sequence. Again, we believe this to be unlikely because the new sequences retain identified important positioning signals at ±1.5 (11,12). Again, since the major histone–DNA contacts occur where the minor groove points in towards the histone octamer, the changes we have made, where the minor groove points out, should only influence affinity by altering the mechanical properties of the sequence. Most importantly, the results we have obtained are internally consistent, suggesting that there are no major effects of altered positioning or affinity.
Local fluctuations of histone–DNA contacts
The data show that there is a sharp diminution in the rate of cleavage between sites −7 and −5, and therefore there is relatively little change in the overall rate between sites −5 and the dyad itself. This result is slightly different from that reported by Anderson and Widom (4) who showed that between sites −5 and the minimum observed rate at site −1 there was a more substantial decrease in the cleavage rate. The initial sharp decline in the rate between sites −7 and −5 is wholly consistent with a transient unwrapping but it is more difficult to explain the plateau between −5 and the true dyad on this basis. One possibility is that in this region, which is dominated by interactions between the H3/H4 tetramer and DNA, local breaking and remaking of the histone–DNA contacts may be an additional factor determining accessibility. Such a possibility would be consistent with the binding of the transcription factor NF-κB to central positions in an apparently intact nucleosome (13) and could involve ligand-dependent changes in the binding of the basic histone tails, as invoked for the increased accessibility induced by HMG-D (5).
By simple simulation, a wide range of Keq values suggests that the cleavage at internal sites is either difficult to detect or unmeasurably fast at either of the two moderate distant sites under identical conditions. Previous workers had not observed and therefore not discussed such phenomenon. In contrast, Keqs (k1/k2) calculated from the present study show very similar values, consistent with a fluctuation event.
Altered accessibilities of nucleosomal DNA by linker histone and HMG-D/Z
Linker histones are believed to bind asymmetrically to nucleosome core particle making DNA contacts at dyad and entry/exit region (14–18). HMG-D and HMG-Z are two abundant proteins in embryonic Drosophila, and the former has been shown to compete with histone H1 in chromatin assembly (19,20). How these proteins could impose steric hindrance on DNA and/or (de)stabilize DNA-octamer contacts is not fully established. Decrease in accessibility in the presence of linker histone can be interpreted as lengthened DNA residence on octamer, for a high k2 relative to k1, or vice versa in the presence of HMG-D/Z. Observations in this study suggested that the DNA accessibility of neighbouring sites within the same nucleosome affected by these chromosomal proteins has immediate implications for a non-invasive mechanism in gene transcription.
Protein concentration influences nucleosome dynamics
A higher k1/k2 ratio is a general feature of experiments employing low substrate concentration (data not shown). Despite suspected errors caused by dissociation in diluted nucleosome samples, it is possible that this result reflects a real variation. Protein concentration will affect nucleosome dynamics, such that in a more diluted environment DNA could be on average more loosely wrapped. These observations may provide an explanation for the small value for k2 of ∼2.6 s−1 for all sites in comparison to a predicted value of ≥105 s−1 (1,2). Previous studies used high nucleosome concentrations (at least 100 nM total concentration) including reconstitutes with carrier DNA, which may result in a large k2 maintaining the availability of nucleosomal DNA.
Comparison with the original method
The original method described by Widom et al. (1–3,6) approximated a single exponential decay for describing the nucleosome degradation, since the observed biphasicity was negligible. Here, we summarize this approach. By simple derivations two equations were given below alongside schemes of the nucleosome and free DNA digest.
![]()
Accordingly, the observed rate constant for nucleosome degradation

which reduces to ![]() on two assumptions k2 ≫ k1 and k2 ≫ K. In the case of free DNA
on two assumptions k2 ≫ k1 and k2 ≫ K. In the case of free DNA ![]() . Division of the two yields
. Division of the two yields

Calculation of Keq in this manner absolutely requires assumptions for each of the sites and enzymes to be validated, and consequently may be more prone to error.
CONCLUSION
We have designed a simple straightforward procedure to monitor variations in the accessibility of DNA bound to the histone octamer. The assay is sensitive to changes induced by the binding of the linker histone and of HMG-D/Z. The reactions occur under relatively mild catalytic conditions. This together with the ease of associated data handling permits the technique to be readily adaptable to other applications.
Acknowledgments
ACKNOWLEDGEMENTS
We thank Philip Robinson for the gift of linker histones and Dr Jon Widom for the gift of the 601.2 plasmid.
REFERENCES
- 1.Polach K.J. and Widom,J. (1995) Mechanism of protein access to specific DNA sequences in chromatin: a dynamic equilibrium model for gene regulation. J. Mol. Biol., 254, 130–149. [DOI] [PubMed] [Google Scholar]
- 2.Polach K.J. and Widom,J. (1999) Restriction enzymes as probes of nucleosome stability and dynamics. Methods Enzymol., 304, 278–298. [DOI] [PubMed] [Google Scholar]
- 3.Anderson J.D., Thåström,A. and Widom,J. (2002) Spontaneous access of proteins to buried nucleosomal DNA target sites occurs via a mechanism that is distinct from nucleosome translocation. Mol. Cell. Biol., 22, 7147–7157. [DOI] [PMC free article] [PubMed] [Google Scholar]
- 4.Widom J. (2001) Role of DNA sequence in nucleosome stability and dynamics. Q. Rev. Biophys., 34, 269–324. [DOI] [PubMed] [Google Scholar]
- 5.Ragab A. and Travers,A. (2003) HMG-D and histone H1 alter the local accessibility of nucleosomal DNA. Nucleic Acids Res., 31, 7083–7089. [DOI] [PMC free article] [PubMed] [Google Scholar]
- 6.Anderson J.D. and Widom,J. (2000) Sequence and position-dependence of the equilibrium accessibility of nucleosomal DNA target sites. J. Mol. Biol., 296, 979–987. [DOI] [PubMed] [Google Scholar]
- 7.John E.G. (1998) Simplified curve fitting using spreadsheet add-ins. Int. J. Eng. Ed., 14, 375–380. [Google Scholar]
- 8.Thåström A., Gottesfeld,J.M., Luger,K. and Widom,J. (2004) Histone–DNA binding free energy cannot be measured in dilution-driven dissociation experiments. Biochemistry, 43, 736–741. [DOI] [PubMed] [Google Scholar]
- 9.Gottesfeld J.M. and Luger,K. (2001) Energetics and affinity of the histone octamer for defined DNA sequences. Biochemistry, 40, 10927–10933. [DOI] [PubMed] [Google Scholar]
- 10.Satchwell S.C., Drew,H.R. and Travers,A.A. (1986) Sequence periodicities in chicken nucleosome core DNA. J. Mol. Biol., 191, 659–675. [DOI] [PubMed] [Google Scholar]
- 11.Fitzgerald D.J. and Anderson,J.N. (1999) DNA distortion as a factor in nucleosome positioning. J. Mol. Biol., 293, 477–491. [DOI] [PubMed] [Google Scholar]
- 12.Thåström A., Bingham,L.M. and Widom,J. (2004) Nucleosomal locations of dominant DNA sequence motifs for histone–DNA interactions and nucleosome positioning. J. Mol. Biol., 338, 695–709. [DOI] [PubMed] [Google Scholar]
- 13.Angelov D., Lenouvel,F., Hans,F., Muller,C.W., Bouvet,P., Bednar,J., Moudrianakis,E.N., Cadet,J. and Dimitrov,S. (2004) The histone octamer is ‘invisible’ when NF-κB binds to the nucleosome. J. Biol. Chem., in press. [DOI] [PubMed] [Google Scholar]
- 14.An W., van Holde,K. and Zlatanova,J. (1998) Linker histone protection of chromatosomes reconstituted on 5S rDNA from Xenopus borealis: a reinvestigation. Nucleic Acids Res., 26, 4042–4046. [DOI] [PMC free article] [PubMed] [Google Scholar]
- 15.An W., van Holde,K. and Zlatanova,J. (1998) The non-histone chromatin protein HMG1 protects linker DNA on the side opposite to that protected by linker histones. J. Biol. Chem., 273, 26289–26291. [DOI] [PubMed] [Google Scholar]
- 16.An W., Leuba,S.H., van Holde,K. and Zlatanova,J. (1998) Linker histone protects linker DNA on only one side of the core particle and in a sequence-dependent manner. Proc. Natl Acad. Sci. USA, 95, 3396–3401. [DOI] [PMC free article] [PubMed] [Google Scholar]
- 17.Zhou Y.B., Gerchman,S.E., Ramakrishnan,V., Travers,A. and Muyldermans,S. (1998) Position and orientation of the globular domain of linker histone H5 on the nucleosome. Nature, 395, 402–405. [DOI] [PubMed] [Google Scholar]
- 18.Bharath M.M., Chandra,N.R. and Rao,M.R. (2003) Molecular modeling of the chromatosome particle. Nucleic Acids Res., 31, 4264–4274. [DOI] [PMC free article] [PubMed] [Google Scholar]
- 19.Payet D. and Travers,A. (1997) The acidic tail of the high mobility group protein HMG-D modulates the structural selectivity of DNA binding. J. Mol. Biol., 266, 66–75. [DOI] [PubMed] [Google Scholar]
- 20.Ner S.S., Blank,T., Perez-Paralle,M.L., Grigliatti,T.A., Becker,P.B. and Travers,A.A. (2001) HMG-D and histone H1 interplay during chromatin assembly and early embryogenesis. J. Biol. Chem., 276, 37569–37576. [DOI] [PubMed] [Google Scholar]


