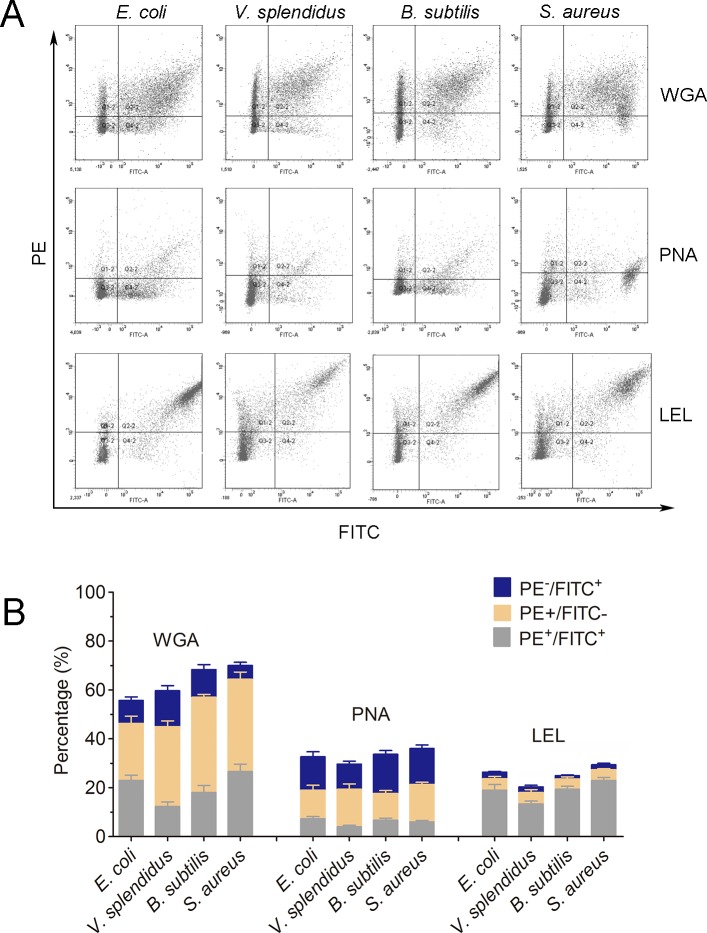
Figure 6. Lectin staining analysis of the phagocytes from C. gigas.
(A) Haemocytes incubated with FITC-labeled E. coli, V. splendidus, S. aureus and B. subtilis, and stained with PE-labeled WGA, PNA and LEL respectively. The correlation between lectin staining and phagocytes was analyzed by flow cytometry. (B) Percentages of haemocytes gated on PE+/FITC+, PE+/FITC− and PE−/FITC+ (n = 5).

