

Abstract
We synthesized potential inhibitors of farnesyl diphosphate synthase (FPPS), undecaprenyl diphosphate synthase (UPPS) or undecaprenyl diphosphate phosphatase (UPPP), and tested them in bacterial cell growth and enzyme inhibition assays. The most active compounds were bisphosphonates with electron-withdrawing aryl-alkyl sidechains which inhibited the growth of Gram-negative bacteria (Acinetobacter baumannii, Klebsiella pneumoniae, E. coli and Pseudomonas aeruginosa) at ~1-4 μg/ml levels. They were potent inhibitors of FPPS; cell growth was partially "rescued" by addition of farnesol or overexpression of FPPS, and there was synergistic activity with known isoprenoid biosynthesis pathway inhibitors. Lipophilic hydroxy-alkyl phosphonic acids inhibited UPPS and UPPP at μM levels; they were active (~2-6 μg/ml) against Gram-positive but not Gram-negative organisms, and again exhibited synergistic activity with cell wall biosynthesis inhibitors, but only indifferent effects with other inhibitors. The results are of interest since they describe novel FPPS, UPPS as well as UPPP inhibitors with cell growth inhibition activities as low as ~1-2 μg/ml.
Keywords: cell wall biosynthesis, drug discovery, Gram-negative pathogens, membrane proteins, Staphylococcus aureus
Introduction
The emergence of resistance to antibiotics is a public health threat[1] so new drugs and new drug leads acting on new targets are of interest.[2] Many of the antibiotics that, over time, have been of particular importance inhibit enzymes involved in bacterial cell wall biosynthesis which is, therefore, a potentially important area for drug discovery. Bacterial cell wall biosynthesis involves many enzymes with initially, dimethylallyl diphosphate (DMAPP, 1), and isopentenyl diphosphate (IPP, 2) being produced by the 2-C-methyl-D-erythritol-4-phosphate or the mevalonate pathways, Figure 1. In most bacteria, DMAPP then reacts, sequentially, with two IPP molecules to form trans-farnesyldiphosphate (FPP, 3) in a reaction catalyzed by FPP synthase (FPPS), then FPP acts as the substrate for undecaprenyl diphosphate synthase (UPPS) to form the (C55) isoprenoid, undecaprenyl diphosphate (UPP, 4). UPP is hydrolyzed by the phosphatase UPP phosphatase (UPPP) to form undecaprenyl phosphate (UP, 5) which is then used (in most bacteria) for peptidoglycan, lipopolysaccharide and wall teichoic acid biosynthesis. FPPS, UPPS and UPPP are thus of interest as targets for novel anti-infectives. In mycobacteria, cell wall biosynthesis is different and begins with formation of cis-FPP, not trans-FPP, followed by formation of cis-decaprenyl (not undecaprenyl) diphosphate, and will not be further discussed here.
Figure 1.

Illustration of selected molecules involved in cell wall biosynthesis in most bacteria. Also shown are sites of action of some antibiotics and potential targets, discussed in the Text.
In our group, we previously reported that the lipophilic bisphosphonate 6 had modest activity against E. coli (IC50 ~30 μm)[3] and exhibited potent synergy (fractional inhibitory concentration index, FICI = 0.18) with fosmidomycin (7), which inhibits the MEP pathway.[4] We also reported that several benzoic acids as well as diamidines such as 8, inhibited UPPS and 8 acted synergistically with methicillin against MRSA (methicillin resistant Staphylococcus aureus).[5] 8 was also active in vivo in a mouse model of infection. We also found that the fertility drug clomiphene (9) was a UPPS inhibitor,[6] as well as an uncoupler of oxidative phosphorylation,[7] the two effects presumably contributing to cell growth inhibition. Here, we synthesized and tested a series of bisphosphonates, phosphonates as well as carboxylic acids and tested them for prenyl synthase activity and for activity against both Gram-positive as well as Gram-negative bacteria.
Results and Discussion
Farnesyl diphosphate synthase as an anti-bacterial target
FPPS is the target for bisphosphonate bone resorption drugs such as zoledronate (10), though 10 has essentially no antibacterial activity. However, as noted above, in earlier work[3] we found that the lipophilic bisphosphonate 6 (an FPPS inhibitor first made[8] by Widler et al. as a potential bone resorption drug) had weak but measurable (~30 μm) activity against the Gram-negative bacterium E. coli. We also found activity against FPPS from the trypanosomatid parasite Trypanosoma brucei (TbFPPS) and we solved the X-ray crystallographic structure of a TbFPPS•6 complex.[9] What was of interest in the crystal structure was that the phenyl group in 6 was close (~4 Å) to a tyrosine group (Y99) which in human FPPS (HsFPPS) is a Phe (F99). This Phe in HsFPPS is thought to be involved in limiting chain elongation to C15 and is present in FPPSs from other eukaryotes such as that from Schistosoma mansoni.[10] A partial alignment of TbFPPS, HsFPPS, SmFPPS as well as Gram-positive and Gram-negative bacterial FPPSs (S. aureus, B. subtilis, E. coli, Acinetobacter baumannii, Klebsiella pneumoniae and Pseudomonas aeruginosa) is shown in Figure 3.
Figure 3.

ClustalW alignments of T. brucei, human, S. mansoni and six bacterial FPPSs. The YS pair is present in all of the bacterial FPPSs and the Tyr is proposed here to interact with electron-deficient aryl groups in bisphosphonate inhibitors. FARM = first aspartate-rich motif; SARM = second aspartate-rich motif. The squiggly lines represent residues omitted from the alignment, for clarity.
The bacterial FPPSs are different to those from eukaryotes in that there are two extra amino acids in the first apartate-rich domain (which is involved in catalysis), plus, there is a conserved YS sequence: both motifs are illustrated in yellow in Figure 3. In our earlier work we found that longer- or shorter-chain analogs of 6 had less activity than did 6 against FPPS, and E. coli cell growth[3]. Also, based on structure alignments (discussed more below), it appeared that the aromatic group in 6 (or its analogs) might interact with the electron-rich Tyr in the bacterial YS motif. We thus hypothesized that it might be possible to obtain improved activity by incorporating electron-withdrawing substituents on the phenyl group in 6 or its analogs, leading to a tyrosine-inhibitor charge transfer interaction. In contrast, addition of an electron-donating substituent might decrease activity, basically as we suggested in earlier work on bisphosphonate inhibitors of ATP-mediated HIV-1 reverse transcriptase catalyzed excision of chain-terminating 3′-azido, 3′-deoxythymidine.[11] We thus made 3 analogs of 6, 11-13 and tested them against various FPPSs as well as in bacterial cell growth inhibition assays.
As can be seen in Figure 2, in addition to adding substituents (difluoro, Br or OMe) to the phenyl group, we replaced the amine with an imidazolium group since in other work[12] we found such species to be potent FPPS inhibitors with good in vivo activity, plus, we replaced the 1-OH group with a 1-H since the hydroxyl group is involved (in other bisphosphonates) in potent bone binding[13]. Plus, these analogs appeared to be more readily synthesized than the corresponding amines. We then tested all 3 compounds against FPPSs from E. coli, P. aeruginosa, T. brucei, H. sapiens, and S. mansoni, as well as against human geranylgeranyl diphosphate synthase (HsGGPPS). Results are shown in Table 1 and Figure S1. As can be seen in Table 1, two of the three bisphosphonates had activity in the ~70-600 nm range against EcFPPS, PaFPPS, TbFPPS, HsFPPS, SmFPPS, and HsGGPPS, generally similar to that we see (under the same assay conditions) with zoledronate, although zoledronate is only a weak HsGGPPS inhibitor[12] while 11-13 are all active, consistent with previous work on other lipophilic bisphosphonates.
Figure 2.

Structures of substrates and inhibitors discussed in the Text.
Table 1.
IC50 values of 11, 12, and 13 against FPPS (in μm) , GGPPS (in μm), bacteria (μg/ml) and human cells in (μg/ml). Data re presented as mean±SD for duplicate experiments.
| Enzymes / Organisms |
11 | 12 | 13 |
|---|---|---|---|
| EcFPPS | 0.12 ± 0.025 | 1.6 ± 0.28 | >100 |
| PaFPPS | 0.32 ± 0.068 | 0.58 ± 0.15 | >100 |
| TbFPPS | 0.12 ± 0.026 | 0.16 ± 0.029 | 0.51 ± 0.20 |
| HsFPPS | 0.065 ± 0.012 | 0.12 ± 0.026 | 0.084 ± 0.0083 |
| SmFPPS | 0.57 ± 0.11 | 0.33 ± 0.054 | 0.50 ± 0.065 |
| HsGGPPS | 0.39 ± 0.073 | 0.33 ± 0.089 | 0.53 ± 0.11 |
|
| |||
| S. aureus | >100 | >100 | >100 |
| B. subtilis | 39 ± 13 | 26 ± 5.9 | >100 |
| M. smegmatis | 6.8 ± 3.0 | 7.5 ± 2.4 | 20 ± 5.3 |
| E. coli | 2.1 ± 0.57 | 1.7 ± 0.38 | >100 |
| A. baumannii | 2.8 ± 0.70 | 2.0 ± 0.50 | >100 |
| K. pneumonia | 2.3 ± 0.49 | 2.4 ± 0.43 | >100 |
| P. aeruginosa | 3.5 ± 0.78 | 3.3 ± 0.68 | >100 , |
| HEK293 | 27 ± 4.0 | 36 ± 8.6 | 82 ± 22 |
However, with the two bacterial enzymes, EcFPPS and PaFPPS, there is essentially no FPPS inhibition by the methoxy analog 13. This was behavior that was originally predicted so the differences between the EcFPPS/PaFPPS and other FPPS inhibition results with 11-13 may be due to interactions with a Tyr (Y79), in addition to small differences between the type II (EcFPPS; eubacterial) and type I (eukaryotic) FPPS structures. At present, we do not have the structures of 11, 12, or 13 bound to a bacterial FPPS. However, we show in Figure 4 a structural alignment of TbFPPS•6 (PDB ID code 2P1C) with EcFPPS (PDB ID code 1RQJ) from which it can be seen that the conserved YS residues in EcFPPS could align with the (electron-rich) Tyr in close proximity (~3 Å) to the phenyl group in the TbFPPS•6 structure, consistent with a role for a charge-transfer interaction[11] with inhibitors with electron-withdrawing phenyl substituents. This is of course a hypothesis, but clearly there are major differences in FPPS inhibition between 11, 12, and 13 in the bacterial and eukaryotic systems, and charge transfer seems a likely reason for the differences observed.
Figure 4.

Stereo representation of superimposition of TbFPPS•6 (PDB code 2P1C) with EcFPPS (PDB ID code 1RQJ). Side chains of HY (red) and YS (yellow) amino acids are shown in stick format. 6 is shown in purple. Aspartate-rich motif (FARM) is shown in magenta. Mg2+ are orange spheres.
We next tested 11-13 in cell growth inhibition assays. First, against the Gram-positives S. aureus and Bacillus subtilis, as well as Mycobacterium smegmatis. Second, against the Gram-negatives E. coli, P. aeruginosa, K. pneumoniae and A. baumannii. Third, against a human embryonic kidney (HEK293) cell line. Results are shown in Table 1 and Figures S2, S3. There was little or no activity of 11-13 against S. aureus or B. subtilis, but there was some activity against M. smegmatis (corresponding to an IC50 of ~7 μg/ml for 11 and 12). However, the difluoro-species 11 as well as the bromo-species 12 had promising activity against all four Gram-negatives, in the ~1-4 μg/ml range, but the methoxy analog 13 was inactive, Table 1. These results are of interest since they indicate that in the Gram-negatives, 11-13 exhibit the same overall pattern of activity in cells that we find for EcFPPS and PaFPPS enzyme inhibition, Table 1, where 13 was inactive. Why there is less activity against S. aureus and B. subtilis is not known and naturally could involve both differences in uptake/efflux as well as FPPS inhibition, although the latter possibility seems unlikely given the strong sequence similarities in the active site regions, Figure 3. But how can we further test whether FPPS is actually a target for 11 and 12 in the Gram-negative organisms?
To help answer this question, we first investigated whether there were synergistic effects between bisphosphonate 11 and fosmidomycin (7) in E. coli, A. baumannii, K. pneumoniae and P. aeruginosa, basically as we described previously for 6 in E. coli. More specifically, we determined the fractional inhibitory concentration index (FICI) values for each combination using the FICI formula:[14]
where FICA and FICB are the fractional inhibitory concentrations of drugs A and B, MIC(A) and MIC(B) are the MIC values of drugs A and B acting alone, and MIC(AB) and MIC(BA) are the MIC values of the most effective combination of drug A or B in the presence of drug B or A. Using this method, FICI values of <0.5 represent synergy, >0.5 and <1.0 represent additivity, >1 and <2 represent an indifferent effect, and ≥2 represents antagonism.[15] In addition, we evaluated isobolograms using the method of Berenbaum.[16] FICI values are shown in Table 2 and isobolograms in Figure 5. We find FICI values of 0.39 ± 0.15 (E. coli); 0.64 ± 0.23 (A. baumannii); 0.22 ± 0.026 (K. pneumoniae) and 0.44 ± 0.12 (P. aeruginosa), Table 2. FICI values of <0.5 are generally taken to indicate a synergistic interaction so these results are consistent with 11 inhibiting the same pathway as does fosmidomycin, that is, isoprenoid biosynthesis.
Table 2.
Combination of 11 with fosmidomycin against Gram-negative bacteria. Data represented as mean±SD for duplicate experiments.
| Organism | MIC formidomycin (μg/ml) |
FIC fosmidomycin |
MIC 11
(μg/ml) |
FIC 11 | FIC Index |
|---|---|---|---|---|---|
| E. coli | 5 | 0.14 ± 0.13 | 6 | 0.24 ± 0.023 | 0.39 ± 0.15 |
| A. baumannii | 5 | 0.27 ± 0.057 | 6 | 0.37 ± 0.17 | 0.64 ± 0.23 |
| K. pneumoniae | 5 | 0.12 ± 0.014 | 6 | 0.097 ± 0.012 | 0.22 ± 0.026 |
| P. aeruginosa | 3 | 0.18 ± 0.066 | 10 | 0.27 ± 0.057 | 0.44 ± 0.12 |
Figure 5.

Isobolograms for bacterial cell growth inhibition by 11 and fosmidomycin (7) against a) E. coli, b) A. baumannii, c) K. pneumoniae and d) P. aeruginosa. The FICI (fractional inhibitory concentration indices) are shown in Table 2. The mean FICI value is 0.42 ± 0.17 indicating synergistic activity (in most cases).
Another possible test of whether FPPS is a target is whether cell growth inhibition is “rescued” by addition of farnesol. The use of farnesol, farnesyl diphosphate, geraniol and geranylgeranyl diphosphate has been used previously—in mammalian cell lines as well as in trypanosomes (parasitic protozoa)—to assess the effects of bisphosphonates on cell growth, and in mammalian cell lines it is known that there are kinases that convert geranylgeraniol to geranylgeranyl diphosphate (GGOH → GGPP),[17] with GGOH rescuing cells from bisphosphonate growth inhibition. There are also kinases that can convert e.g. farnesol to farnesyl diphosphate (FOH → FP), but whether such prenol kinases are present in the organisms studied here is not known so caution needs to be exercised in interpreting the results. We grew all four Gram-negative bacteria in the absence or presence of 200 μm FOH resulting in, on average, an ~8x increase in the IC50 for growth inhibition by the bisphosphonates 11 and 12, consistent with an FPPS target, Figure 6.
Figure 6.

Partial rescue of cell growth inhibition by farnesol or PaFPPS overexpression. Addition of 200 μm farnesol (FOH) to the growth medium increases the IC50 of 11 and 12 for cell growth inhibition by a factor of ~8. a) E. coli K-12 with FOH; b) A. baumannii with FOH; c) K. pneumoniae with FOH; and d) P. aeruginosa with FOH; e) E. coli BL21(DE3) with PaFPPS overexpression.
Next, we carried out growth inhibition assays of 11 and 12 against an E. coli strain that overexpressed PaFPPS,[18] again resulting in a considerable (~8x) increase in the IC50 values for both 11 and 12, Table 3. So, based on the patterns of FPPS and cell growth inhibition by 11-13; synergistic activity with fosmidomycin; partial rescue of cell growth inhibition by FOH, and the FPPS overexpression results, we conclude that the activity of 11 and 12 in the Gram-negative bacteria is due—at least in part—to FPPS inhibition. The two active compounds 11 and 12 contain electron-withdrawing substituents and are likely to undergo charge-transfer interactions with the conserved Tyr79 (Figures 2, 3), an interaction that would be absent with the methoxy side-chain containing species 13. It is also possible that there are additional targets, but the key point is that 11, 12 are the first bisphosphonates to have promising (1-4 μg/ml) IC50 values against these four Gram-negative bacteria—values that are about an order of magnitude higher than found with 6; FPPS is at least one of the targets involved; and there was little effect on HEK293 cell growth.
Table 3.
IC50 values (in μg/ml) of 11, 12, 32, and 41 in E. coli, A. baumannii, K. pneumoniae, P. aeruginosa, E. coli overexpressing P. aeruginosa FPPS (PaFPPS++), and E. coli overexpressing E. coli UPPS (EcUPPS++). Data re presented as mean±SD for duplicate experiments.
| Organism | Inhibitor | Rescuing Agent (RA) |
IC50
without RA |
IC50
with RA |
|---|---|---|---|---|
| E. coli | 11 | Farnesol | 2.1 ± 0.57 | 19 ± 4.1 |
| E. coli | 12 | Farnesol | 1.7 ± 0.38 | 28 ± 9.0 |
| A. baumannii | 11 | Farnesol | 2.8 ± 0.70 | 18 ± 4.9 |
| A. baumannii | 12 | Farnesol | 2.0 ± 0.50 | 22 ± 2.4 |
| K. pneumoniae | 11 | Farnesol | 2.3 ± 0.49 | 13 ± 1.8 |
| K. pneumoniae | 12 | Farnesol | 2.4 ± 0.43 | 21 ± 4.2 |
| P. aeruginosa | 11 | Farnesol | 3.5 ± 0.78 | 23 ± 7.8 |
| P. aeruginosa | 12 | Farnesol | 3.3 ± 0.68 | 22 ± 3.5 |
|
| ||||
| E. coli | 11 | PaFPPS++ | 1.6 ± 0.35 | 19 ± 2.4 |
| E. coli | 12 | PaFPPS++ | 2.5 ± 1.1 | 15 ± 3.6 |
| E. coli | 32 | EcUPPS++ | 6.4 ± 1.3 | 86 ± 17 |
| E. coli | 41 | EcUPPS++ | 9.0 ± 1.5 | 107 ± 15 |
Alkyl phosphonate and carboxylate inhibitors
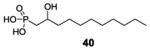
We next synthesized a series of OH-substituted alkyl phosphonic acids and carboxylic acids. Our initial interest in these types of compound (structures shown in Figure S4) was that they might inhibit the enzyme dihydroxyacid dehydratase (DHAD) which in many bacteria is essential for branched-chain amino-acid biosynthesis with Flint and Nudelman having reported that e.g. the 2,3-dihydroxyoctanoic acid 14 (Figure 2) and the 1-hydroxy-2-methylpropylphosphonic acid 15, were inhibitors of DHAD from plants and E. coli.[19] The compounds were shown to bind to enzymes that contain Fe-S clusters, but it appeared to us that they might also have prenyl transferase inhibition activity. We thus synthesized and tested a series of dihydroxy acids and hydroxyphosphonates (16-41, Figure S4) and tested them against the same panel of bacteria as described for the bisphosphonates: S. aureus, B. subtilis, M. smegmatis, E. coli, A. baumannii, K. pneumoniae and P. aeruginosa. Compounds 16, 17, 23, 24, 26, 28, 29, 34-38 were inactive. Results for all active compounds are shown in Table S1 (SMILES structures in Table S2) and Figure S5 and results for the most active compounds are shown in Table 4. Several compounds containing long-akyl sidechains, such as 32 and 41 had activity in the 2-6 μg/ml range against Gram-positive, but not Gram-negative bacteria, Table 4. These results then raise the question: how do these compounds inhibit bacterial cell growth?
Table 4.
IC50 values of dihydroxy acids and hydroxyphosphonates against bacterial cells and enzymes.
| Compounds |
S. aureus
(μg/mL) |
B. subtilis
(μg/mL) |
M. smegmatis
(μg/mL) |
E. coli
(μg/mL) |
A. baumannii
(μg/mL) |
K. pneumoniae
(μg/mL) |
P. aeruginosa
(μg/mL) |
SaUPPS (μM) |
EuUPPP (μM) |
|---|---|---|---|---|---|---|---|---|---|
|
|
5.2 | 39 | 14 | 8.1 | >100 | >100 | >100 | 39 | >200 |
|
|
1.7 | 2.0 | 3.7 | 6.4 | 5.9 | 6.4 | 37 | 0.73 | 0.92 |
|
|
3.1 | 5.0 | 8.7 | 8.1 | 6.2 | 24 | >100 | 2.4 | 3.7 |
|
>100 | >100 | 21 | >100 | >100 | >100 | >100 | 25 | 11 |
|
|
6.4 | 10 | 7.0 | 9.0 | 14 | 25 | >100 | 2.8 | 3.4 |
We reasoned that isoprenoid biosynthesis might again be one target area since there is some similarity between the more potent bacterial cell growth inhibitors—the lipophilic hydroxyphosphonates 32 and 41—and GPP or FPP, substrates involved in many prenyl transferase reactions. To test whether or not isoprenoid biosynthesis inhibition was a likely target, we carried out 12 FICI determinations using the 1-hydroxyphosphonate 32 together with either a known antibacterial isoprenoid/cell wall biosynthesis inhibitor (fosmidomycin, carbenicillin, vancomycin, ampicillin, bacitracin, cefotaxime, fosfomycin) or an antibacterial compound that does not target these pathways (kanamycin, tetracycline, chloramphenicol, spectinomycin, sulfamethoxazole, trimethoprim). We obtained data on two organisms: B. subtilis, chosen because it utilizes the non-mevalonate (MEP) pathway and is inhibited by fosmidomycin (which targets 1-deoxy-D-xylulose 5-phosphate reductoisomerase, DXR), and S. aureus, which uses the mevalonate pathway.
Typical experimental (isobologram) results are shown in Figures 7 and S6 and the FICI results are shown in Table 5. The results shown in Table 5 indicate that in each case where the second inhibitor targets isoprenoid/cell wall biosynthesis, there is a synergistic interaction (FICIavg = 0.31 ± 0.11, n = 13) while in each case where the second inhibitor is not involved in isoprenoid/cell wall biosynthesis, there is an indifferent (though not antagonistic) effect (FICIavg = 1.53 ± 0.19, n = 11). We again use the definition that FICI values <0.5 mean synergy; 0.5-1 additivity; 1-2 indifference and >2, antagonism. These results strongly support the idea that this hydroxyphosphonate, 32, targets isoprenoid/cell wall biosynthesis. Some possible targets, based on structure, would be FPPS, UPPS and UPPP, since these are all in the isoprenoid/cell wall biosynthesis pathway (where we see synergy) while e.g. prenyl synthases such as those involved in quinone biosynthesis, are not.
Figure 7.

Representative isobolograms for 32 with antibiotics having known mechanisms of action. a) 32+fosmidomycin in B. subtilis showing synergy (FICI=0.27) of 32 with a cell wall biosynthesis inhibitor (that targets DXR, 1-deoxy-D-xylulose-5-phosphate reductoisomerase, in the non-mevalonate pathway); b) 32+sulfamethoxazole in B. subtilis showing an indifferent effect (FICI=1.78) of 32 with a nucleic acid biosynthesis inhibitor (that targets dihydropteroate synthase); c) 32+bacitracin in S. aureus showing synergy (FICI=0.24) of 32 and a cell wall biosynthesis inhibitor (that targets UPPP); d) 32+tetracycline in S. aureus showing an indifferent effect (FICI=1.61) of 32 with a protein synthesis inhibitor (that targets ribosome function).
Table 5.
Effects of addition of different known bacterial cell growth inhibitors on B. subtilis and S. aureus cell growth inhibition by 32. The cell targets of the known inhibitors are shown, together with the FICI values (and errors) for the combinations. The mean values for isoprenoid/cell wall biosynthesis inhibitors is FICIavg = 0.31 ± 0.11, n = 13 (indicating synergistic activity); that for other inhibitors is FICIavg = 1.53 ± 0.19, n = 11 (indicating an indifferent though not antagonistic effect). Data re presented as mean±SD for duplicate experiments.
| B. subtilis | ||||||
|
| ||||||
| Antibiotic | MIC antibiotic (μg/mL) |
FIC antibiotic |
MIC 32
(μg/mL) |
FIC 32 | FIC Index | |
|
| ||||||
| Cell Wall Biosynthesis Inhibitors |
Fosmidomycin | 5 | 0.25 ± 0.043 | 10 | 0.013 ± 0.0037 | 0.27 ± 0.046 |
| Carbenicillin | 5 | 0.25 ± 0.043 | 10 | 0.097 ± 0.049 | 0.34 ± 0.048 | |
| Cefotaxime | 2.5 | 0.30 ± 0.044 | 10 | 0.075 ± 0.012 | 0.38 ± 0.056 | |
| Vancomycin | 0.5 | 0.33 ± 0.058 | 10 | 0.080 ± 0.059 | 0.41 ± 0.12 | |
| Fosfomycin | 200 | 0.21 ± 0.025 | 10 | 0.22 ± 0.052 | 0.43 ± 0.077 | |
| Ampicillin | 0.5 | 0.18 ± 0.041 | 10 | 0.048 ± 0.023 | 0.23 ± 0.063 | |
| Bacitracin | 200 | 0.12 ± 0.028 | 10 | 0.23 ± 0.010 | 0.35 ± 0.13 | |
|
|
||||||
| Protein Biosynthesis Inhibitors |
Kanamycin | 1.5 | 0.61 ± 0.097 | 10 | 0.95 ± 0.097 | 1.55 ± 0.19 |
| Tetracycline | 5 | 0.82 ± 0.21 | 10 | 0.80 ± 0.15 | 1.61 ± 0.35 | |
| Chloramphenicol | 0.5 | 0.55 ± 0.13 | 10 | 0.93 ± 0.32 | 1.47 ± 0.45 | |
|
|
||||||
| Nucleic Acid Inhibitors |
Sulfamethoxazole | 200 | 0.87 ± 0.23 | 10 | 0.91 ± 0.25 | 1.78 ± 0.48 |
| Trimethoprim | 0.5 | 0.77 ± 0.18 | 10 | 0.60 ± 0.084 | 1.37 ± 0.26 | |
| S. aureus | ||||||
|
| ||||||
| Antibiotic | MIC antibiotic (μg/mL) |
FIC antibiotic |
MIC 32
(μg/mL) |
FIC 32 | FIC Index | |
|
| ||||||
| Cell Wall Biosynthesis Inhibitors |
Carbenicillin | 15 | 0.27 ± 0.015 | 10 | 0.052 ± 0.0077 | 0.32 ± 0.022 |
| Cefotaxime | 2 | 0.21 ± 0.048 | 10 | 0.18 ± 0.057 | 0.40 ± 0.11 | |
| Vancomycin | 1.5 | 0.19 ± 0.019 | 10 | 0.16 ± 0.033 | 0.34 ± 0.052 | |
| Fosfomycin | 200 | 0.13 ± 0.022 | 10 | 0.052 ± 0.014 | 0.18 ± 0.036 | |
| Ampicillin | 0.5 | 0.30 ± 0.095 | 10 | 0.056 ± 0.012 | 0.35 ± 0.11 | |
| Bacitracin | 200 | 0.21 ± 0.039 | 10 | 0.027 ± 0.0090 | 0.24 ± 0.048 | |
|
|
||||||
| Protein Biosynthesis Inhibitors |
Kanamycin | 1.5 | 0.81 ± 0.17 | 10 | 0.83 ± 0.17 | 1.64 ± 0.34 |
| Tetracycline | 0.5 | 0.83 ± 0.38 | 10 | 0.93 ± 0.13 | 1.76 ± 0.51 | |
| Chloramphenicol | 5 | 0.71 ± 0.11 | 10 | 0.73 ± 0.21 | 1.44 ± 0.33 | |
| Spectinomycin | 40 | 0.45 ± 0.091 | 10 | 0.84 ± 0.22 | 1.29 ± 0.31 | |
|
|
||||||
| Nucleic Acid Inhibitors |
Sulfamethoxazole | 200 | 0.75 ± 0.20 | 10 | 0.99 ± 0.17 | 1.74 ± 0.37 |
| Trimethoprim | 15 | 0.69 ± 0.32 | 10 | 0.53 ± 0.13 | 1.22 ± 0.45 | |
|
| ||||||
| Mean FICIs: | B. subtilis | inhibitors targeting cell wall biosynthesis | 0.31 ± 0.14 | |||
| inhibitors targeting nucleic acids and protein biosynthesis | 1.56 ± 0.15 | |||||
| S. aureus | inhibitors targeting cell wall biosynthesis | 0.31 ± 0.080 | ||||
| inhibitors targeting nucleic acids and protein biosynthesis | 1.52 ± 0.23 | |||||
We then tested all compounds against EcFPPS, SaUPPS and EcUPPP[20] using phosphate-release assays.[21] There was no activity (IC50 > 300 μm) against EcFPPS or PaFPPS (data not shown) but several compounds (Figures S7, S8) were active against UPPS and UPPP and dose-response curves for the most active species are shown in Figures 8a, b. Both the 1-OH and 2-OH phosphonates (32 and 41) were active against SaUPPS with IC50 values of ~1-3 μm. For the UPPP activity inhibition assay, we found that 32 and 41 inhibited UPPP with IC50 values of ~1-4 μm (corresponding to a Ki ~300-980 nm, assuming competitive inhibition).[22] Under the same assay conditions, the IC50 for UPPP inhibition by bacitracin was 32 μm, Figure 8b. So, 32 and 41 inhibit both UPPS as well as UPPP, consistent with the observation that 32 shows synergistic activity with all isoprenoid/cell wall biosynthesis inhibitors tested. The dihydroxy acid, 20 showed weak inhibition against SaUPPS and no inhibition (>200 μm) against EcUPPP, resulting in less activity in cells. We also found that overexpressing EcUPPS caused a ~6x increase in the IC50 for E. coli cell growth inhibition by both 32 and 41, Figures 7c and S9. We thus conclude that both UPPS as well as UPPP are likely targets for the most potent hydroxyphosphonates. Because 32 and 11 are inhibiting different enzymes involved in isoprenoid biosynthesis, we also tested for synergistic activity against E. coli cell growth. As expected, 32 and 11 had synergistic activity with an FICI value of 0.31 ± 0.099, Figure S10. And finally, we tested 20, 32 and 41 for their effects on growth of the human embryonic kidney cell line HEK-293. The MIC values for cell growth inhibition were in the range of 90 μg/ml to 410 μg/ml, Figure S3, so these compounds are not highly toxic to at least this human cell line.
Figure 8.

Enzyme and cell growth inhibition by the dihydroxyacid 20 and hydroxyphosphonates 32 and 41. a) SaUPPS inhibition; b) EcUPPP inhibition together with result for bacitracin; c) partial rescue of E. coli cell growth inhibition by EcUPPS overexpression.
Conclusions
The results we have reported above are of interest for several reasons. We synthesized a broad range of compounds—bisphosphonates, hydroxyphosphonates and dihydroxyacids in order to find novel inhibitors of isoprenoid biosynthesis that also inhibited bacterial cell growth. Based on earlier work on E. coli cell growth inhibition and the structure of a T. brucei FPPS-bisphosphonate complex, we made novel bisphosphonates containing electron-withdrawing aryl substituents that inhibited E. coli, K. pneumoniae, A. baumannii and P. aeruginosa cell growth in the 1-4 μg/ml range. Growth inhibition was partially rescued (an increase in IC50 by a factor of ~8) by addition as farnesol, and in cells overexpressing FPPS, and FICI values with one bisphosphonate with fosmidomycin were 0.42 ± 0.17, consistent with an isoprenoid biosynthesis target. We also produced a series of dihydroxy acids and hydroxyphosphonates which we found inhibited UPPS as well as UPPP, and Gram-positive (but not Gram-negative) cell growth. Both of these compounds, as well as the bisphosphonates, acted synergistically with other, known inhibitors of isoprenoid biosynthesis/bacterial cell wall growth. Overall, the results are of interest since we have found several interesting new prenyl synthase inhibitors that target FPPS, UPPS or UPPP have low micromolar activity against numerous pathogenic bacteria.
Experimental Section
General Methods
All chemicals were reagent grade. 1H NMR and 13C NMR spectra were obtained on Varian (Palo Alto, CA) Unity spectrometers at 400 and 500 MHz for 1H and at 100 and 125 MHz for 13C. Elemental analyses were carried out in the University of Illinois Microanalysis Laboratory. HPLC/MS analyses were performed by using an Agilent LC/MSD Trap XCT Plus system (Agilent Technologies, Santa Clara, CA) with an 1100 series HPLC system including a degasser, an autosampler, a binary pump, and a multiple wavelength detector. All final compounds were ≥95% pure as determined by quantitative spin count NMR (qNMR) or HPLC-MS and structures were characterized by 1H NMR and HRMS.
Chemical Syntheses
Hydrogen (2-(3-(3-(3,4-difluorophenyl)propyl)-1H-imidazol-3-ium-1-yl)-1-phosphonoethyl) phosphonate (11). To a solution of 3,4-difluorobenzaldehyde a (1.4 g, 10 mmol) in 20 ml of methanol was added triethyl phosphonoacetate (3 ml, 15 mmol), Scheme 1. The reaction mixture was cooled to 0°C and into it was slowly added 2 ml sodium methoxide (30 wt% solution in methanol). The mixture was stirred overnight at room temperature. The solvent was removed under reduced pressure and the crude material partitioned between ethyl acetate and water. The organic layer was dried over Na2SO4 and solvent removed under reduced pressure. The product was purified by using column chromatography (silica gel, eluting with hexane/ethyl acetate 30:1) to give the unsaturated ester b as an oil (1.7 g, 80%). To a solution of b (1.7 g, 8 mmol) in methanol (100 ml) was added palladium on charcoal (0.6 g, 10%) under hydrogen. The reaction mixture was stirred at room temperature for 3 h. Solvents were removed under reduced pressure. The product was partitioned between water and ethyl acetate, the organic layer separated, dried over Na2SO4 and solvent removed under reduced pressure. The ester product c was obtained as a colorless oil (1.6 g, 95%). To a solution of lithium aluminum hydride (160 mg, 4 mmol) in anhydrous tetrahydrofuran (THF) was slowly added a solution of c (1.6 g, 8 mmol) in THF (30 ml). The reaction mixture was stirred at room temperature overnight. Then, water (12 ml), sodium hydroxide 4N (12 ml) and finally water (36 ml) were added at 0°C. The mixture was stirred and the resulting salts filtered through a pad of Celite, washing with ethyl acetate (100 ml). The product was treated with water and CH2Cl2 and the organic layer separated, dried over Na2SO4 and solvent removed under reduced pressure to give the alcohol product d as an oil (1.0 g, 90%). To a solution of d (1.0 g, 7 mmol) in 100 mL CH2Cl2 was added triphenylphosphine (2.3 g, 8 mmol). The mixture was stirred at room temperature and N-bromosuccinimide (NBS, 1.4 g, 8 mmol) added, in small portions. The mixture was stirred overnight then washed with water and extracted with hexane. The organic layer was separated, dried over Na2SO4 and solvent removed under reduced pressure to give the bromide product e as a light yellow solid (1.5 g, 95%). Imidazole (1.0 g, 15 mmol) was dissolved in THF (30 mL) and NaH (240 mg, 10 mmol) added. The mixture was stirred at room temperature for 30 minutes then e (1.5 g, 7 mmol) added. The reaction mixture was heated to 80°C and stirred overnight, then quenched with water and the mixture extracted with diethyl ether. The organic layer was separated, dried over Na2SO4 and solvent removed under reduced pressure. The crude product was purified by using column chromatography (silica gel, hexane/ethyl acetate 2:1). The imidazole product f was obtained as a light yellow solid (1.05 g, 70%). Paraformaldehyde (1.35 g, 45.0 mmol) and diethylamine (0.68 g, 9.33 mmol) were dissolved in dry methanol (30 ml), with warming. A solution of tetraethyl methylenebisphosphonate g (2.7 g, 9.33 mmol) in dry methanol (30 ml) was added at 20°C and the mixture stirred for 5 d. The reaction mixture was then concentrated under vacuum, toluene (20 ml) added, and the solution concentrated again. This last step was then repeated to remove all traces of methanol, yielding tetraethyl 1-methoxymethyl methylene 1,1-bisphosphonate h as a colorless oil (2.9 g, 95%). Intermediate h was added to pTSA (cat) and toluene (100 ml) and the mixture heated for 16h under reflux using a Soxhlet apparatus charged with 4 Å molecular sieves. The mixture was allowed to cool to 20°C, then washed twice with water (2 × 20 ml). Drying (MgSO4) and concentrating under vacuum gave i as a colorless, viscous oil (2.7 g, 99%). Intermediate i (2.7 g, 9 mmol) was dissolved in dry DCM, cooled to 0°C and Me3SiBr (12 mL, 90 mmol) added drop-wise over 30 min. The mixture was stirred for 2 d at room temperature. Solvent was then evaporated and the residue dried under vacuum for ~1 h. Then, 80 ml dry methanol was added and the mixture was stirred for 20 min at room temperature. Solvent was removed and the brown oil was dried overnight to give compound j (1.6 g, 95%). Intermediate f (220 mg, 1 mmol) was dissolved in AcOH, then j (206 mg, 1.1 mmol) was slowly added. The mixture was stirred under reflux for 3 d. Then, the AcOH was evaporated under vacuum. The residue was suspended in methanol and sonicated for 1 min. The mixture was then centrifuged and the liquid layer discarded. The latter procedure was repeated twice. Then, the remaining residue was dried under vacuum overnight to give the final product k (11) as a white solid (3.1 g, 85%). 1H NMR (D2O, 500 MHz) δ (ppm): 8.62 (s, 1 H), 7.39 (s, 1 H), 7.24 (s, 1 H), 7.00 (m, 2 H), 6.80 (m, 1 H), 4.43 (dt, J = 7.0, 12.5 Hz, 2 H), 4.02 (t, J = 7.5 Hz, 2 H), 2.50 (t, J = 7.5 Hz, 2 H), 2.41 (tt, J = 7.0, 12.5 Hz, 1 H), 2.04 (m, 2 H). 31P NMR (D2O, 202 MHz) δ (ppm): 15.29. ESI HRMS: m/z [M+H]+ calculated for C14H19F2N2O6P2+: 411.0686, found: 411.0690. The purity of the product was determined by qNMR (potassium hydrogen phthalate as standard, 99.95%): 98.3%.
Scheme 1.

Synthesis route to FPPS inhibitors 11-13.
General procedure for 2, 3-dihydroxy acids
2, 3-dihydroxy acids were synthesized according to a literature method,[23] Scheme 2a. To a stirred mixture of the corresponding aldehyde (10 mmol) and tris-(trimethylsilyloxy) ethylene (2.9 g, 10 mmol), 1-2 drops of tin (IV) chloride were added (exothermic). After stirring for 3h, 2:2:1 acetic acid/ tetrahydrofuran/water (20 mL) was added. The solutions were stirred for 10 min and solvents were removed under reduced pressure at 50-60°C. Toluene was added and removed, twice. The residues were recrystallized from chloroform/methanol to give the 2,3-dihydroxy acids.
Scheme 2.

General methods for synthesis of a) 2,3-dihydroxy acids; b) 1-hydroxyphosphonic acids; c) 2-hydroxyphosphonic acids.
General procedure for (1-hydroxy)phosphonic acids
1-Hydrophosphonic acids were synthesized according to a literature method,[24] Scheme 2b. To a stirred solution of diethylphosphite (1.4 g, 10 mmol) and triethylamine (1.0 g, 10 mmol), the corresponding aldehyde (10 mmol) was added dropwise, at room temperature. The reaction is exothermic. After addition was complete, the reaction mixture was kept at room temperature overnight. The mixtures were concentrated and the residues purified by using column chromatography on silica (hexane/ethyl acetate) to give the 1-hydroxyalkyl phosphonates, which were then treated with 6M hydrochloric acid (20 equiv.). The resulting solutions were refluxed under N2 for 1-2 days. The reaction mixtures were then concentrated and subjected to high vacuum, yielding the 1-hydroxyphosphonic acids.
General procedure for (2-hydroxy)phosphonic acids
To a solution of diethyl methylphosphonate (152 mg, 1 mmol) in THF (5 ml) was added 1.2 equivalents 1.6 M n-BuLi at −78°C, Scheme 2c. The solution was stirred at the same temperature for 1 h. A solution of corresponding aldehyde (1 mmol) in THF (5 mL) was slowly added. The resulting solution was stirred for 30 min at −78°C and then quenched by the addition of saturated aqueous NH4Cl. The aqueous phase was extracted with Et2O. The combined organic layers were concentrated and the product purified by using column chromatography on silica (hexane/ethyl acetate) to give the 2-hydroxyalkyl phosphonate, which was then treated with 6M hydrochloric acid (20 equiv.). The resulting solution was refluxed under N2 for 1-2 days, concentrated, then subjected to high vacuum, yielding the 2-hydroxyphosphonic acids.
E. coli growth inhibition assay
IC50 values for E. coli cell growth inhibition were determined using a microdilution method. Stationary overnight starter cultures of E. coli (K-12 or BL21 (DE3) strains), were diluted 1000-fold and grown to an OD600 of ~0.3. These log-phase cultures were then diluted 500-fold into fresh LB broth to generate a “working solution”. 200 μL of working solution was transferred into each well of a 96-well culture plate (Corning 3370). Inhibitors were then added at 1 mm and sequentially diluted 3x to 46 nm, keeping volume and culture broth composition constant. Plates were incubated for 12 hours at 37°C, shaking at 200 RPM, then absorbance at 600 nm measured to assess bacterial cell growth. IC50 values were determined using nonlinear regression whereas minimum inhibitory concentration (MIC) values in the synergy assays were calculated by using a Gompertz function in Prism 5 (GraphPad Software, Inc, La Jolla, CA).
Gram-negative bacterial cell growth inhibition assay
As with the E. coli inhibition assays, overnight cultures (in cation-adjusted Mueller-Hinton broth, CAMHB) of A. baumannii (Bouvet and Grimont, ATCC 19606); K. pneumoniae (subsp. Pneumoniae Schroeter Trevisan ATCC 27736); and P. aeruginosa (PA01) were diluted 1000-fold (in fresh CAMHB) to create a “working solution”. Working solutions were then transferred into flat-bottom 96-well plates and inhibitors added at 1 mm and sequentially diluted 3x to 46 nm. Plates were incubated at 37°C, shaking at 200 RPM, overnight. The OD600 was then measured to determine bacterial growth inhibition.
B. subtilis growth inhibition assay
An overnight starter culture (in LB broth) of B. subtilis (subsp. subtilis (Ehrenberg) Cohn ATCC 6051) was diluted 1000-fold (in fresh LB media) to create a “working solution”. Working solutions were then transferred into flat-bottom 96-well plates and inhibitors were added at 1 mm and sequentially diluted 3x to 46 nm. Plates were incubated at 37°C, shaking at 200 RPM overnight. The OD600 was then measured to determine bacterial growth inhibition.
S. aureus growth inhibition assay
An overnight starter culture of S. aureus (Newman strain) in tryptic soy broth was diluted 1000-fold in fresh tryptic soy media to create a “working solution”. Working solutions were transferred into flat-bottom 96-well plates and inhibitors added at 1 mm and sequentially diluted 3x to 46 nm. Plates were incubated at 37°C, shaking at 200 RPM overnight. The OD600 was then measured to determine bacterial growth inhibition.
HEK293 toxicity assay
A frozen stock of human embryonic kidney cells (HEK293 ATCC CRL-1573) was used to grow a first generation of cells in DMEM (4.5 g/L glucose with L-glutamine) containing 10% fetal bovine serum (FBS) and 1% penicillin-streptomycin (10,000 U/ml). This generation was harvested in 0.25 % trypsin/2.1 μM EDTA and cells were counted under a light microscope. A "working solution" was generated containing 105 cells/ml, which was then transferred into a flat-bottom 96-well plate for 36 hours. At this time, 20 μL of inhibitor solutions ranging from 1 mm to 46 nm were added and cells were allowed to grow in the presence of the inhibitors for an additional 24 hours. Then 10 μL of MTT solution (5mg/ml in PBS) was added to each well and incubated for 4 hours. 100 μL of 100 mm HCl in isopropanol was added to each well and absorbance at 570 nm was measured. MIC values were calculated by using a Gompertz function in Prism 5 (GraphPad Software, Inc. La Jolla, USA).
Synergy/Antagonism Assays
In order to investigate possible synergistic interactions between compound 11 and fosmidomycin as well as compound 32 and a range of antibiotics, we carried out two-drug combination assays. Bacteria were incubated with a 3x gradient of antibiotic typically ranging from 40 μg/ml to 18 ng/ml (200 μg/ml to 90 ng/ml for bacitracin, fosfomycin, and sulfamethoxazole) in the presence half-MIC concentrations of 11 and 32, in addition to a 3x gradient of 11 and 32 ranging from 40 μg/ml to 18 ng/ml in the presence of half-MIC concentrations of each antibiotic. New MIC values were calculated by using a Gompertz function in Prism 5 (GraphPad Software, Inc, La Jolla, CA).
Enzyme Inhibition Assays
FPPS, SaUPPS and EcUPPP were expressed and purified as described previously.[3, 5, 9, 10, 12, 19, 22]. FPPS and UPPS assays were carried out using a phosphate release assay.[5, 21] Depending on the solubility, bisphosphonates, hydroxyphosphonates, and dihydroxy-acid inhibitors were prepared as 10 mm stock solutions in DMSO or basic water (pH~10), and then serially diluted from 1 mm to 1 nm. Inhibitors were incubated with 25 ng of SaUPPS at room temperature for 10 minutes in a pH 7.5 buffer (50 mm HEPES, 150 mm NaCl, 10 mm MgCl2, and 0.02% n-dodecyl-β-D-maltopyranoside) before adding “reaction mixture” containing 5 μm FPP, 50 μm IPP, 3 U/ml purine nucleoside phosphorylase, 1 U/ml inorganic phosphatase, and ~600 μm 7-methyl-6-thioguanosine (MESG), again in the same buffer. For FPPS inhibition assay, inhibitors were incubated with 25 ng of various FPPS enzymes at room temperature for 10 minutes in a pH 7.0 buffer (10 mm HEPES, 150 mm NaCl, 5 mm MgCl2) before adding “reaction mixture” containing 50 μm GPP, 50 μm IPP, 3 U/ml purine nucleoside phosphorylase, 1 U/ml inorganic phosphatase, and ~600 μm 7-methyl-6-thioguanosine (MESG), again in the same buffer. FPPS and UPPS reactions were monitored for 15 minutes with the rate of increase in absorbance at 360 nm taken as the rate of FPP or UPP synthesis, respectively. IC50 values were calculated by using Prism 5 (GraphPad Software, Inc, La Jolla, CA). The UPPP inhibition assay was carried out using a malachite-green reagent as described previously.[25] The same 10 mm inhibitor stock solutions and assay buffer as for the SaUPPS assays were used to test for UPPP inhibition. Inhibitors were incubated with 20 nm EcUPPP at room temperature for 15 minutes before adding FPP to 35 μm. Reaction mixtures were incubated at 37°C for 20 minutes, then quenched by adding 30 μl of malachite-green reagent. In this assay, the phosphate released from FPP reacts with ammonium molybdate to form phosphomolybdate (yellow) which then forms a complex (λmax ~ 620 nm) with malachite-green, used to assess phosphatase activity. Phosphate release was measured at 620 nm and quantified based on a phosphate standard curve, and the OD620 values used to construct dose-response curves.
Supplementary Material
Acknowledgements
This work was supported by the United States Public Health Service (NIH grants CA158191 and GM065307), a Harriet A. Harlin Professorship, and the University of Illinois Foundation/Oldfield Research Fund. The authors thank Dr. Robert Schnell and Professor Gunter Schneider for providing the P. aeruginosa FPPS expression system and Professor Douglas Mitchell for providing the bacteria.
Footnotes
Supporting information for this article is available on the WWW under XXXX; enzyme and cell growth inhibition Tables and graphs; isobolograms; synthesis and characterization; HPLC purity results; 1H NMR spectra of inhibitor compounds.
References
- [1].Antibiotic resistance threats in the United States. Executive Summary. 2013 http://www.cdc.gov/drugresistance/pdf/ar-threats-2013-508.pdf.
- [2].a) Oldfield E, Feng X. Trends Pharmacol. Sci. 2014;35:664–674. doi: 10.1016/j.tips.2014.10.007. [DOI] [PMC free article] [PubMed] [Google Scholar]; b) Browm ED, Wright GD. Nature. 2016;529:336–343. doi: 10.1038/nature17042. [DOI] [PubMed] [Google Scholar]
- [3].Leon A, Liu L, Yang Y, Hudock MP, Hall P, Yin F, Studer D, Puan KJ, Morita CT, Oldfield E. J. Med. Chem. 2006;49:7331–7341. doi: 10.1021/jm060492b. [DOI] [PubMed] [Google Scholar]
- [4].Jomaa H, Wiesner J, Sanderbrand S, Altincicek B, Weidemeyer C, Hintz M, Turbachova I, Eberl M, Zeidler J, Lichtenthaler HK, Soldati D, Beck E. Science. 1999;285:1573–1576. doi: 10.1126/science.285.5433.1573. [DOI] [PubMed] [Google Scholar]
- [5].Zhu W, Zhang Y, Sinko W, Hensler ME, Olson J, Molohon KJ, Lindert S, Cao R, Li K, Wang K. Proc. Natl. Acad. Sci. USA. 2013;110:123–128. doi: 10.1073/pnas.1219899110. [DOI] [PMC free article] [PubMed] [Google Scholar]
- [6].Farha MA, Czarny TL, Myers CL, Worrall LJ, French S, Conrady DG, Wang Y, Oldfield E, Strynadka NC, Brown ED. Proc. Natl. Acad. Sci. USA. 2015;112:11048–11053. doi: 10.1073/pnas.1511751112. [DOI] [PMC free article] [PubMed] [Google Scholar]
- [7].Feng X, Zhu W, Shurig-Briccio LA, Linder S, Shoen C, Hitchings R, Li J, Wang Y, baig N, Zhou T, Kim BK, Cric DC. Proc. Natl. Acad. Sci. USA. 2015;112:E7H073–E7082. doi: 10.1073/pnas.1521988112. [DOI] [PMC free article] [PubMed] [Google Scholar]
- [8].Widler L, Jaeggi KA, Glatt M, Muller K, Bachmann R, Bisping M, Born A-R, Cortesi R, Guiglia G, Jeker H, et al. J. Med. Chem. 2002;45:3721–3738. doi: 10.1021/jm020819i. [DOI] [PubMed] [Google Scholar]
- [9].Cao R, Chen CK, Guo RT, Wang AH, Oldfield E. Proteins. 2008;73:431–439. doi: 10.1002/prot.22066. [DOI] [PMC free article] [PubMed] [Google Scholar]
- [10].Ziniel PD, Desai J, Cass CL, Gatto C, Oldfield E, Williams DL. Antimicrob. Agents Chemother. 2013;57:5969–5976. doi: 10.1128/AAC.00699-13. [DOI] [PMC free article] [PubMed] [Google Scholar]
- [11].Song Y, Chan JM, Tovian Z, Secrest A, Nagy E, Krysiak K, Bergan K, Parniak MA, Oldfield E. Bioorg. Med. Chem. 2008;16:8959–8967. doi: 10.1016/j.bmc.2008.08.047. [DOI] [PMC free article] [PubMed] [Google Scholar]
- [12].Xia Y, Liu YL, Zie Y, Zhu W, Guerra F, Shen S, yeddule N, Fischer W, Low W, Zhou X, Zhang Y, Oldfield E, Verma IM. Sci. Transl. Med. 2014;6:263ra161. doi: 10.1126/scitranslmed.3010382. [DOI] [PMC free article] [PubMed] [Google Scholar]
- [13].Mukherjee S, Huang C, Guerra F, Wang K, Oldfield E. J. Am. Chem. Soc. 2009;131:8374–8375. doi: 10.1021/ja902895p. [DOI] [PMC free article] [PubMed] [Google Scholar]
- [14].a) Eliopoulos GM, Moellering RC. In: Antibiotics in Laboratory Medicine. Lorian V, editor. Williams & Wilkins Publishing Co.; 1998. pp. 330–396. [Google Scholar]; b) Singh PK, Tack BF, McCray PB, Welsh MJ. Am. J. Physiol. Lung Cell Mol. Physiol. 2000;279:799–805. doi: 10.1152/ajplung.2000.279.5.L799. [DOI] [PubMed] [Google Scholar]
- [15].European Committee for Antimicrobial Susceptibility Testing (EUCAST) Clin. Microbiol. Infect. 2000;6:503–508. doi: 10.1111/j.1469-0691.2006.01454.x. [DOI] [PubMed] [Google Scholar]
- [16].Berenbaum MC. Pharmacol. Rev. 1989;41:93–141. [PubMed] [Google Scholar]
- [17].a) Fisher JE, Rogers MJ, Halasy JM, Luckman SP, Hughes DE, Masrachia PJ, Wesolowski G, Russell RG, Rodan GA, Reszka AA. Proc. Natl. Acad. Sci. USA. 1999;96:133–138. doi: 10.1073/pnas.96.1.133. [DOI] [PMC free article] [PubMed] [Google Scholar]; b) van Beek E, Lowik C, van der Plujim G, Papapoulos S. J. Bone. Miner. Res. 1999;14:722–729. doi: 10.1359/jbmr.1999.14.5.722. [DOI] [PubMed] [Google Scholar]
- [18].Schmidberger JW, Schnell R, Schneider G. Acta. Cryst. D Biol. Cryst. 2015;71:721–731. doi: 10.1107/S1399004715001121. [DOI] [PMC free article] [PubMed] [Google Scholar]
- [19].Flint DH, Nudelman A. Bioorg. Chem. 1993;21:367–385. [Google Scholar]
- [20].Hsu MF, Yu TF, Chou CC, Fu HY, Yang CS, Wang AH. PloS One. 2013;8:e56363. doi: 10.1371/journal.pone.0056363. [DOI] [PMC free article] [PubMed] [Google Scholar]
- [21].a) Hartley MD, Larkin A, Imperiali B. Bioorg. Med. Chem. 2008;16:5149–5156. doi: 10.1016/j.bmc.2008.03.025. [DOI] [PMC free article] [PubMed] [Google Scholar]; b) Webb MR. Proc. Natl. Acad. Sci. USA. 1992;89:4884–4887. doi: 10.1073/pnas.89.11.4884. [DOI] [PMC free article] [PubMed] [Google Scholar]
- [22].Chang HY, Chou CC, Hsu MF, Wang AH. J. Biol. Chem. 2014;289:18719–18735. doi: 10.1074/jbc.M114.575076. [DOI] [PMC free article] [PubMed] [Google Scholar]
- [23].Wissner A. Synthesis. 1979;1:27–28. [Google Scholar]
- [24].Maier L, Sporri H. Phosphorus, Sulfur, Silicon Relat. Elem. 1992;70:39–48. [Google Scholar]
- [25].Baykov AA, Evtushenko OA, Avaeva SM. Anal. Biochem. 1988;171:266–270. doi: 10.1016/0003-2697(88)90484-8. [DOI] [PubMed] [Google Scholar]
Associated Data
This section collects any data citations, data availability statements, or supplementary materials included in this article.