Abstract
Alzheimer's disease (AD) is a progressive neurodegenerative disease affecting millions of people worldwide. AD is characterized by the presence of extracellular plaques composed of aggregated/oligomerized β-amyloid peptides with Aβ42 peptide representing a major isoform in the senile plaques. Given the pathological significance of Aβ42 in the progression of AD, there is considerable interest in understanding the structural ensembles for soluble monomer and oligomeric forms of Aβ42. This report describes an efficient method to express and purify high quality 15N isotope-labeled Aβ42 for structural studies by NMR. The protocol involves utilization of an auto induction system with 15N isotope labeled medium, for high-level expression of Aβ42 as a fusion with IFABP. After the over-expression of the 15N isotope-labeled IFABP-Aβ42 fusion protein in the inclusion bodies, pure 15N isotope-labeled Aβ42 peptide is obtained following a purification method that is streamlined and improved from the method originally developed for the isolation of unlabeled Aβ42 peptide (Garai et al., 2009). We obtain a final yield of ∼6 mg/L culture for 15N isotope-labeled Aβ42 peptide. Mass spectrometry and 1H–15N HSQC spectra of monomeric Aβ42 peptide validate the uniform incorporation of the isotopic label. The method described here is equally applicable for the uniform isotope labeling with 15N and 13C in Aβ42 peptide as well as its other variants including any Aβ42 peptide mutants.
Keywords: Alzheimer's disease, Amyloid β, Fatty acid binding protein, Expression, HSQC
1. Introduction
Alzheimer's disease (AD) is a progressive neurodegenerative disease affecting millions of people worldwide and an estimated 5.3 million people in the United States, which is projected to increase dramatically to nearly 14 million in 2050 [1]. One of the pathological hallmarks of AD is the presence of extracellular protein plaques composed of aggregated/oligomerized β-amyloid peptides of varying length (39–43), with isoform Aβ42 (β-amyloid peptide of 42 residues) being the predominant component of the senile plaques [2–4]. The β-amyloid peptides are products of sequential proteolytic cleavages of amyloid precursor protein (APP), a transmembrane protein of 695–770 amino acids, by β-and γ-secretases [5,6]. Given the pathological significance of Aβ42 peptides in progression of AD, much effort has gone into understanding the detailed mechanism of amyloid formation, elucidating the structure of the toxic species involved, and deciphering the cellular mode of action during the progression of AD.
Progress in understanding the disease state has been slowed in part by the difficulty of conducting biophysical studies for determining the structural ensembles for the soluble monomer and oligomeric forms of Aβ [7,8]. Since the soluble forms of Aβ are intrinsically disordered peptides (IDPs), solution NMR [9,10] is one of the primary experimental tools for characterization as X-ray crystallography and solid-state NMR [11-13] cannot be applied to the disordered state. One drawback of NMR studies is that it requires a relatively large amount (milligram quantities) of material, and furthermore greatly benefits from isotope-labeling that would provide better resolved and cleaner interpretation of the structural ensemble. Although unlabeled Aβ peptides have been prepared by solid-phase peptide synthesis (SPPS) [14,15], the high cost of the isotopic-labeled amino acid reagents makes this impractical for uniformly isotope-labeled peptides.
As an alternative several groups have designed recombinant expression systems to express Aβ peptides directly [16], or as a fusion with a variety of other stable proteins to improve the solubility and stability of the expressed peptide. For example Aβ has been expressed linked to the surface binding protein from Plasmodium falsiparum [17], ubiquitin [18], maltose binding protein [19], glutathione S-transferase [20], hen egg lysozyme [21] or intestinal fatty acid binding protein (IFABP) [22], with varying success on increasing Aβ yields. In this work we have applied the expression system developed in Frieden laboratory [22] for its simplicity and better yield, as well as adopting and further optimizing the auto induction protocol developed by Studier [23] to efficiently express 15N isotope-labeled Aβ42 peptide. In this work we have streamlined and improved this purification protocol [22] resulting in significant increases in the recovery of pure 15N isotope-labeled Aβ42 peptide. Good quality HSQC spectra of monomeric Aβ42 peptide have been obtained, validating the uniform incorporation of the isotopic label. The method described here is equally applicable for the uniform isotope labeling with 13C as well as other mutant variants of the Aβ42 peptide.
2. Materials and methods
2.1. Materials
Both host Escherichia coli cells (MG1655) and fusion protein (IFABP-Aβ42) plasmid (pQE-80L IFABP-Aβ) were provided to us from Prof. Carl Frieden (Department of Biochemistry and Molecular Biophysics, Washington University School of Medicine, St. Louis, MO 63110, USA). 15NH4Cl was purchased from Cambridge Isotope Laboratories, Inc. Other reagents used in the expression and purification were of reagent grade, obtained from either Fisher Scientific or VWR International. Bovine Factor Xa was purchased from Haematologic Technologies Inc. (Essex Junction, Vermont).
2.2. Expression of 15N isotope-labeled IFABP-Aβ42 fusion protein
The plasmid encoding the fusion protein (pQE-80L IFABP-Aβ) was used to transform the host MG1655 cells, which were grown at 37 °C on a LB agar plate containing 100 μg/mL ampicillin for ∼15–16 h. A single colony was selected and grown in 2 mL LB containing 100 μg/mL ampicillin at 37 °C (overnight) with constant shaking as a starter culture. A 1 mL sample of this overnight culture is used to inoculate 250 mL minimal medium (Studier's recipe, MGD 50 mM phosphate) [23] with 100 μg/mL ampicillin and incubated for 8 h at 37 °C. The culture was harvested and the harvested cells were re-suspended in 1 L of 15N isotope-labeled auto induction minimal medium (Studier's recipe MD-5052; with 15NH4Cl being the sole source of nitrogen) [23] and incubated with shaking at 37 °C. After 12–13 h of incubation, the cells were harvested by centrifugation at 8000 rpm for 20 min. Approximately 3.8 g of wet cells were routinely obtained from a 1 L culture.
2.3. Isolation of 15N isotope-labeled IFABP-Aβ42 fusion protein
The cell pellet from 1 L culture was re-suspended in 70 mL of ice-cold native buffer (20 mM Tris–Cl, 100 mM NaCl, pH 7.4) and sonicated on ice for 2 min with 0.5 s on and 1 s off cycle having power level 6 on Misonix 3000 sonicator (Misonix, Farmingdale, NY). The sonication cycle was repeated once after 5 min of cooling on ice. The cell lysate was then centrifuged for 20 min at 20,000 rpm and the supernatant (soluble lysate) was discarded. The pellet was washed with 25 mL of native buffer making sure that the pellet was fully re-suspended in the buffer followed by the centrifugation at 20,000 rpm. The washing step was repeated with another 25 mL of native buffer. The centrifuged pellet was then re-suspended in 50 mL urea buffer (8 M urea, 10 mM Tris–Cl, 100 mM NaPi, pH8.0) with stirring for 1.5 h at room temperature. The solution mixture was centrifuged twice at 20,000 rpm for 20 min and the supernatant was passed through a Ni–NTA affinity column (HisPur Ni–NTA resin, Thermo Scientific; 10 mL resin) pre-equilibrated in urea buffer. The column with the bound fusion protein was washed with 30–40 mL urea buffer followed by another washing with 70 mL of binding buffer (20 mM NaPi, 500 mM NaCl, 30 mM imidazole, pH 7.4). Finally the bound IFABP-Aβ42 fusion protein was eluted from the column with 26 mL of elution buffer (20 mM NaPi, 500 mM NaCl, 500 mM imidazole, pH 7.4). The eluted fusion protein was thoroughly dialyzed into native buffer (Factor Xa cleavage buffer; 20 mM Tris–Cl, 100 mM NaCl, pH 7.4) and the absorbance recorded at 280 nm to estimate the concentration of IFABP-Aβ42 fusion. IFABP-Aβ42 fusion sequence was used to calculate the extinction coefficient of 18,450 (meaning a fusion protein solution of 1 mg/mL would show an absorbance of 0.869) in Protparam [24]. The fusion had an absorbance (at 280 nm) of 1.35 giving the concentration as 1.55 mg/mL A total of ∼40 mg of fusion protein was isolated from 1 L of culture.
2.4. Factor Xa cleavage of IFABP-Aβ42 fusion protein
The Factor Xa cleavage reaction set up was slightly different from the previous published protocol for IFABP-Aβ42 fusion [22]. We determined that the fusion could be cleaved optimally at 0.8 mg/mL without any obvious complications. The fusion protein was diluted to 0.8 mg/mL in native buffer supplemented with 2 mM CaCl2 and 1 mM DTT. The cleavage reaction was initiated by adding Factor Xa (Hematologic Technologies Inc., USA), 8 μg of Factor Xa per mg of the fusion, and the cleavage reaction incubated with stirring at room temperature. The cleavage reaction solution slowly turned turbid and white precipitate was clearly visible after overnight (∼16 h) incubation, after which the Factor Xa cleavage reaction appeared complete. As Aβ42 peptide aggregated as a precipitate during the cleavage reaction we did not feel any need to inhibit Factor Xa reaction. At this point the cleavage solution was centrifuged and the precipitate collected.
2.5. SDS–PAGE analysis
15% SDS–PAGE was performed using Tris–Glycine SDS running buffer (Bio-Rad, USA). Samples from various steps of the purification were loaded in the gel and run for 50 min at 200 V in a Mini-Protean 3 system (Bio-Rad, USA). The gels were stained for 20–30 min in Coomassie blue stain followed by destaining in a mixture of 15% methanol and 10% acetic acid solution.
2.6. HPLC purification
The aggregated precipitate obtained after the Factor Xa reaction of the IFABP-Aβ42 fusion was next solubilized in urea buffer. The precipitate was treated with 2 batches of 2 mL of urea buffer. This urea soluble component was loaded into a mini Ni–NTA affinity column (300 μL resin) pre-equilibrated with the urea buffer, centrifuged gently at 1000 rpm and the flow through was collected. In order to make sure that almost all of Aβ42 peptide was recovered from the column an extra 0.5 mL of urea buffer was added followed by the centrifugation. A 1.5 mL portion of the recovered urea soluble component was loaded in the RP-HPLC column (Vydac, Protein and peptide C18; 5 μm, 10 mm i.d. × 250 mm; cat#218TP510). The column flow rate was set at 4 mL/min and the solvents used in the purification are Solvent A (0.1% trifluoroacetic acid in water) and Solvent B (0.08% trifluoroacetic acid in acetonitrile). The column was washed for 7 min with 25% B followed by the elution of the bound peptide with a gradient from 25% to 70% B in 25 min. Aβ42 peptide was eluted as a broad peak and the fractions containing Aβ-42 peptide were lyophilized. The remaining 3 mL of the urea soluble components were purified in two separate batches. The lyophilized powder was stored in −80 °C. A small portion of the lyophilized Aβ42 peptide dissolved in acetonitrile was injected into electrospray ionization (ESI) mass spectrometer. The m/z spectrum were recorded from 600 to 1800 Da and analyzed in positive ion mode.
2.7. Solution NMR spectroscopy
The sample used for the NMR experiments was prepared based on the protocol suggested in the previous studies [9]. The lyophilized 15N isotope-labeled Aβ42 peptide of 0.6 mg was first dissolved in 60 μL of 10 mM NaOH followed by 2 min of sonication in a water bath. The mixture was then diluted in 540 μL of sodium phosphate buffer containing 10% D2O with final buffer composition as 20 mM NaPi, 0.5 mM EDTA, 0.05 mM NaN3, pH 7.2. The solution was centrifuged at 20,000 rpm for 10 min at 4 °C to remove any precipitate before the NMR experiments. The 2D 1H/15N HSQC experiments were performed on a Bruker Avance II 900 MHz spectrometer equipped with a TCI cryoprobe at 10 °C and the resulting spectra were processed using NMRpipe [25].
3. Results
15N isotopic-labeled Aβ42 peptide was expressed following Studier's protocol [23] with some modifications, and the expressed Aβ42 peptide was isolated following a protocol modified from the purification method developed in Frieden laboratory [22]. An outline of the steps involved in the expression of IFABP-Aβ42 fusion and the purification of isotope-labeled Aβ42 peptide is illustrated in Fig. 1 and the summary of the purification steps are listed in Table 1. In short, the host cells transformed with plasmid pQE-80L IFABP-Aβ42 was used for the expression of 15N isotope-labeled Aβ42 as a fusion with IFABP as described in Section 2. After the cells were induced to overproduce the IFABP-Aβ42 fusion protein, the cells were harvested, lysed through sonication, and the expressed fusion peptide was isolated following Ni–NTA affinity column chromatography. Factor Xa was then used to cleave the fusion into the Aβ42 peptide, which then precipitated. Precipitated peptide was then solubilized in urea, and finally the Aβ42 peptide was purified following reverse-phase HPLC.
Fig. 1.
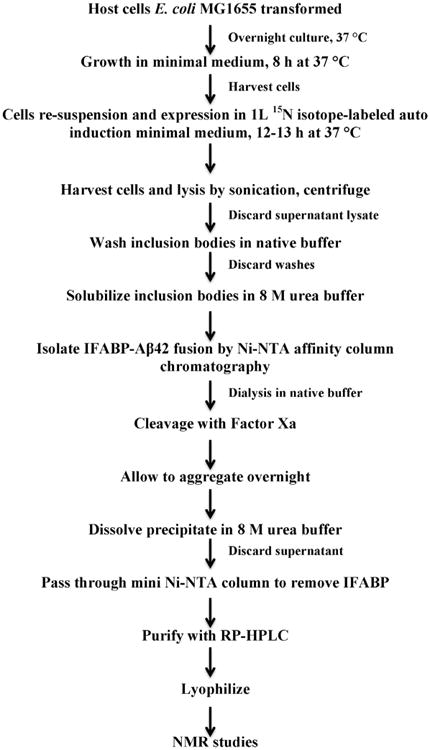
A flow chart of expression and purification of Aβ42 peptide from E. coli.
Table 1.
Summary of 15N isotope-labeled Aβ42 purification from 1 L E. coli culture in auto induction minimal medium.a,b
| Purification steps | Volume (mL) | IFABP-Aβ42 fusion (mg) | Aβ-42 (mg) | % Recovery |
|---|---|---|---|---|
| Inclusion bodies dissolved in urea buffer (urea soluble portion) | 50 | ND | ND | ND |
| Ni–NTA column chromatography | 26 | 40 | 8.6c | 100d |
| Factor-Xa cleavage | 50 | 40 | 8.6c | ND |
| Overnight precipitation dissolved in urea buffer | 4 | – | 8.6c,e | ND |
| Mini Ni–NTA column chromatography | 4.5 | ND | ND | ND |
| HPLC (C18 reverse-phase) | 120 | ND | 6 | 70 |
3.8 g of wet cells harvested from 1 L culture.
Fusion protein (IFABP-Aβ42) represents about 32% of the expressed protein in bacterial lysate (soluble plus inclusion bodies) when estimated from the band intensity in ImageJ [26].
The amount of Aβ42 is calculated from mass ratio of Aβ42 and the IFABP-Aβ42 fusion protein.
The amount of fusion protein isolated from the affinity column was assumed 100% of the fusion protein in the bacterial lysate that can be isolated.
The precipitate and subsequent urea soluble component are expected to contain the full amount of Aβ-42 initially present. ND Not determined.
Fig. 2 shows SDS–PAGE results for the individual steps involved in the purification of the Aβ42 peptide. As seen from the Fig. 2, there is a considerable protein band of approximate molecular mass of 21 kDa, corresponding to the size of the IFABP-Aβ42 fusion protein, in the lanes representing the expressed cells and the inclusion bodies (pellet of the cell extract after cell lysis). An examination of the intensity of the protein bands with ImageJ [26] software suggests that the IFABP-Aβ42 fusion protein band represents approximately 32% of all the protein bands in the expressed cells. The soluble supernatant (lysate) and the two successive washes of inclusion bodies have prominent protein band slightly shorter than the fusion protein and appears to be a fragment of the IFABP-Aβ42 fusion protein (discussed below). This same band is also apparent in the lane representing cell expression (lane 2; Fig. 2). The soluble supernatant fractions were discarded as they lack the fusion protein band and the inclusion body material containing expressed fusion (lane 6; Fig. 2) was washed twice with the lysis buffer, dissolved in 8 M urea buffer (lane 8; Fig. 2) and then used to isolate fusion protein using Ni–NTA column chromatography. After affinity chromatography roughly 40 mg of the IFABP-Aβ42 fusion protein was isolated (Table 1) showing prominent protein band in SDS–PAGE (lane 11; Fig. 2).
Fig. 2.
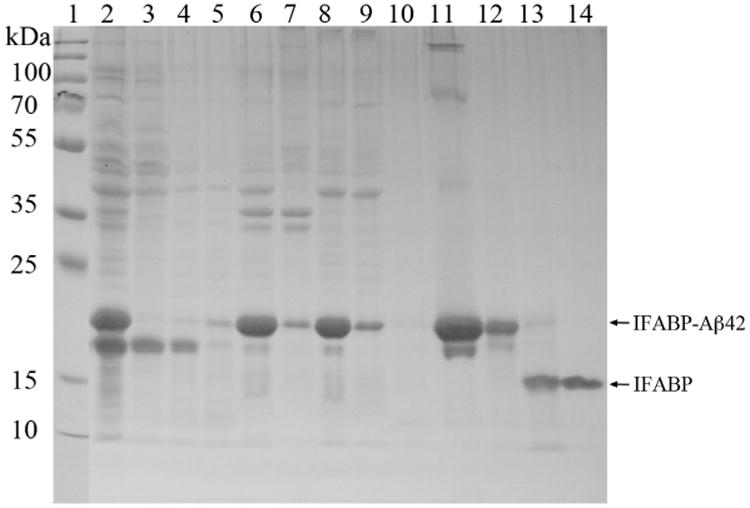
15% SDS–PAGE analysis of the expression and purification of Aβ42 peptide. Lane 1, Molecular weight marker (PageRuler Plus prestained protein ladder, Cat# 26619); lane 2, expression of IFABP-Aβ42 fusion peptide (harvested cells from 20 μL culture); lane 3, supernatant (soluble lysate) after cell lysis (supernatant from 4 μL of total lysate); lane 4, inclusion bodies wash 1 (8 μL); lane 5, inclusion bodies wash 2 (8 μL); lane 6, inclusion bodies (pellets from 4 μL of total lysate); lane 7, urea-insoluble inclusion bodies (comparable volume); lane 8, urea-soluble inclusion bodies (4 μL); lane 9, Ni–NTA affinity column flow through (4 μL); lane 10, binding buffer wash (8 μL); lane 11, Ni–NTA affinity column elution (eluted fusion protein, 8 μL); lane 12, factor Xa cleavage reaction set up (8 μL); lane 13, factor Xa cleavage reaction at 6 h (8 μL); lane 14, factor Xa cleavage reaction overnight (8 μL).
It is also evident that the isolated fusion protein does have faint protein bands at higher molecular mass possibly representing oli-gomers as a result of the higher concentration of the fusion protein in the sample. These higher oligomeric bands disappear after dialysis followed by dilution in Factor Xa cleavage buffer (lane 12; Fig. 2). This was one of the prominent differences in our purification and that of an earlier protocol from Frieden [22]. Through this modification we were able to eliminate the need for the time-consuming size-exclusion chromatography and able to minimize the corresponding loss of the fusion protein. The fusion protein that was thoroughly dialyzed in Factor Xa buffer (lane 12; Fig. 2) was subjected to Factor Xa cleavage at room temperature for overnight at which the cleavage appears to be complete judging from the SDS–PAGE and the resulting Aβ42 peptide, the product of Factor Xa cleavage of the IFABP-Aβ42 fusion protein, aggregates as a precipitate. During the Factor Xa cleavage reaction the protein band at appropriate mass of 21 kDa (lane 12, Fig. 2) corresponding to the fusion protein gradually disappears and a new band appears at approximate mass of 16 kDa (lanes 13 and 14; Fig. 2), corresponding to the (His)6-IFABP protein fraction of the IFABP-Aβ42 fusion protein. We did not notice any non-specific cleavage by Factor Xa even allowing the cleavage reaction to proceed for overnight as SDS–PAGE shows a single protein band (lanes 14; Fig. 2), eliminating the need for a Factor Xa inhibitor. The Aβ42 peptide is not visualized in the SDS–PAGE lanes corresponding to the Factor Xa reactions (lanes 13 and 14; Fig. 2) possibly due to the combination of it being insoluble in the buffer as a result precipitating as it appears after Factor Xa cleavage and being smaller in size and very low in concentration, insufficient to be stained properly.
The precipitate obtained after the Factor Xa cleavage reaction contains Aβ42 along with aggregated IFABP and any other precipitated small peptides from the Factor Xa cleavage of the truncated fusion protein. Initially we dissolved the precipitate in urea buffer and purified it by reverse-phase HPLC with the fraction collected based on the peaks observed at 215 nm during HPLC run. This material was lyophilized, and then subjected to mass spectrometry. To our surprise the mass spectrum of the lyophilized material (not shown) contained both IFABP and Aβ42, indicating that the reverse-phase HPLC column was unable to separate them. This led us to devise a method to separate IFABP from the solution of the precipitate in urea buffer. Since the IFABP contains an N-terminal 6-histidine tag, we subjected the precipitate dissolved in urea buffer to a small Ni–NTA affinity column. This step completely removed IFABP from the mixture and the resulting urea soluble component (with IFABP-removed) was subjected to further purification by reverse-phase HPLC (Fig. 3) using a semi-preparative C18 column. A 25–70% acetonitrile gradient yielded a broad Aβ42 peptide peak. Since Aβ42 peptide does not have any tryptophans and only contains a single tyrosine residue, it has a very weak absorbance at 280 nm, however it shows a strong signal at 215 nm due to the absorbance by the peptide bond. Therefore, the signature of the Aβ42 peptide in the HPLC is the strong absorbance at 215 nm with little or no corresponding absorbance at 280 nm.
Fig. 3.
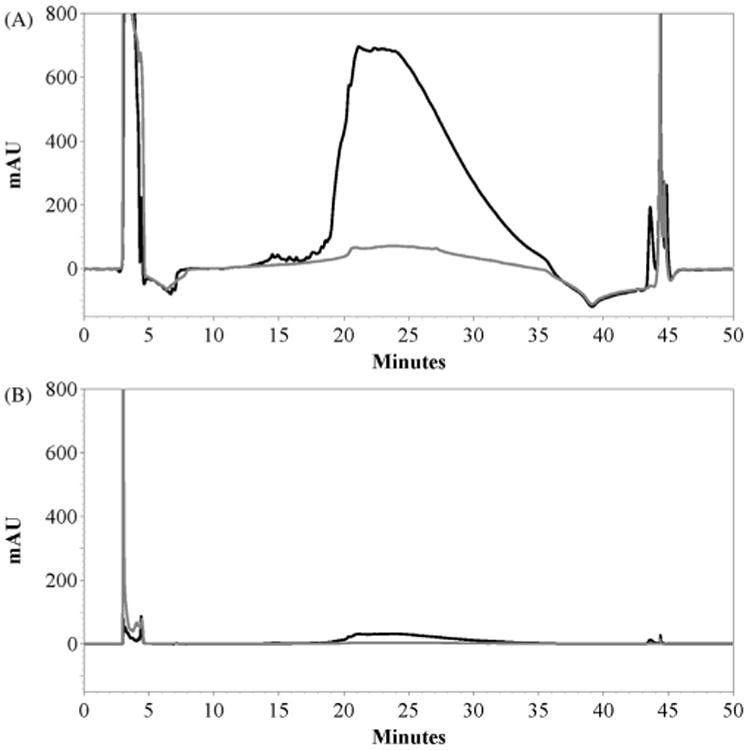
Reverse-phase HPLC purification of 15N isotope-labeled Aβ42 peptide. Black trace representing 15N Aβ42 peptide sample and gray representing blank urea-buffer. (A) HPLC chromatogram monitored at 215 nm. (B) HPLC chromatogram monitored at 280 nm. Elution fractions from 19 min to 29 min were pooled together and lyophilized.
The fractions corresponding to the Aβ42 peptide were collected and lyophilized. The identity of the purified 15N isotope-labeled Aβ42 peptide was confirmed by mass spectrometry (Fig. 4A and B). The ESI mass spectrum of 15N isotope-labeled Aβ42 peptide in positive mode shows a distribution of the multiple charged species ranging from +3 to +6. The isotope distribution of one such multiply charged species (+4) is shown in Fig. 4B (top panel). The isotope distribution of this peak matches the theoretical peak distribution for the +4 charged species from 15N isotope-labeled Aβ42 by Xcaliber mass analysis (Fig. 4B; bottom panel). Similarly, a deconvolution of all the peaks in Fig. 4A leads to the mass of 4568 matching the theoretical mono-isotopic mass of the 15N isotope-labeled Aβ42 (Fig. 4C). It is evident from the mass spectrum that the 15N isotope-labeled Aβ42 peptide is essentially pure. We obtained approximately 6 mg of 15N isotope-labeled Aβ42 peptide following this purification protocol (Table 1).
Fig. 4.
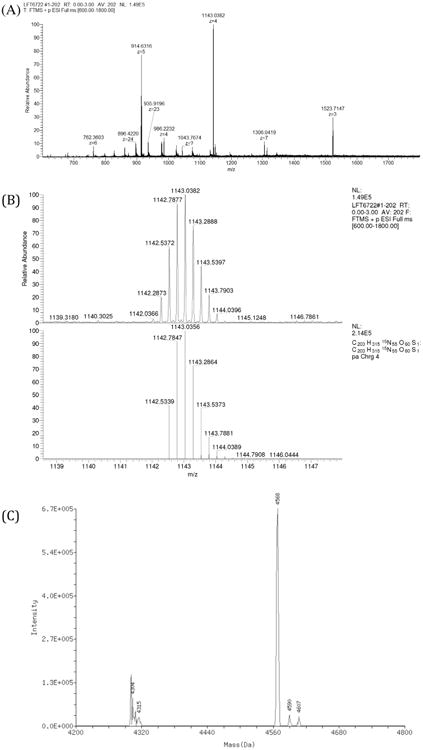
An ESI mass spectrum of the HPLC-purified 15N Aβ42 peptide in positive ion mode. (A) Full spectrum depicting various charge states of 15N isotope-labeled Aβ42 peptide. (B) Isotopic distribution of +4 charged species (top panel) and theoretical simulation of +4 charged species generated from 15N Aβ42 peptide in Xcaliber (bottom panel). (C) A deconvolution of the peaks from full spectrum to generate monoisotopic mass of the 15N Aβ42 peptide.
We also examined the NMR spectrum of the 15N isotope-labeled Aβ42 peptide. The monomeric Aβ42 peptide showed a well-dispersed HSQC spectrum (Fig. 5), which is consistent with the spectra reported previously for the 15N isotope-labeled Aβ42 peptide obtained from solid state synthesis [9]. The signal assignments were based on previous studies (BioMagResBank accession number BMRB-17794), and the chemical shifts of Met 35 and Val 36 indicate that the peptide has Met 35 in the reduced state.
Fig. 5.
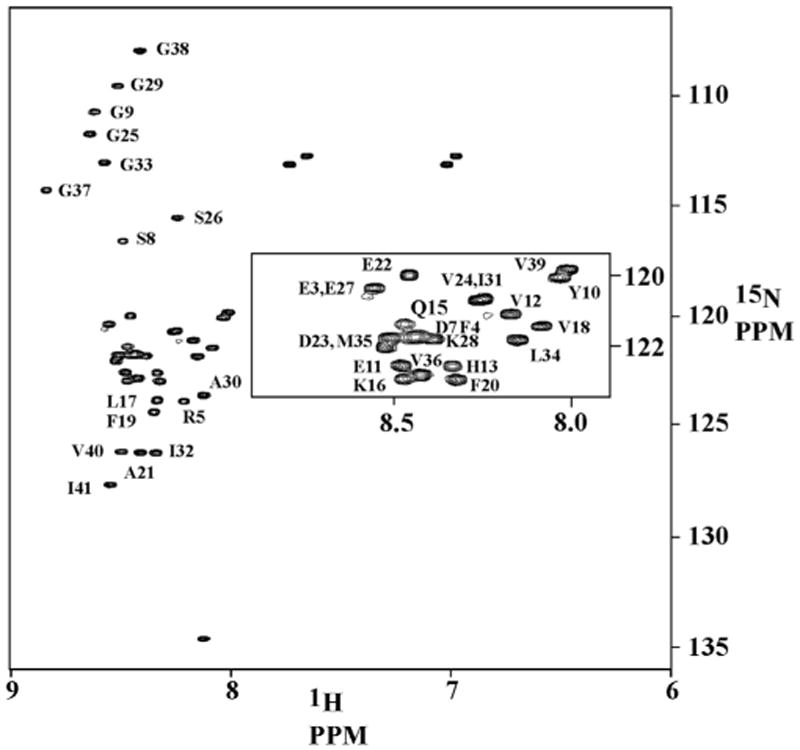
1H–15N HSQC spectrum of 15N labeled Aβ42 peptide in phosphate buffer pH 7.2 at 285 K. Assignments are based on comparison with reported chemical shifts [9]. D23 and M35, as well as D7, F4, and K28 could not be assigned conclusively, due to extensive overlap and small shifts in the peak positions, compared to the reported chemical shifts.
4. Discussion
The objective of this work is to establish an efficient protocol for the milligram-scale preparation of uniformly 15N isotope-labeled Aβ42 peptide for NMR studies. Because of the prohibitive cost of the chemically synthesized 15N isotope-labeled Aβ42 peptide, bacterial expression and purification is a highly desirable alternative. Frieden and co-workers [22] reported that the Aβ42 peptide could be stably expressed as a fusion with IFABP, and the inclusion bodies of fusion protein can be subsequently dissolved in guanidine hydrochloride for further purification, giving a moderate yield (∼3 mg/L culture) of unlabeled Aβ42 peptide. We built on the Frieden lab purification protocol by streamlining as well as improving the yield of Aβ42 peptide. As a trial for expressing isotope-labeled Aβ42 peptide, we initially tried minimal media with IPTG induction but that led to the formation of a much larger ratio of the truncated protein band to the intact fusion protein (data not shown). The truncated protein does bind to the Ni–NTA affinity column indicating the presence of an intact N-terminal histidine tag, suggesting the shorter version arises from truncation somewhere along the fusion protein. Mass spectral analysis of the fusion protein containing the truncated protein band confirmed this hypothesis, showing a mass of 19,041 Da (Fig. 6) for the truncated fusion. Altogether, based on the mass of the truncated fusion and considering the sequence of the fusion protein, the data suggest that truncation occurs after the 19th residue (Phe) of the Aβ42 peptide. We do not know the source of this fusion protein truncation, as it could be due to either an inadvertent stop during the protein synthesis or a result of a protease activity thereafter.
Fig. 6.
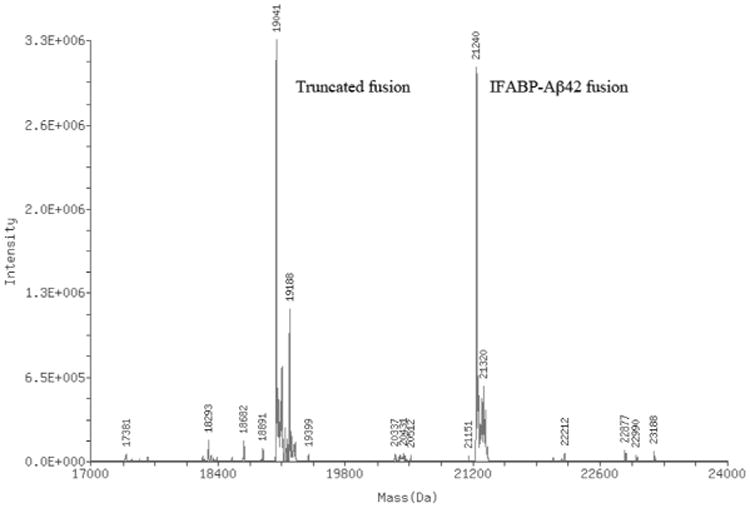
An ESI mass spectrum of Ni–NTA affinity chromatography purified mixture containing both IFABP-Aβ42 fusion and the truncated fusion. The full-length fusion has the theoretical molecular mass of 21140.9 and the truncated fusion has theoretical molecular mass of 19041.3 (if assumed truncation after position 19 of the Aβ42 peptide).
Next we tried the auto induction system with 1000-fold dilution of cells into auto induction medium (cells from 1 mL culture diluted into 1 L) and culturing for a longer period of time, but that also led to behavior similar to that encountered with IPTG induction. During the trials it became evident that the smaller dilutions (2.5–20-fold) of the cells in auto induction medium coupled with the shorter culture time gave better yields for the full-length fusion. An optimum yield of the full-length fusion protein was observed when the dilution of the cells into auto induction medium was kept at only 3–4-fold followed by the incubation of culture for 10–13 h at 37 °C.
The method we employed for the purification of both the IFABP-Aβ42 fusion and Aβ42 peptide are different from the previous protocol from Frieden and co-workers [22]. We also took notice that the truncated fusion appeared soluble in the native buffer, and as a result we used a larger volume of the native buffer during the cell lysis as well as for the washing of the insoluble cell pellet (inclusion bodies) to remove as much of the truncated fusion protein as possible before proceeding with the affinity purification. The SDS–PAGE analysis of the purification steps (Fig. 2) shows the removal of much of the truncated fusion when compared the lanes corresponding to the expression, soluble lysate, successive washes of the cell pellet and the inclusion bodies. After the isolation of the fusion protein and subsequent dialysis in native buffer, the Factor Xa cleavage reaction was performed at 0.8 mg/mL of the fusion, nearly double the concentration of the previous protocol [22]. Our optimized protocol uses a slightly lower concentration of Factor Xa/mg of the fusion protein and no inhibitors were used to inhibit the Factor Xa cleavage reaction. After incubation overnight to let Aβ42 peptide aggregate as a precipitate, the precipitate was then dissolved in urea buffer and subjected to a small Ni–NTA column to remove IFABP fragments from the Aβ42 peptide followed by RP-HPLC purification. During RP-HPLC purification in C18 column Aβ42 peptide elutes as a broad peak (Fig. 3A). This is not surprising especially considering that the Aβ42 peptide is highly hydrophobic. However, the peak sharpness can be expected to improve when a steep acetonitrile gradient is employed during the HPLC purification. Alternatively, using a C4 reverse-phase column, being less hydrophobic than C18, might help reduce the broadness of the peak.
The protocol described here provides high purity 15N isotope-labeled Aβ42 peptide as evident from the mass spectrum data (Fig. 4) and subsequent HSQC of the 15N isotope-labeled Aβ42 peptide (Fig. 5). It should be noted that this purification protocol could be equally applicable for the uniform labeling of 15N and 13C in Aβ42 peptide as well as to its other variants including the mutants.
Acknowledgments
We thank Dr. Zhongrui Zhou, QB3/Chemistry Mass Spectrometry Facility UC Berkeley, for the assistance with Mass spectroscopy. Funds for the 900 mHz spectrometer were provided by National Institutes of Health (NIH), USA through Grant GM68933.
Abbreviations
- AD
Alzheimer's disease
- Ab
Alzheimer's β-amyloid peptide
- IDP
intrinsically disordered peptide
- IFABP
intestinal fatty acid binding protein
- LB
lysogeny broth
- DTT
dithiothreitol
- SDS-PAGE
sodium dodecyl sulfate polyacrylamide gel electrophoresis
- HPLC
high-performance liquid chromatography
- ESI
electrospray ionization
- NMR
nuclear magnetic resonance
- HSQC
heteronuclear single quantum correlation
References
- 1.2015 http://www.alz.org/facts/downloads/facts_figures_2015.pdf.
- 2.Hardy J, Selkoe DJ. The amyloid hypothesis of Alzheimer's disease: progress and problems on the road to therapeutics. Science. 2002;297:353–356. doi: 10.1126/science.1072994. http://dx.doi.org/10.1126/science.1072994. [DOI] [PubMed] [Google Scholar]
- 3.Simmons LK, May PC, Tomaselli KJ, Rydel RE, Fuson KS, Brigham EF, Wright S, Lieberburg I, Becker GW, Brems DN. Secondary structure of amyloid beta peptide correlates with neurotoxic activity in vitro. Mol Pharmacol. 1994;45:373–379. [PubMed] [Google Scholar]
- 4.Iversen LL, Mortishire-Smith RJ, Pollack SJ, Shearman MS. The toxicity in vitro of beta-amyloid protein. Biochem J. 1995;311:1–16. doi: 10.1042/bj3110001. [DOI] [PMC free article] [PubMed] [Google Scholar]
- 5.Kang J, Lemaire HG, Unterbeck A, Salbaum JM, Masters CL, Grzeschik KH, Multhaup G, Beyreuther K, Müller-Hill B. The precursor of Alzheimer's disease amyloid A4 protein resembles a cell-surface receptor. Nature. 1987;325:733–736. doi: 10.1038/325733a0. http://dx.doi.org/10.1097/00002093-198701030-00032. [DOI] [PubMed] [Google Scholar]
- 6.Esler WP, Wolfe MS. A portrait of Alzheimer secretases – new features and familiar faces. Science. 2001;293:1449–1454. doi: 10.1126/science.1064638. http://dx.doi.org/10.1126/science.1064638. [DOI] [PubMed] [Google Scholar]
- 7.Ball KA, Phillips AH, Wemmer DE, Head-Gordon T. Differences in β-strand populations of monomeric Aβ40 and Aβ42. Biophys J. 2013;104:2714–2724. doi: 10.1016/j.bpj.2013.04.056. http://dx.doi.org/10.1016/j.bpj.2013.04.056. [DOI] [PMC free article] [PubMed] [Google Scholar]
- 8.Ball KA, Wemmer DE, Head-Gordon T. Comparison of structure determination methods for intrinsically disordered amyloid-β peptides. J Phys Chem B. 2014;118:6405–6416. doi: 10.1021/jp410275y. http://dx.doi.org/10.1021/jp410275y. [DOI] [PMC free article] [PubMed] [Google Scholar]
- 9.Hou L, Shao H, Zhang Y, Li H, Menon NK, Neuhaus EB, Brewer JM, Byeon IJL, Ray DG, Vitek MP, Iwashita T, Makula RA, Przybyla AB, Zagorski MG. Solution NMR studies of the Aβ(1–40) and Aβ(1–42) peptides establish that the Met35 oxidation state affects the mechanism of amyloid formation. J Am Chem Soc. 2004;126:1992–2005. doi: 10.1021/ja036813f. http://dx.doi.org/10.1021/ja036813f. [DOI] [PubMed] [Google Scholar]
- 10.Fawzi NL, Ying J, Torchia Da, Clore GM. Kinetics of amyloid β monomer-to-oligomer exchange by NMR relaxation. J Am Chem Soc. 2010;132:9948–9951. doi: 10.1021/ja1048253. http://dx.doi.org/10.1021/ja1048253. [DOI] [PMC free article] [PubMed] [Google Scholar]
- 11.Antzutkin ON, Balbach JJ, Leapman RD, Rizzo NW, Reed J, Tycko R. Multiple quantum solid-state NMR indicates a parallel, not antiparallel, organization of β-sheets in Alzheimer's β-amyloid fibrils. Proc Natl Acad Sci USA. 2000;97:13045–13050. doi: 10.1073/pnas.230315097. http://dx.doi.org/10.1073/pnas.230315097. [DOI] [PMC free article] [PubMed] [Google Scholar]
- 12.Petkova AT, Ishii Y, Balbach JJ, Antzutkin ON, Leapman RD, Delaglio F, Tycko R. A structural model for Alzheimer's beta-amyloid fibrils based on experimental constraints from solid state NMR. Proc Natl Acad Sci USA. 2002;99:16742–16747. doi: 10.1073/pnas.262663499. http://dx.doi.org/10.1073/pnas.262663499. [DOI] [PMC free article] [PubMed] [Google Scholar]
- 13.Chimon S, Shaibat MA, Jones CR, Calero DC, Aizezi B, Ishii Y. Evidence of fibril-like β-sheet structures in a neurotoxic amyloid intermediate of Alzheimer's β-amyloid. Nat Struct Mol Biol. 2007;14:1157–1164. doi: 10.1038/nsmb1345. http://dx.doi.org/10.1038/nsmb1345. [DOI] [PubMed] [Google Scholar]
- 14.Tickler AK, Barrow CJ, Wade JD. Improved preparation of amyloid-beta peptides using DBU as Nalpha-Fmoc deprotection reagent. J Pept Sci. 2001;7:488–494. doi: 10.1002/psc.342. http://dx.doi.org/10.1002/psc.342. [DOI] [PubMed] [Google Scholar]
- 15.Zarandi M, Soos K, Fulop L, Bozso Z, Datki Z, Toth GK, Penke B. Synthesis of A beta(1–42) and its derivatives with improved efficiency. J Pept Sci. 2007;13:94–99. doi: 10.1002/psc.801. http://dx.doi.org/10.1002/Psc.801. [DOI] [PubMed] [Google Scholar]
- 16.Walsh DM, Thulin E, Minogue AM, Gustavsson N, Pang E, Teplow DB, Linse S. A facile method for expression and purification of the Alzheimer's disease-associated amyloid β-peptide. FEBS J. 2009;276:1266–1281. doi: 10.1111/j.1742-4658.2008.06862.x. http://dx.doi.org/10.1111/j.1742-4658.2008.06862.x. [DOI] [PMC free article] [PubMed] [Google Scholar]
- 17.Döbeli H, Draeger N, Huber G, Jakob P, Schmidt D, Seilheimer B, Stüber D, Wipf B, Zulauf M. A biotechnological method provides access to aggregation competent monomeric Alzheimer's 1–42 residue amyloid peptide. Biotechnology (NY) 1995;13:988–993. doi: 10.1038/nbt0995-988. http://dx.doi.org/10.1038/nbt0995-988. [DOI] [PubMed] [Google Scholar]
- 18.Lee EK, Hwang JH, Shin DY, Kim DI, Yoo YJ. Production of recombinant amyloid-β peptide 42 as an ubiquitin extension. Protein Expr Purif. 2005;40:183–189. doi: 10.1016/j.pep.2004.12.014. http://dx.doi.org/10.1016/j.pep.2004.12.014. [DOI] [PubMed] [Google Scholar]
- 19.Hortschansky P, Schroeckh V, Christopeit T, Zandomeneghi G, Fändrich M. The aggregation kinetics of Alzheimer's beta-amyloid peptide is controlled by stochastic nucleation. Protein Sci. 2005;14:1753–1759. doi: 10.1110/ps.041266605. http://dx.doi.org/10.1110/ps.041266605. [DOI] [PMC free article] [PubMed] [Google Scholar]
- 20.Zhang L, Yu H, Song C, Lin X, Chen B, Tan C, Cao G, Wang Z. Expression, purification, and characterization of recombinant human beta-amyloid42 peptide in Escherichia coli. Protein Expr Purif. 2009;64:55–62. doi: 10.1016/j.pep.2008.10.007. http://dx.doi.org/10.1016/j.pep.2008.10.007. [DOI] [PubMed] [Google Scholar]
- 21.Nagata-Uchiyama M, Yaguchi M, Hirano Y, Ueda T. Expression and purification of uniformly (15)N-labeled amyloid beta peptide 1–40 in Escherichia coli. Protein Pept Lett. 2007;14:788–792. doi: 10.2174/092986607781483741. http://dx.doi.org/10.2174/092986607781483741. [DOI] [PubMed] [Google Scholar]
- 22.Garai K, Crick SL, Mustafi SM, Frieden C. Expression and purification of amyloid-beta peptides from Escherichia coli. Protein Expr Purif. 2009;66:107–112. doi: 10.1016/j.pep.2009.02.009. http://dx.doi.org/10.1016/j.pep.2009.02.009. [DOI] [PMC free article] [PubMed] [Google Scholar]
- 23.Studier FW. Protein production by auto-induction in high-density shaking cultures. Protein Expr Purif. 2005;41:207–234. doi: 10.1016/j.pep.2005.01.016. http://dx.doi.org/10.1016/j.pep.2005.01.016. [DOI] [PubMed] [Google Scholar]
- 24.Gasteiger E, Hoogland C, Gattiker A, Duvaud S, Wilkins MR, Appel RD, Bairoch A. Protein identification and analysis tools on the ExPASy server. In: Walker John M., editor. Proteomics Protoc Handb. Humana Press; 2005. pp. 571–607. http://dx.doi.org/10.1385/1-59259-890-0:571. [Google Scholar]
- 25.Delaglio F, Grzesiek S, Vuister GW, Zhu G, Pfeifer J, Bax A. NMRPipe: a multidimensional spectral processing system based on UNIX pipes. J Biomol NMR. 1995;6:277–293. doi: 10.1007/BF00197809. http://dx.doi.org/10.1007/BF00197809. [DOI] [PubMed] [Google Scholar]
- 26.Schneider CA, Rasband WS, Eliceiri KW. NIH Image to ImageJ: 25 years of image analysis. Nat Methods. 2012;9:671–675. doi: 10.1038/nmeth.2089. http://dx.doi.org/10.1038/nmeth.2089. [DOI] [PMC free article] [PubMed] [Google Scholar]


