Abstract
We present a general method of utilizing bio-electric recordings from a spatially sparse electrode grid to compute a dynamic vector field describing the underlying propagation of electrical activity. This vector field, termed the wavefront flow field, permits quantitative analysis of the magnitude of rotational activity (vorticity) and focal activity (divergence) at each spatial point. We apply this method to signals recorded during arrhythmias in human atria and ventricles using a multi-polar contact catheter and show that the flow fields correlate with corresponding activation maps. Further, regions of elevated vorticity and divergence correspond to sites identified as clinically-significant rotors and focal sources where therapeutic intervention can be effective. These flow fields can provide quantitative insights into the dynamics of normal and abnormal conduction in humans and could potentially be used to enhance therapies for cardiac arrhythmias.
I. INTRODUCTION
The conduction of electrical activity across spatially-distributed systems underlies many important biological functions, causing contraction of the heart and passage of information throughout the brain. While understanding the spatio-temporal propagation of this electrical activity is a goal of many studies [1–6], technical limitations often constrain in-vivo recordings in humans to spatially sparse electrode grids. Conversely, standard measures of tracking propagation flow have typically been derived for image recordings in which data is graded in brightness and is available with high spatial resolution. As a result, flow is often very smooth, moving only a single grid point, or pixel, per timeframe [7], a qualification which is not met with many such bio-electric recordings. Accurately tracking the flow of electrical activity in the current systems therefore requires a more involved methodology.
One important example in which interpreting spatially-distributed bio-electric recordings becomes important is during cardiac arrhythmias [8]. An arrhythmia is defined as an altered heart rhythm where the contraction of either the atria or the ventricles is sped up (tachycardia), slowed down (bradycardia), or uncoordinated (fibrillation). These heart rhythm disorders represent a significant global health concern, with atrial fibrillation alone occurring in over 30 million people worldwide [9] leading to heart failure, stroke, and mortality [10]. Moreover, ventricular fibrillation is the primary cause of the approximately 300,000 cases of sudden cardiac death that occur each year in the United States [11].
Various computational and clinical studies have hypothesized that consistent rotational activation patterns, known as rotors, play an important role in the perpetuation of human fibrillation [12–19]. Additionally, it has been proposed that activation patterns spreading centrifugally outwards, known as focal sources, are also important in maintaining fibrillation [20]. While recent advances in the mapping of heart rhythm disorders have provided visual evidence of rotational and focal sources during episodes of human arrhythmia [21–25] and have shown that synchrony analysis can be applied to electrode recordings [26], no study has attempted to track and quantify the flow of conduction from these maps. This direct quantification of conduction dynamics would afford the possibility to study how arrhythmias perpetuate and evolve in time across many different patients and episodes. Furthermore, it could elucidate the relative commonality of rotors as compared to focal sources in an objective manner.
We present a general methodology to determine and compute a vector field, termed the wavefront flow field, describing the flow of conduction across a sparse electrode grid. Standard mapping techniques display activations across this grid as successive grayscale images, but interpretation of such activation videos alone can be challenging as well as subjective. In this study, we apply our method to unique clinical data recorded during both tachycardia and fibrillation, and present results which show a strong correspondence to the underlying visual activation maps. We also present simple measures of rotor activity and focal activity derived from this vector field, and show that this automated procedure can identify regions of tissue with special clinical relevance.
II. METHODS
A. In-Silico and Clinical Data Acquisition
Both rotational and focal conduction patterns are simulated using the Fenton-Karma model of cardiac wave propagation
| (1) |
where Vm represents the transmembrane potential, Cm represents the membrane capacitance, and Iion is a model-specific term described by nonlinear evolution equations [27]. The resulting transmembrane potential is used to record activation times on an 8×8 grid covering our computational domain, in correspondence to the current resolution of panoramic basket catheters which cover the majority of atrial tissue with a spatial resolution of 5mm [28]. Clinical data is recorded from basket catheters with a temporal resolution of 1ms during episodes of clinical arrhythmia and activation times for each electrode are marked from the recorded electrogram. We denote the activation times for the electrode at coordinate (x, y) as the set txy. For both in-silico and clinical data these activation times are interpolated to a 29×29 grid before being used to compute the flow field.
B. Coarse-Graining Activation Times
These activation times represent a simplified picture of the underlying conduction dynamics. It is assumed that some number of coherent activation fronts traverse cardiac tissue throughout these episodes, and therefore if we sufficiently coarse-grain our activation times we expect to see contiguous regions of activation. In particular, we set a time bin α = 10 ms and compute our coarse-grained activation times as , with rescaled time referred to as t*. The value of this time bin was chosen visually to optimize the smoothness of activation fronts, where a significantly smaller time bin leads to rough pixelated fronts and a significantly larger time bin leads to over-smoothing and the inability to distinguish individual fronts. These activation times are best described as an activation front defined by
| (2) |
In words, the activation front is 1 if there is an activation at point (x, y) and at (rescaled) time t*, and 0 otherwise. This activation front is then convolved with a Gaussian Kernel for spatial smoothing, and displayed as an activation map (see Figure 1).
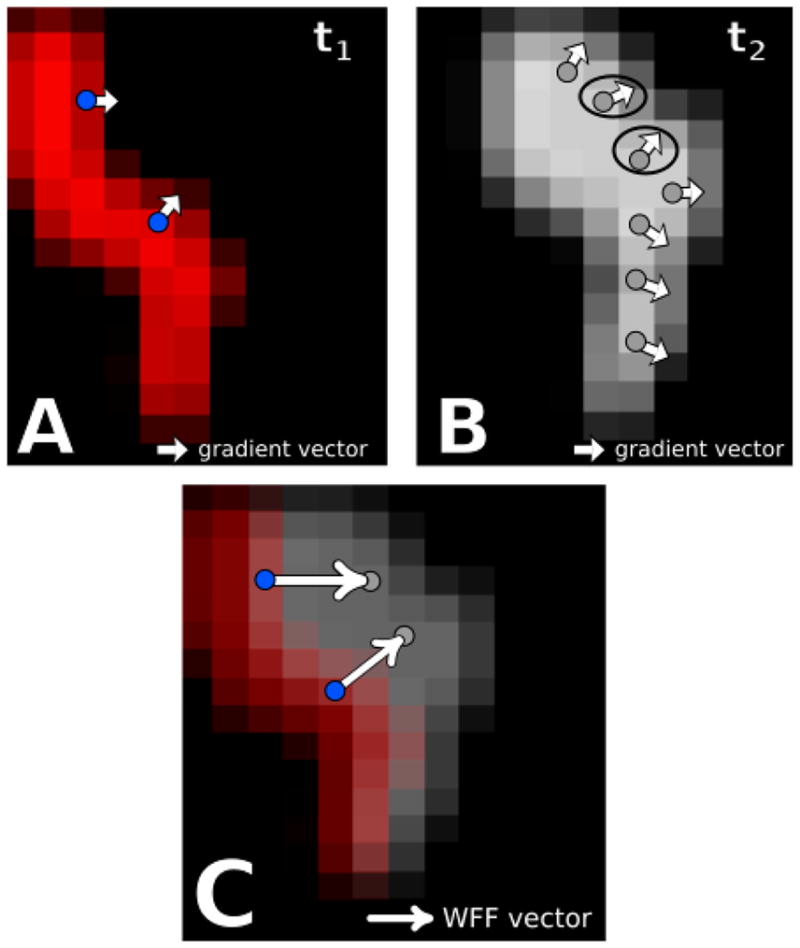
FIG. 1.

[Color Online] A schematic of the wavefront gradient matching procedure on clinical data. A. Snapshot at time t1 of an activation front Φ in red. The white arrows represent the negative gradient vector at the blue points. B. Snapshot at a later time t2 of the same activation front in gray. The instantaneous flow field at each blue point is determined by finding the point along this activation front which has the most similar negative gradient vector. These points are indicated by the circle. C. Resulting instantaneous flow vectors for the blue points in A, obtained by drawing the vector connecting these points to the circled points in B. Similar to above, the red activation front occurs at time t1 and the gray front occurs at a later time t2.
C. Wavefront Gradient Matching
To track the flow of the activation fronts in time, we utilize their spatial gradient ∇⃗s as a marker in order to infer the direction of their subsequent motion. For a given time t* we compute both ∇⃗sΦ(t*) and ∇⃗sΦ(t* + 1) across the entire domain. We call the activation wavefront the set of points where |∇⃗sΦ| > 0 and define the instantaneous flow vector for each wavefront point i at time t* as the normalized vector pointing from i to some point j obeying the optimization condition
| (3) |
where r⃗ij is the vector pointing from i to j and R* is a set parameter defining the maximum possible translation per unit time.
In words, for each point i along the wavefront at a given time we search within a disk of radius R* for the point j at the next time step which exhibits the most similar gradient vector. We assume that the point i on the wavefront has traveled towards this point j during this time step and mark this motion with the instantaneous flow vector. This approach is outlined on two successive snapshots of a sample clinical dataset in Figure 1 A and B, with sample points i shown as blue dots. The activation front, smoothed by a Gaussian kernel, is shown for the two successive time points and the negative gradient vectors at the blue dots are shown as white arrows. These vectors are also displayed for the subsequent activation front in B and the ones that match best with the vectors at the blue dots in A are circled. The instantaneous flow vector is then obtained by drawing a vector connecting the blue dot to the location of the best match, as shown in C.
As a final step, we compute this instantaneous flow field across a window of time, sum together these vectors, and apply smoothing filters to get a net wavefront flow field Ψ⃗(x, y) representing the consistent flow of conduction throughout this time period. To display a time-dependent flow field we compute this with a sliding window across our episode and interpolate through time.
D. Vorticity and Divergence
We wish to mark regions of increased rotational and focal activity from a given field Ψ⃗(x, y) using measures of vorticity and divergence. Rather than using the standard vector curl and divergence, which compute infinitesimal rotation and focality, we want to define contiguous regions of rotational activity with a coherent spatial domain. Furthermore, rotors are expected to have some meander in space and therefore the core of rotation may cover multiple points in space. For the purposes of quantifying rotor and focal sources on our sparse grid, we define vorticity Ω and divergence Δ at a point i as
| (4) |
and
| (5) |
where r⃗ij is the vector pointing from i to j, 𝒩i is the normalizing factor , ω̂ij is the tangent vector to r⃗ij, and n̂ij is the normal vector to r⃗ij. The factor acts as a weighting factor to assign decreasing importance to points further away from i and the numerator computes the alignment of the flow field and either the rotational circuit ω̂ or the divergent circuit n̂.
III. RESULTS
A. In-Silico Validation
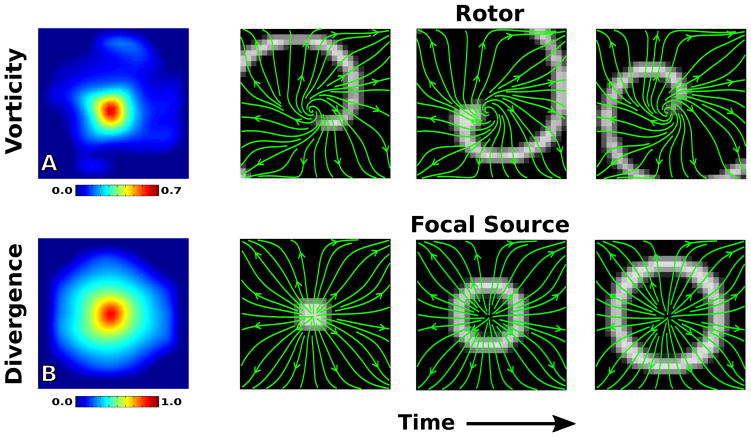
To verify that our methodology can pick up relevant activation patterns we first compute the flow field Ψ⃗ for in-silico data of a rotor and a focal source in Figure 2. The top four panels show the analysis on our simulated rotor, with the vorticity map clearly showing elevation at the center of the rotor core and streamlines of the flow field (green) tracking the propagation of the activation front Φ (grayscale). Similarly, the bottom four panels show the analysis on our simulated focal source, with the divergence map showing clear elevation at the site of the focal source and the flow field tracking the motion.
FIG. 2.
[Color Online] Flow field analysis of a simulated rotor (top) and focal source (bottom). A. The vorticity map records a significant elevation at the rotor core. B. The divergence map records a significant elevation at the site of the focal source. The right panels represent screenshots of the activation front at consecutive times throughout the recording, with streamlines of the flow field plotted in green.
It is worth noting here that while the divergence at the focal site reaches near unity, the vorticity at the rotor core is below unity. This can be attributed to the fact that rotors are expected to have some centrifugal component of motion as well as a rotational component. This is apparent when examining the simplified scenario of conduction on a homogeneous slab of tissue with the rotor’s wavefront approximated as an archimedean spiral r = θ1/n, where n is a parameter controlling how tightly wound the spiral is. In this simple case, the conduction should flow along the normal to the wavefront given by . From this we find that the fraction of motion which is rotational is given by . The conduction flow, therefore, will become more centrifugal and less rotational as θ → ∞, whereas near the core we still have a significant rotational component as can be seen in the flow fields in Figure 2. The winding parameter n in human fibrillation is unknown, so we must conclude that while vorticity should be elevated at a rotor core it may not be expected to reach unity even in the ideal case of a single rotor controlling the entire domain.
B. Clinical Arrhythmias
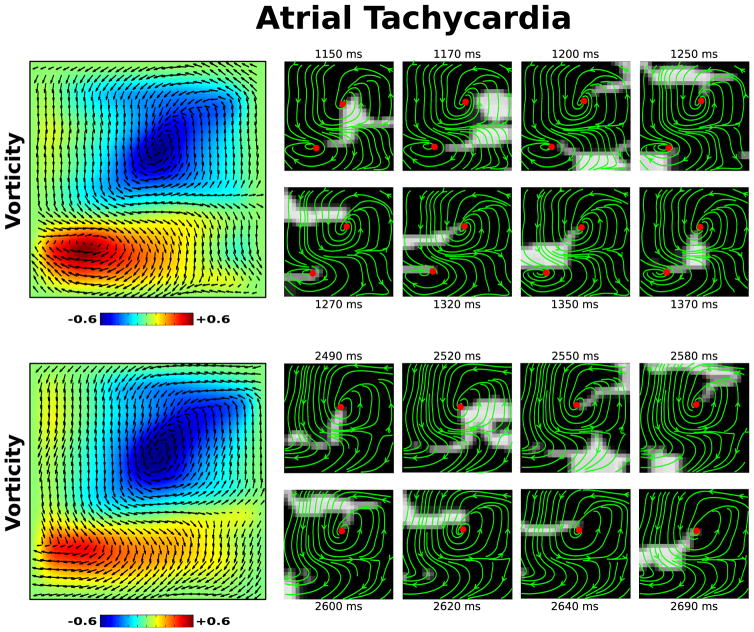
To show how our flow field analysis can elucidate the conduction dynamics underlying heart rhythm disorders we apply this methodology to clinical data recorded from patients experiencing two common arrhythmias. First, we examine an episode of tachycardia in the left atrium of a patient in Figure 3. The left panels shows the flow field Ψ plotted on top of a vorticity map for two different intervals during this episode, revealing a clear stable dual rotor activation pattern early transitioning to a single stable rotor. The panels on the right show consecutive snapshots of the activation front and streamlines of the flow field during each interval, with red dots marking the local maxima/minima of vorticity above an arbitrary threshold. Visual inspection of these frames validate the existence of this dual rotor pattern. The full activation video of this episode, with the corresponding flow field, is included as Movie 1 of the Supplemental Materials [29].
FIG. 3.
[Color Online] Flow field analysis during two intervals of a clinical episode of atrial tachycardia. A clear dual rotor pattern is seen in the vorticity map (top left) transitioning to a single rotor (bottom left). Corresponding activation maps (right), with streamlines of the flow field plotted in green and the local maxima/minima of vorticity above an arbitrary threshold marked as a red dot. The flow field Ψ is plotted on top of the vorticity map. The full video of this episode, with continuous activation maps and flow field streamlines, is available as Movie 1 of the Supplemental Material [29].
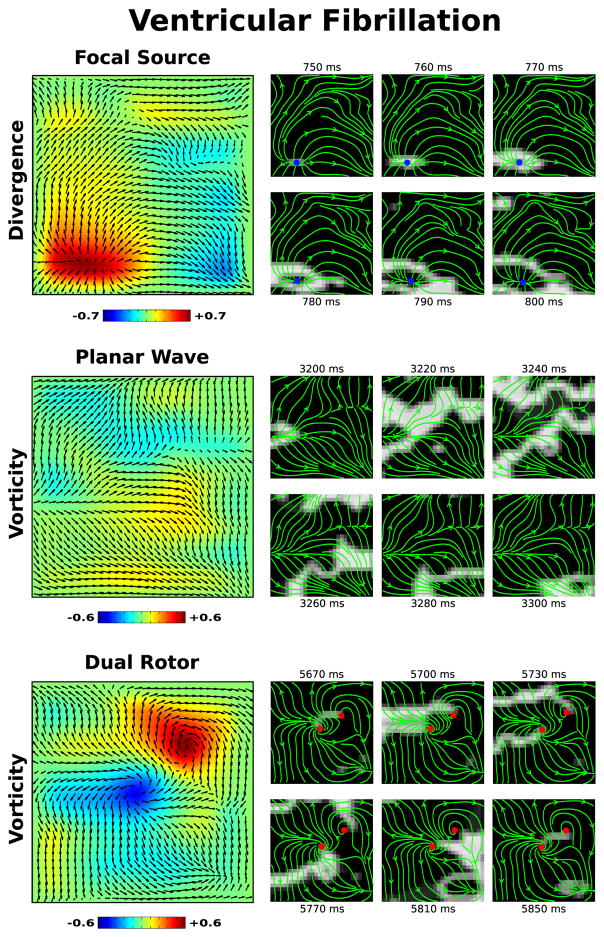
We also examine an episode of fibrillation occurring in the left ventricle of a 72 year old patient in Figure 4. This patient was enrolled for a ventricular ablation procedure, whereby fibrillation was induced, mapped, and subsequently ablated. Immediately after induction, defibrillators were charged and used to terminate fibrillation once charging was complete during which electrograms were recorded. Our flow field analysis revealed that this episode of fibrillation exhibited a focal source early after induction (Figure 4, top). A few seconds later, the conduction pattern changes to mostly planar activation (Figure 4, middle). Finally, near the end of this episode a dual rotor pattern appears and meanders to the top right corner (Figure 4, bottom). Similar to above, left panels show the flow field Ψ on top of either divergence or vorticity maps for each observed pattern. Right panels show snapshots of activation and flow fields, with the blue dots marking the local maxima of divergence and red dots marking the local maxima/minima of vorticity. The full activation video of this episode, with the corresponding flow field, is included as Movie 2 of the Supplemental Materials [29].
FIG. 4.
[Color Online] Flow field analysis during three intervals of a clinical episode of ventricular fibrillation. A focal source is seen early in the episode, with a clear region of elevated divergence shown in the divergence map (top left). Later in the episode, planar activation transitions to a dual rotor pattern, as can be seen in the vorticity map (bottom left). The flow field Ψ is plotted on top of all maps. The corresponding activation maps are also shown to the right, with streamlines of the flow field plotted in green, the local maxima of the divergence marked as a blue dot, and the local maxima/minima of the vorticity marked as a red dot. The full video of this episode, with continuous activation maps and flow field streamlines, is available as Movie 2 of the Supplemental Material [29].
Although during fibrillation the activation maps were more complex, as well as non-stationary, our flow field analysis is still able to determine consistent activation patterns which may hold significance to the underlying arrhythmia. This is supported by the fact that after targeting the dual rotor pattern above, subsequent attempts to re-induce fibrillation failed. Furthermore, the patient has experienced no arrhythmias in the 2.5 years since the procedure, suggesting that the sites which were ablated served an important role in perpetuating arrhythmia. In addition, targeted ablation of atrial fibrillation, guided by visual inspection of activation maps, has shown to be an efficient treatment for this arrhythmia. Our flow field analysis should make the interpretation of the activation data during fibrillation less cumbersome and more precise.
As episodes of fibrillation become more complex, potentially exhibiting multiple distinct conduction patterns simultaneously, the resolution and fidelity of the recordings will become particularly important in determining how successfully one can identify rotors or focal sources. This methodology should be able to identify such simultaneous patterns as long as the respective spatial domains of each source is sufficiently large. If a rotor or focal source does not span neighboring electrodes, for instance, any method relying upon signals from this sparse grid will not have enough information to identify centrifugal or rotational activity.
IV. CONCLUSION
We have presented a methodology which can quantify complex spatio-temporal conduction patterns from low resolution spatially-distributed recordings. In-silico data was presented to show that this analysis can accurately identify both rotor and focal source patterns in the form of a flow field and corresponding vorticity and divergence maps. By applying this analysis to clinical data we showed quantitative evidence of the presence of rotors and focal sources during episodes of arrhythmia in patients, which have been hypothesized to play an important mechanistic role in the maintenance of both tachycardia and fibrillation. The ability to accurately quantify the patterns underlying clinical arrhythmia with a single flow field Ψ affords the comparison of conduction dynamics across many patients and episodes. Moreover, personalized therapies such as targeted ablation could benefit from such analysis, aiding physicians in accurately determining optimal sites for ablation.
Acknowledgments
This work was supported by National Institutes of Health Grants R01 HL122384 (WJR), R01 HL83359 and K24 HL103800 (SMN), and American Heart Association 10BGIA350045 (DEK). DV gratefully acknowledges predoctoral fellowship support from the American Heart Association.
Contributor Information
David Vidmar, Department of Physics, University of California, San Diego.
Sanjiv M. Narayan, Department of Cardiovascular Medicine, Stanford University, Palo Alto
David E. Krummen, Department of Medicine, University of California, San Diego and the Veterans Administration San Diego Healthcare System
Wouter-Jan Rappel, Department of Physics, University of California, San Diego, La Jolla, CA.
References
- 1.Gray R, Pertsov A, Jalife J. Nature. 1998;392:75. doi: 10.1038/32164. [DOI] [PubMed] [Google Scholar]
- 2.Echebarria B, Karma A. Phys Rev Lett. 2002;88:208101. doi: 10.1103/PhysRevLett.88.208101. [DOI] [PubMed] [Google Scholar]
- 3.Nakouzi E, Totz JF, Zhang Z, Steinbock O, Engel H. Physical Review E. 2016;93:022203. doi: 10.1103/PhysRevE.93.022203. [DOI] [PubMed] [Google Scholar]
- 4.Fox JJ, Riccio ML, Hua F, Bodenschatz E, Gilmour RF. Circ Res. 2002;90:289. doi: 10.1161/hh0302.104723. [DOI] [PubMed] [Google Scholar]
- 5.Quail T, Shrier A, Glass L. Physical review letters. 2014;113:158101. doi: 10.1103/PhysRevLett.113.158101. [DOI] [PubMed] [Google Scholar]
- 6.Witkowski F, Leon L, Penkoske P, Giles W, Spano ML, Ditto W, Winfree A. Nature. 1998;392:78. doi: 10.1038/32170. [DOI] [PubMed] [Google Scholar]
- 7.Horn BK, Schunck BG. Artificial intelligence. 1981;17:185. [Google Scholar]
- 8.Karma A. Annu Rev Condens Matter Phys. 2013;4:313. [Google Scholar]
- 9.Chugh SS, Roth GA, Gillum RF, Mensah GA. Glob Heart. 2014;9:113. doi: 10.1016/j.gheart.2014.01.004. [DOI] [PubMed] [Google Scholar]
- 10.Fuster V, Rydén LE, Cannom DS, Crijns HJ, Curtis AB, Ellenbogen KA, Halperin JL, Le Heuzey J-Y, Kay GN, Lowe JE, et al. Europace. 2006;8:651. [Google Scholar]
- 11.Nichol G, Thomas E, Callaway CW, Hedges J, Powell JL, Aufderheide TP, Rea T, Lowe R, Brown T, Dreyer J, et al. JAMA. 2008;300:1423. doi: 10.1001/jama.300.12.1423. [DOI] [PMC free article] [PubMed] [Google Scholar]
- 12.Courtemanche M, Winfree A. International Journal of Bifurcation and Chaos. 1991;1:431. [Google Scholar]
- 13.Jalife J, Berenfeld O, Mansour M. Cardiovascular research. 2002;54:204. doi: 10.1016/s0008-6363(02)00223-7. [DOI] [PubMed] [Google Scholar]
- 14.ten Tusscher KH, Panfilov AV. American Journal of Physiology-Heart and Circulatory Physiology. 2006;291:H1088. doi: 10.1152/ajpheart.00109.2006. [DOI] [PubMed] [Google Scholar]
- 15.Qu Z, Garfinkel A, Chen P-S, Weiss JN. Circulation. 2000;102:1664. doi: 10.1161/01.cir.102.14.1664. [DOI] [PubMed] [Google Scholar]
- 16.Vigmond EJ, Ruckdeschel R, Trayanova N. Journal of cardiovascular electrophysiology. 2001;12:1046. doi: 10.1046/j.1540-8167.2001.01046.x. [DOI] [PubMed] [Google Scholar]
- 17.Lin YJ, Lo MT, Lin C, Chang SL, Lo LW, Hu YF, Hsieh WH, Chang HY, Lin WY, Chung FP, Liao JN, Chen YY, Hanafy D, Huang NE, Chen SA. Circ Arrhythm Electrophysiol. 2013;6:851. doi: 10.1161/CIRCEP.113.000318. [DOI] [PubMed] [Google Scholar]
- 18.Christensen K, Manani KA, Peters NS. Physical review letters. 2015;114:028104. doi: 10.1103/PhysRevLett.114.028104. [DOI] [PMC free article] [PubMed] [Google Scholar]
- 19.Zemlin CW, Pertsov AM. Physical review letters. 2012;109:038303. doi: 10.1103/PhysRevLett.109.038303. [DOI] [PubMed] [Google Scholar]
- 20.Jais P, Haissaguerre M, Shah DC, Chouairi S, Gencel L, Hocini M, Clementy J. Circulation. 1997;95:572. doi: 10.1161/01.cir.95.3.572. [DOI] [PubMed] [Google Scholar]
- 21.Narayan SM, Krummen DE, Shivkumar K, Clopton P, Rappel W-J, Miller JM. Journal of the American College of Cardiology. 2012;60:628. doi: 10.1016/j.jacc.2012.05.022. [DOI] [PMC free article] [PubMed] [Google Scholar]
- 22.Narayan SM, Krummen DE, Rappel W-J. Journal of cardiovascular electrophysiology. 2012;23:447. doi: 10.1111/j.1540-8167.2012.02332.x. [DOI] [PMC free article] [PubMed] [Google Scholar]
- 23.Narayan SM, Krummen DE, Enyeart MW, Rappel W-J. PLoS ONE. 2012;7:e46034. doi: 10.1371/journal.pone.0046034. [DOI] [PMC free article] [PubMed] [Google Scholar]
- 24.Krummen DE, Hayase J, Morris DJ, Ho J, Smetak MR, Clopton P, Rappel W-J, Narayan SM. J Am Coll Cardiol. 2014;63:2712. doi: 10.1016/j.jacc.2014.03.037. [DOI] [PMC free article] [PubMed] [Google Scholar]
- 25.Haissaguerre M, Hocini M, Denis A, Shah AJ, Komatsu Y, Yamashita S, Daly M, Amraoui S, Zellerhoff S, Picat MQ, Quotb A, Jesel L, Lim H, Ploux S, Bordachar P, Attuel G, Meillet V, Ritter P, Derval N, Sacher F, Bernus O, Cochet H, Jais P, Dubois R. Circulation. 2014;130:530. doi: 10.1161/CIRCULATIONAHA.113.005421. [DOI] [PubMed] [Google Scholar]
- 26.Vidmar D, Narayan SM, Rappel W-J. American Journal of Physiology-Heart and Circulatory Physiology. 2015;309:H2118. doi: 10.1152/ajpheart.00407.2015. [DOI] [PMC free article] [PubMed] [Google Scholar]
- 27.Fenton F, Karma A. Chaos. 1998;8:20. doi: 10.1063/1.166374. [DOI] [PubMed] [Google Scholar]
- 28.Rappel WJ, Narayan SM. Chaos. 2013;23:023113. doi: 10.1063/1.4807098. [DOI] [PMC free article] [PubMed] [Google Scholar]
- 29.See [url] for clinical activation videos with corresponding flow fields.


