

Abstract
Background and Purpose
This study presents a secondary analysis from the Progressive Resistance Exercise Training in Parkinson disease (PRET-PD) trial investigating the effects of progressive resistance exercise (PRE) and a PD-specific multimodal exercise program, modified Fitness Counts (mFC), on spatial, temporal, and stability-related gait impairments in people with Parkinson disease (PD).
Methods
Forty-eight people with PD were randomized to participate in PRE or mFC 2×/week for 24 months; 38 completed the study. Gait velocity, stride length, cadence, and double support time were measured under 4 walking conditions (off/on medication, comfortable/fast speed). Ankle strength was also measured off and on medication. Twenty-four healthy controls provided comparison data at one time point.
Results
At 24 months, there were no significant differences between exercise groups. Both groups improved fast gait velocity off medication, cadence in all conditions, and plantarflexion strength off/on medication. Both groups with PD had more gait measures that approximated the heathy controls at 24 months than at baseline. Plantarflexion strength was significantly associated with gait velocity and stride length in people with PD at baseline and 24 months, but changes in strength were not associated with changes in gait.
Discussion and Conclusions
Twenty-four months of PRE and mFC were associated with improved off medication fast gait velocity and improved cadence in all conditions, which is important because temporal gait measures can be resistant to medications. Spatial and stability-related measures were resistant to long-term improvements, but did not decline over 24 months. Strength gains did not appear to transfer to gait. Video Abstract available for more insights from the authors (see Supplemental Digital Content 1).
Keywords: Parkinson’s disease, gait, progressive resistance exercise, randomized controlled trial
INTRODUCTION
Parkinson disease (PD), which affects approximately 1% of people over age 60, is associated with progressive mobility decline.1 Lower extremity dysfunction and gait impairments predict decreased quality of life2 and increased mortality in people with PD.3 Gait impairments are shaped by the characteristic PD motor deficits, bradykinesia, rigidity, and postural instability, but can be resistant to the medical and surgical treatments used to manage PD.4,5 Given that people with PD present with different PD-related motor and gait impairments, it is important to understand how different exercise interventions affect specific gait impairments in PD.
Parkinsonian gait impairments can be broken down into decreased gait velocity, as well as spatial, temporal, and stability-related impairments. Decreased stride length is a spatial gait impairment that can be attributed to hypokinetic movement. Decreased cadence, or step frequency, is a temporal gait impairment that could be due to bradykinetic movement. Increased time spent in double limb support during the gait cycle is a stability-related gait impairment, which may be attributed to postural instability. Together, decreases in stride length and cadence are associated with reduced overall gait velocity. Gait velocity is reduced by 8 to 16% in people with mild-to-moderate PD depending on the condition under which it is tested.6 Specific PD-related gait impairments can be more pronounced when tested off anti-parkinsonian medication, and at fast gait speeds.6 Spatial gait impairments and overall gait velocity improve with anti-parkinsonian medications, while temporal and stability-related gait impairments can be resistant to medical management.5–10 Because the effects of medications are limited, it is important to consider exercise as an alternative therapy to improve or prevent decline in gait velocity, as well as spatial, temporal, and stability-related gait impairments in people with PD.
Although task-specific gait training is the approach most consistently associated with improved gait velocity, and spatial, temporal, and stability-related gait impairments in people with PD,11,12 there is also evidence of improved gait performance following 6 to 24 months of strength and balance training.13–18 However, the transfer of benefits from strength and balance training to specific spatial, temporal, and stability-related gait measures differs across studies, and the long-term benefits are unknown. It is important to determine the types of exercise that can transfer benefits across PD symptoms with prolonged training periods to improve long-term exercise recommendations for people with PD.
The Progressive Resistance Exercise Training in PD (PRET-PD) trial investigated two forms of exercise, each of which could transfer benefits to spatial, temporal, and stability-related gait performance over 24 months, albeit through different mechanisms.19–23 Improved lower extremity strength and power have been associated with improved gait velocity and balance in people with PD.21,23 Improvements in gait velocity could occur through spatial and/or temporal mechanisms.21,23–25 Therefore, strengthening exercise could improve spatial, temporal, and/or stability related gait impairments in people with PD. Studies of multimodal balance and core strengthening interventions, similar to the multimodal PD-specific modified Fitness Counts (mFC) exercise program, have been shown to improve gait velocity and spatial gait measures in people with PD.26,27 We previously reported that both groups improved general physical function and fast walking velocity (25 foot walk test), while off and on medication.20 However, the long-term positive or differential effects of PRE or mFC on spatial, temporal, or stability-related gait impairments in people with PD were not reported. It was also not clear whether improvements in muscle strength were related to spatial, temporal, or stability-related gait changes in people with PD following exercise.
This article presents a planned secondary analysis of the PRET-PD cohort to examine the effect of 24 months of exercise on gait velocity, and spatial, temporal, and stability-related gait performance in people with mild-to-moderate PD. We examined two key research areas. First, we examined gait performance over 24 months in people with PD who participated in PRE or mFC. We hypothesized that the PRE group would demonstrate greater improvements over 24 months due to the progressive nature of the intervention. We calculated changes over time, and compared the experimental groups to age- and sex-matched healthy controls to determine if consistent exercise in people with PD resulted in performance that approximated healthy gait. The second key research area was to determine the association between changes in ankle strength and changes in specific gait impairments following 24 months of exercise. The purpose of this analysis was to demonstrate whether increasing strength transfers benefits to specific gait measures. These analyses will provide new insight into the long-term impact of different types of exercise on gait performance in people with PD.
METHODS
The PRET-PD study was a prospective, parallel-group, single center, randomized controlled trial which tested the effect of PRE and mFC on 48 people with PD over 24 months. The current study presents a detailed analysis of secondary measures: gait and ankle strength. Eligibility criteria for people with PD were idiopathic PD as outlined by the Parkinson’s Disease Society Brain Bank criteria,28 aged 50 to 67 years, on stable dopaminergic therapy, and able to walk for 6 minutes. Exclusion criteria were significant neurological history other than PD; significant arthritis; failed Physical Activity Readiness Questionnaire;29 cognitive impairment as indicated by a Mini-Mental State Examination score <23;30 already exercising; and history of surgery for PD. Twenty-four age-matched (±5 years) and sex-matched healthy controls, who did not participate in either exercise program, were tested on one occasion to provide comparison data. Inclusion/exclusion criteria for controls were the same as the participants with PD, with the addition of no significant neurologic diagnoses. Due to equipment failure, the data of 1 healthy control was treated as missing.
The full randomized controlled trial profile and CONSORT flow chart were previously reported.19 Briefly, participants with PD were randomized to participate in either PRE or the active control group of mFC, matched by disease severity and sex after enrollment and baseline testing. A blinded statistician randomized the first member of each pair using a random length, permuted block design.19 The study was approved by the institutional review boards at Rush University Medical Center and the University of Illinois at Chicago. All participants provided written informed consent.
Exercise Intervention
The PRE group performed progressive strengthening of the trunk, upper and lower extremities. The mFC group performed the non-progressive strength, balance, and stretching exercises recommended by the National Parkinson Foundation.27 The specific exercises are summarized in Table 1.19,20,27 The programs were identical in the duration of exercise (60–90 minutes), time with the personal trainer (2×/week for 6 months, 1×/week for remaining 18 months), and number of exercises sessions (2×/week for 24 months = 208). To maximize safety and adherence, exercise was performed on anti-parkinsonian medication at gym facilities near the participant’s home, and was paid for by the study. Participants were asked to complete 208 sessions in 24 months. If they missed 1 session, they were instructed to make it up. If they missed 2 consecutive sessions, their trainer contacted the exercise coordinator, who resolved any issues. Each trainer was contacted every 2–3 months to identify and address problems with participant well-being or completion of the prescribed exercises.
Table 1.
| PROGRESSIVE RESISTANCE EXERCISE | MODIFIED FITNESS COUNTS27 | ||
|---|---|---|---|
| STRENGTH & POWER | STRENGTHENING & BALANCE | STRETCHING | |
| Double Leg Press | Chest Press | Wall Slides | Calf Stretch |
| Rotary Calf | Lat Pull Down | Bridging | Ankle Circles |
| Knee Extension | Reverse Fly | Long Arc Quads | Hamstring Stretch |
| Hip Extension | Biceps Curls | Prone On Elbows | Seated Side Stretch |
| Back Extension | Shoulder Press | Shoulder Blade Squeezes | Lying Shoulder Stretch |
| Triceps Extension | Quadruped Arm and Leg Lift | Standing Back Stretch | |
| Forward Weight Shift | Lying Rotation Stretch | ||
| Backwards Weight Shift | Seated Neck and Chest Stretch | ||
| Single Leg Balance | Overhead Shoulder Stretch | ||
| Standing Chest Stretch | |||
| Standing Shoulder Stretch | |||
| Seated Rotation Stretch | |||
Warm up and Cool Down Period: 3 minutes of walking followed by 5 repetitions of the following 5 stretches: 1) neck circles to both directions, 2) trunk rotation while lying down to both directions, 3) arm circles in both directions, 4) hamstring stretches while sitting and 5) ankle stretches while standing.
Abbreviations: Lat, Latissiumus; Quads, Quadriceps
Assessments
Assessments were performed at the University of Illinois at Chicago by raters blinded to group assignment. Participants with PD were tested at baseline, and every six months for 24 months. Off medication assessments were completed in the morning, following a 12-hour over-night withdrawal from anti-parkinsonian medication.31 Participants then took their prescribed medication, ate lunch, and repeated the assessments approximately 60 minutes later. The order of testing was pseudo-randomized between outcome domains, which included gait, ankle strength, and the previously reported Unified Parkinson’s Disease Rating Scale (UPDRS) motor score, upper limb movement speed and strength, quality of life, physical function, and cognition.19,20,32
Gait analysis was completed using the GAITRite® (CIR Systems, Inc., Sparta, NJ). Participants completed three trials walking at their comfortable walking speed, and three trials walking “as fast as possible.” Four gait measures were extracted from the GAITRite® software, and averaged across the three trials: gait velocity (m/s), stride length (m), cadence (steps/minute), and double support time (percent of the gait cycle).
Seated isometric ankle plantarflexion and dorsiflexion strength were tested with a custom-made ankle dynamometer with the ankle fixed at a 90° angle.33,34 Strength was defined as the average torque (Nm) in a ±100 ms window around peak torque within a six-second trial. The best of three trials was used.
Statistical Analysis
Statistical analyses were performed using SAS (version 9.4; SAS Institute, Inc., Cary, NC). The PRET-PD study was powered using the off medication UPDRS motor score, which indicated that 17 patients per group were needed. With a projected attrition rate of 30%, the final sample size was 24 patients per group.19 PRE and mFC at baseline were compared with the healthy controls using a one-way analysis of variance (ANOVA). This was done to determine baseline equivalence between mFC and PRE and to quantify impairments in the PRE and mFC groups relative to healthy values. Subjects were tested under two medication conditions (off medication, on medication) and two walking speeds (comfortable speed, fast speed). This produced four walking conditions: (1) off medication comfortable speed, (2) off medication fast speed, (3) on medication comfortable speed, and (4) on medication fast speed. The dependent variables were: gait velocity, stride length, cadence, double support time, plantarflexion strength, and dorsiflexion strength. Separate analyses were performed for each measure.
The first key research area examined the gait measures using mixed effects regression models followed by single time point comparisons with the control group using a one-way ANOVA. The regression model examined the fixed effects of group, time, and group-by-time interactions, with random effects of participants. All time points were included in the model. The PRE group was treated as the reference group and the analyses assumed data were missing at random. To reduce the number of possible comparisons, we examine and report only the statistical significance of long-term effect of exercise at 24 months when there was a significant main or interaction effect across all data. We then performed a one-way ANOVA comparing the two groups with PD at the study endpoint to the healthy control group, which had been measured only once. When significant, pairwise comparisons were performed to determine whether each treatment group (PRE or mFC) differed from the healthy controls.
The second key research area examined plantarflexion and dorsiflexion strength over 24 months. Similar as above, mixed effects regression models and one-way ANOVAs were performed. Then, univariate linear regression models were used to investigate (1) the relationship between ankle strength and gait measures at baseline and at 24 months, and (2) whether 24-month change from baseline in ankle strength predicted the 24-month change from baseline in gait performance, across both groups. The coefficient of determination (R2) was used to determine the proportion of variance in each gait measure that was explained by plantarflexion strength, and the p-value for the associated F-test was used to determine its significance. Separate models were used for each variable.
RESULTS
Participants
From September 2007 to July 2011, 48 participants with PD completed baseline and 6-month assessments, and 38 completed the 24-month assessments. Dropouts and adverse events for PRET-PD have been reported in detail.19 In summary, 7 adverse events, primarily orthopedic in nature, occurred in 6 participants (5 PRE, 1 mFC). Despite the different number of adverse events per group, only one participant per group withdrew due to their adverse event (PRE: hospitalization after fall unrleated to training session; mFC: back surgery).19
Baseline Performance
As reported in Corcos et al, 2013, there were no significant baseline differences between the PRE and mFC groups (Table 2).19 Table 2 reveals that both groups with PD began the study impaired compared to the healthy controls in 10/16 gait measures: 7/8 gait measures off medication (all but comfortable cadence) and 3/8 gait measures on medication (fast gait velocity, fast cadence, and fast double support time). Both groups also had impaired plantarflexion strength off and on medication.
Table 2.
Baseline comparison between healthy control participants and the treatment groups
| Controla (n=23) |
PRE (n = 24) |
mFC (n= 24) |
Difference PRE – mFC (95% CI) |
Difference Control – PRE (95% CI) |
Difference Control – mFC (95% CI) |
|
|---|---|---|---|---|---|---|
| Demographics and Clinical Characteristics | ||||||
| Age | 61.2 (7.7) | 59.0 (4.6) | 58.6 (5.6) | 0.4 (−3.1 to 3.9) | 2.1 (−1.4 to 5.2) | 2. 6 (−1.0 to 6.1) |
| Male (%) | 12 (52%) | 14 (58%) | 14 (58%) | p = 0.89f | ||
| Race: African-American (%) | 13 (54.2%) | 2 (8.3%) | 0 (0%) | p < 0.0001f | ||
| Ethnicity: Hispanic or Latino (%) | 1 (4.2%) | 1 (4.2%) | 5 (20.8%) | p = 0.20f | ||
| MMSE | 29.2 (0.8) | 29.3 (1.1) | 29.1 (1.4) | 0.2 (−0.4 to 0.8) | −0.1 (−0.8 to 0.5) | 0.1 (−0.6 to 0.7) |
| mUPDRS off medicationb | 1.9 (1.5) | 34.5 (11.9) | 34.7 (11.5) | −0.2 (−5.8 to 5.4) | −32.6 (−38.2 to −27.0)c | −32.8 (−38.4 to −27.2)c |
| Off Medication | ||||||
| Comfortable Gait Velocity (m/s)b | 1.36(0.26) | 1.07(0.26) | 1.15(0.19) | −0.08 (−0.22 to 0.05) | 0.29 (0.15 to 0.43)c | 0.21 (0.07 to 0.35)c |
| Fast Gait Velocity (m/s)b | 2.19(0.38) | 1.64(0.30) | 1.71(0.28) | −0.07 (−0.26 to 0.12) | 0.55 (0.36 to 0.74)c | 0.48 (0.29 to 0.67)c |
| Comfortable Stride Length (m)b | 1.42(0.18) | 1.19(0.25) | 1.23(0.21) | −0.03 (−0.16 to 0.09) | 0.23 (0.10 to 0.36)c | 0.19 (0.06 to 0.32)c |
| Fast Stride Length (m)b | 1.66(0.22) | 1.46(0.20) | 1.52(0.28) | −0.05 (−0.19 to 0.09) | 0.20 (0.06 to 0.33)d | 0.15 (0.01 to 0.28)d |
| Comfortable Cadence (steps/min) | 114 (13) | 107 (10) | 113 (9) | −6 (−12 to 1) | 7 (1 to 13)e | 1 (−5 to 8) |
| Fast Cadence (steps/min)b | 159 (25) | 134 (12) | 137 (11) | −2 (−12 to 7) | 25 (15 to 35)c | 23 (13 to 33)c |
| Comfortable Double Support Time (% gait cycle)b | 25.5 (3.5) | 30.4 (6.4) | 29.1 (4.2) | 1.3 (−1.5 to 4.1) | −4.8 (−7.7 to −2.0)c | −3.6 (−6.4 to −0.7)d |
| Fast Double Support Time (% gait cycle)b | 18.7 (3.1) | 25.6 (4.4) | 23.9 (4.1) | 1.7 (−0.6 to 4.0) | −6.9 (−9.1 to −4.6)c | −5.2 (−7.5 to −2.9)c |
| Plantarflexion (Nm)b | 61.9(17.6) | 33.4(14.7) | 40.4(19.9) | −6.9 (−17.0 to 3.16) | 28.5 (18.3 to 38.7)c | 21.6 (11.4 to 31.8)c |
| Dorsiflexion (Nm) | 35.4(10.2) | 29.2(9.8) | 32.0(9.3) | −2.8 (−8.5 to 2.8) | 6.2 (0.5 to 11.9)e | 3.4 (−2.3 to 9.0) |
| On Medication | ||||||
| Comfortable Gait Velocity (m/s) | 1.36(0.26) | 1.22(0.23) | 1.32(0.18) | −0.10 (−0.23 to 0.03) | 0.13 (−0.00 to 0.26)e | 0.03 (−0.10 to 0.16) |
| Fast Gait Velocity (m/s)b | 2.19(0.38) | 1.78(0.28) | 1.84(0.22) | −0.06 (−0.23 to 0.11) | 0.41 (0.24 to 0.59)c | 0.35 (0.18 to 0.52)c |
| Comfortable Stride Length (m) | 1.42(0.18) | 1.32(0.19) | 1.38(0.17) | −0.06 (−0.16 to 0.04) | 0.10 (0.00 to 0.21)e | 0.04 (−0.06 to 0.15) |
| Fast Stride Length (m) | 1.66(0.22) | 1.53(0.17) | 1.61(0.21) | −0.08 (−0.19 to 0.04) | 0.13 (0.01 to 0.24)e | 0.05 (−0.07 to 0.16) |
| Comfortable Cadence (steps/min) | 114 (13) | 111 (10) | 116 (8) | −4 (−10 to 2) | 3 (−3 to 9) | −1 (−7 to 5) |
| Fast Cadence (steps/min)b | 159 (25) | 139 (14) | 137 (11) | 2 (−8 to 12) | 20 (10 to 30)c | 22 (12 to 32)c |
| Comfortable Double Support Time (% gait cycle) | 25.5 (3.5) | 28.3 (5.5) | 25.7 (2.6) | 1.3 (−1.0 to 3.5) | −2.6 (−4.9 to −0.4)e | −1.4 (−3.6 to 0.9) |
| Fast Double Support Time (% gait cycle)b | 18.7 (3.1) | 22.3 (6.2) | 19.5 (2.9) | 1.3 (−0.7 to 3.4) | −5.3 (−7.4 to −3.2)c | −3.9 (−6.0 to −1.8)c |
| Plantarflexion (Nm)b | 61.9(17.6) | 41.2(15.7) | 48.9(20.7) | −7.7 (−18.1 to 2.7) | 20.7 (10.2 to 31.3)c | 13.0 (2.5 to 23.6)d |
| Dorsiflexion (Nm) | 35.4(10.2) | 32.4(9.9) | 33.2(9.4) | −0.8 (−6.5 to 4.9) | 3.0 (−2.8 to 8.7) | 2.1 (−3.6 to 7.9) |
Group data are presented as mean (standard deviation). There were no between-group differences between PRE and mFC at baseline.
Abbreviations: CI, confidence intervals; mFC, modified Fitness Counts; MMSE, Mini-Mental Status Examination; mUPDRS, motor subsection of the Unified Parkinson’s Disease Rating Scale; PRE, Progressive Resistance Exercise; yrs, years.
The same control data were used for comparisons on and off medication, at baseline and at 24 months.
p-value from ANOVA F-test p < 0.05.
p ≤ 0.001 pairwise contrast comparison.
p < 0.05 pairwise contrast comparison.
Although confidence intervals for between-group differences suggest otherwise, the ANOVA F-test was non-significant (p > 0.06).
p-value for Fisher Exact test for binary variables between all three groups. No between group CIs were estimated.
Effect of 24 Months of Exercise on Gait Measures in PD
At 24 months, there were no significant differences between groups. However, several gait measures were significantly improved relative to baseline in both the PRE and mFC groups. Off medication, fast gait velocity, comfortable cadence, and fast cadence increased (Figure 1; p=0.01, p=0.004, p<0.0001 respectively). On medication, only comfortable and fast cadence increased (p=0.006 and p=0.001, respectively). At 24 months, stride length and double support time were not different from baseline in either exercise group under any walking conditions (p ≥ 0.06). In the 16 different gait measures, the power to find between group differences ranged from 0.05 to 0.71, and the power to find combined within group differences ranged from 0.12 to greater than 0.99 as reported in the Supplementary Table 1 (Supplemental Digital Content).
Figure 1. The Effect of Exercise on Gait Measures over 24 Months.
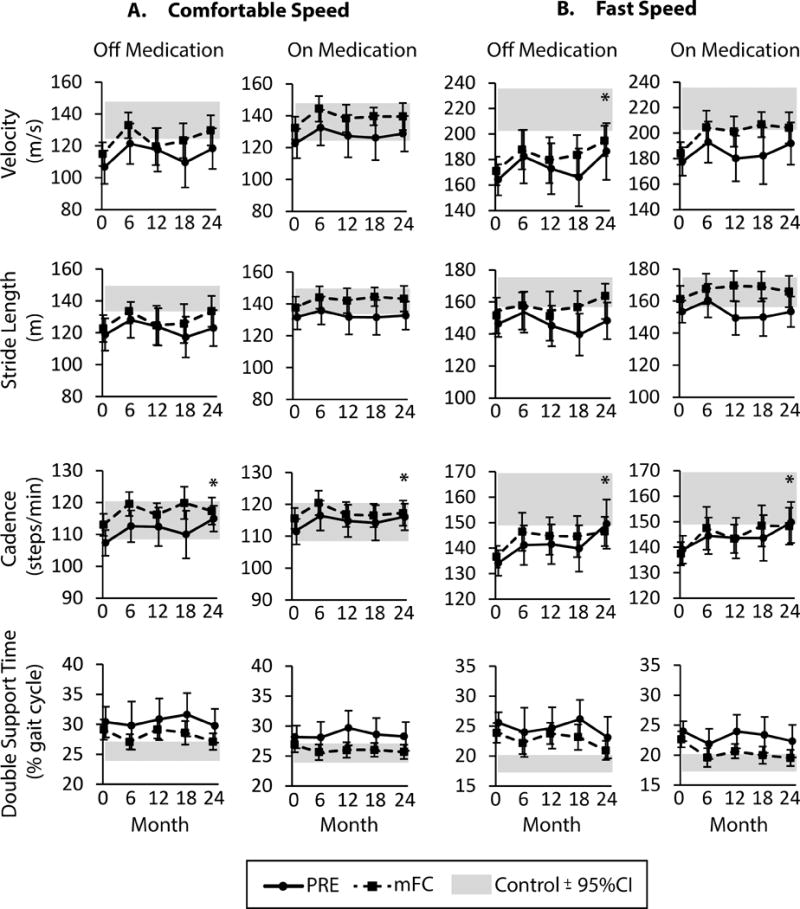
Data are gait velocity, stride length, cadence, and double support time over 24 months for PRE (solid line) and mFC (dashed line) exercise groups at (A) comfortable gait speeds and (B) fast gait speeds. Both off and on medication data are shown. Asterix (*) indicate a significant main effect of time with a significant difference from baseline at 24 months (p < 0.05). All data are presented as ± 95% confidence interval (CI). The grey shaded bar represents the 95% confidence interval surrounding the mean value for healthy controls.
Single Time Point Comparison to Healthy Controls following 24 Months of Exercise: Gait
A single time point comparison was performed at 24 months to examine if exercisers with PD continued to demonstrate impaired gait performance relative to healthy controls. After 24 months of exercise, the PRE group remained impaired in 7/16 gait measures (4 off medication and 3 on medication; Table 3). The mFC group was similar to controls for all gait measures.
Table 3.
Single time point comparison between healthy control participants and the treatment groups at 24 months
| Controla | Treatment Groups | |||||
|---|---|---|---|---|---|---|
| (n=23) |
PRE (n = 19 off, 20 on)d |
mFC (n= 18) |
Difference Control – PRE (95% CI) |
Difference Control – mFC (95% CI) |
||
| Off Medication | ||||||
| Gait Velocity (m/s) | Comfortable | 1.36 (0.26) | 1.18 (0.28) | 1.30 (0.2) | 0.17 (0.02 to 0.33) | 0.06 (−0.10 to 0.22) |
| Fast | 2.19 (0.38) | 1.86 (0.50) | 1.95 (0.26) | 0.33 (0.08 to 0.57)b | 0.24 (0.0 to 0.49) | |
| Stride Length (m) | Comfortable | 1.42 (0.18) | 1.23 (0.25) | 1.33 (0.21) | 0.19 (0.06 to 0.32)b | 0.08 (−0.05 to 0.22) |
| Fast | 1.66 (0.22) | 1.48 (0.25) | 1.60 (0.24) | 0.18 (0.03 to 0.32) | 0.06 (−0.09 to 0.20) | |
| Cadence (steps/min) | Comfortable | 114 (13) | 115 (9) | 117 (9) | −1 (−7 to 6) | −3 (−10 to 4) |
| Fast | 159 (25) | 149 (22) | 147 (13) | 10 (−3 to 23) | 13 (0 to 26) | |
| Double Support Time (% gait cycle) | Comfortable | 25.5 (3.5) | 29.8 (6.3) | 27.1 (3.0) | −4.2 (−7.0 to −1.5)b | −1.6 (−4.4 to 1.2) |
| Fast | 18.7 (3.1) | 23.1 (7.7) | 21.0 (3.4) | −4.4 (−7.6 to −1.2)b | −2.3 (−5.5 to 1.0) | |
| Plantarflexion (Nm) | 61.9 (17.6) | 49.0 (18.2) | 45.0 (18.0) | 12.9 (1.6 to 24.2)b | 16.9 (5.6 to 28.2)c | |
| Dorsiflexion (Nm) | 35.4 (10.2) | 31.5 (8.4) | 28.1 (9.0) | 3.8 (−2.1 to 9.7) | 7.3 (1.4 to 13.2)c | |
| On Medicationa | ||||||
| Gait Velocity (m/s) | Comfortable | 1.36 (0.26) | 1.29 (0.25) | 1.39 (0.18) | 0.07 (−0.08 to 0.21) | −0.04 (−0.19 to 0.11) |
| Fast | 2.19 (0.38) | 1.92 (0.38) | 2.04 (0.26) | 0.27 (0.06 to 0.48)c | 0.15 (−0.08 to 0.37) | |
| Stride Length (m) | Comfortable | 1.42 (0.18) | 1.33 (0.20) | 1.43 (0.17) | 0.09 (−0.02 to 0.20) | −0.01 (−0.13 to −0.10) |
| Fast | 1.66 (0.22) | 1.53 (0.22) | 1.66 (0.21) | 0.13 (−0.04 to 0.26) | 0.00 (−0.13 to 0.14) | |
| Cadence (steps/min) | Comfortable | 114 (13) | 116 (10) | 117 (9) | −2 (−8 to 5) | −3 (−9 to 4) |
| Fast | 159 (25) | 150 (18) | 148 (16) | 10 (−3 to 22) | 11 (−2 to 24) | |
| Double Support Time (% gait cycle) | Comfortable | 25.5 (3.5) | 28.3 (5.5) | 25.7 (2.6) | −2.7 (−5.2 to −0.3)c | −0.1 (−2.7 to 2.4) |
| Fast | 18.7 (3.1) | 22.3 (6.2) | 19.5 (2.9) | −3.6 (−6.3 to −1.0)b | −0.8 (−3.6 to 1.9) | |
| Plantarflexion (Nm)b | 61.9 (17.6) | 53.7 (20.5) | 54.8 (14.8) | −8.3 (−19.5 to 2.9) | −7.1 (−18.3 to 4.1) | |
| Dorsiflexion (Nm) | 35.4 (10.2) | 30.2 (9.1) | 30.9 (8.0) | −5.2 (−11.0 to 0.6) | −4.5 (−10.3 to 1.3) | |
Group data are presented as mean (standard deviation).
Abbreviations: CI, confidence intervals; mFC, modified Fitness Counts; PRE, Progressive Resistance Exercise.
The same control data were used for comparisons on and off medication, at baseline and at 24 months.
p ≤ 0.01 between group with PD and controls, from ANOVA with pairwise contrast comparisons.
p < 0.05 between group with PD and controls, from ANOVA with pairwise contrast comparisons.
One participant who completed PRE training was unable to complete off medication gait and ankle strength testing at time 4 due to dystonia (subjective report of “toe curling”). This participant did complete on medication testing.
Effects of 24 Months of Exercise on Ankle Strength, and its Relationship to Gait Performance
At 24 months there were no differences between groups on ankle strength. Off and on medication, plantarflexion strength was improved in both groups at 24 months relative to baseline (Figure 2A and 2B, p<0.0001 and p=0.001, respectively). There were no significant changes in dorsiflexion strength in either treatment group, off or on medication (Figure 2C and 2D, p > 0.14). Calculating the mean percent change provides additional information. After 24 months of exercise, the mean percent change in plantarflexion strength in the PRE group was 71% with a 95% confidence interval (CI95) of 44% to 98%. The mean percent change for the mFC group was 27% (CI95, −9 to 64%). When tested on medication, plantarflexion strength changed by 49% in the PRE group (CI95, 18% to 81%) and 28% in the mFC group (CI95, −4% to 61%). In the single time point comparison of the two exercise groups and controls at 24 months (Table 3), off medication both groups continued to have plantarflexion strength that was significantly weaker than controls, and the mFC group also had weaker dorsiflexion strength.
Figure 2. The Effect of Exercise on Plantarflexion Strength and Dorsiflexion Strength across 24 Months.
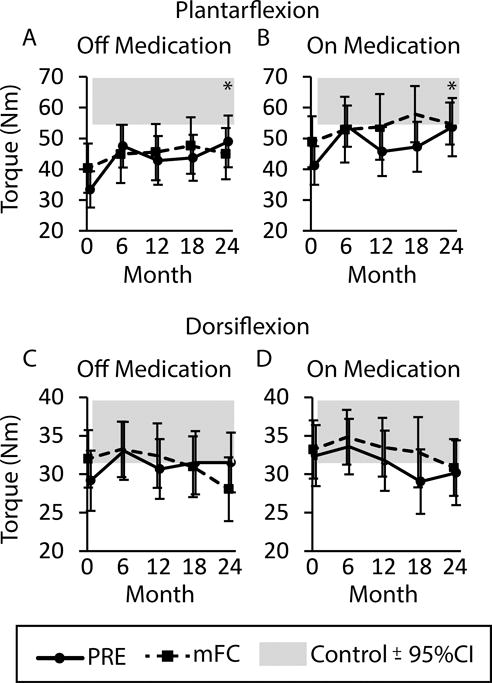
Data are plantarflexion strength (A) off medication and (B) on medication and dorsiflexion strength (C) off medication and (D) on medication for the PRE group (solid line) and mFC group (dashed line). Asterix (*) indicate a significant main effect of time with a significant difference from baseline at 24 months (p < 0.05). All data are presented as ± 95% confidence interval (CI). The grey shaded bar represents the 95% confidence interval surrounding the mean value for healthy controls.
We further examined whether plantarflexion strength was associated with gait measures at baseline and following 24 months of exercise. Linear regression models demonstrated that baseline plantarflexion strength explained 12–20% of the variance in baseline gait velocity and stride length (p ≤ 0.01), but not cadence or double support time. Table 4 demonstrates that relationships were similar at 24 months. We found that the 24-month improvement from baseline in plantarflexion strength was not associated with the 24-month improvement in any gait measures in the PRE or mFC groups (p ≥ 0.06 for all).
Table 4.
Variance explained (R2) by plantarflexion strength on gait measures at baseline, at 24 months, and for change in gait measures over 24 months
| Gait Measure and Speed | Baseline Absolute Data (R2) | 24 Months Absolute Data (R2) | 0–24 Month Change (R2) | |
|---|---|---|---|---|
| Off Medication | ||||
|
| ||||
| Gait Velocity (m/s) | Comfortable | 0.16b | 0.26a | 0.00 |
| Fast | 0.20b | 0.30a | 0.10 | |
|
| ||||
| Stride Length (m) | Comfortable | 0.14b | 0.27a | 0.01 |
| Fast | 0.14b | 0.18b | 0.02 | |
|
| ||||
| Cadence (steps/min) | Comfortable | 0.01 | 0.01 | 0.01 |
| Fast | 0.04 | 0.16b | 0.08 | |
|
| ||||
| Double Support Time (% gait cycle) | Comfortable | 0.01 | 0.09 | 0.00 |
| Fast | 0.01 | 0.10 | 0.07 | |
|
| ||||
| On Medication | ||||
|
| ||||
| Gait Velocity (m/s) | Comfortable | 0.18b | 0.19b | 0.03 |
| Fast | 0.19b | 0.20b | 0.02 | |
|
| ||||
| Stride Length (m) | Comfortable | 0.13b | 0.22b | 0.04 |
| Fast | 0.12b | 0.08 | 0.00 | |
|
| ||||
| Cadence (steps/min) | Comfortable | 0.09 | 0.01 | 0.01 |
| Fast | 0.05 | 0.11 | 0.02 | |
|
| ||||
| Double Support Time (% gait cycle) | Comfortable | 0.00 | 0.14b | 0.00 |
| Fast | 0.01 | 0.12 | 0.01 | |
Significance of F-value for simple linear regression is p < 0.001
Significance of F-value for simple linear regression is p < 0.05.
DISCUSSION
This study presents novel findings that long-term participation in either PRE or mFC was associated with long-term improvements in off medication fast gait velocity in people with mild-to-moderate PD. The temporal gait measure, cadence, improved in all conditions. Plantarflexion strength also improved both off and on medication, but off medication plantarflexion strength remained weaker than controls at 24 months in both groups. In contrast, spatial (stride length) and stability-related (double support time) measures were resistant to exercise-induced improvements at 24 months, but they also did not decline (Figure 1). Finally, we confirmed significant relationships among plantarflexion strength, gait velocity, and stride length at baseline and 24 months.21,23 However, improvements in plantarflexion strength with exercise training were not associated with improvements in any of the gait measures. This finding suggests that the changes in gait were not driven by changes in plantarflexion strength in this population of people with PD with mild–to-moderately impaired plantarflexion strength at baseline. It is possible that there is a minimum threshold of plantarflexion strength, above which the direct effects of strength on gait are too subtle to be picked up by spatiotemporal measures. Thus, the findings reported in this article may be generalized only to people with mild-to-moderate PD severity and mild-to-moderate gait and strength deficits.
Previous research has demonstrated improved gait velocity, as well as spatial and temporal gait measures, following short-term (< 6 months) strength training and multi-modal exercise programs, including balance and weight shifting programs such as Tai Chi.13,15,16,26 Although we did not further examine short-term gait improvements with exercise, we demonstrated improved off medication fast gait velocity at 24 months with both PRE and mFC, which may have been driven by improved cadence without improvement in stride length. The improvements in cadence occurred in all walking conditions in both groups, which is important because temporal gait measures tend to be resistant to medical management in PD.5–7,10
Besides statistical significance as illustrated above, another benchmark for intervention effectiveness is whether improvements are clinically meaningful beyond measurement error.35 Minimal detectable change and clinically important differences, based on data distribution and effect size metrics, have only been established for on medication gait velocity in people with PD.36–39 On a group level, a 0.06 m/s improvement in on medication comfortable gait velocity has been associated with moderate clinically important difference in the UPDRS.39 In the current study, the average improvement in both groups met or exceeded 0.06 m/s.39 At an individual level, the minimal detectable change values for on medication gait velocity in people with PD, based on a 95% CI and measurement reliability are 0.09 m/s for comfortable gait velocity and 0.13 m/s for fast gait velocity.36 A detailed look at data revealed that 18 of the 38 completers improved their on medication comfortable gait velocity greater than 0.09 m/s (10 PRE, 8 mFC), while 11 of the 38 completers declined in comfortable gait velocity greater than 0.09 m/s (6 PRE, 5 mFC). In contrast, 19 participants improved greater than 0.13 m/s in on medication fast gait velocity (9 PRE, 10 mFC), while only 2 completers declined by greater than 0.13 m/s (both PRE). Given the variability in the response to exercise between subjects, it is important for future, larger studies to determine whether any patient characteristics can predict better response to exercise. This is an active area of current and future research. Some of the characteristics which may predict response to exercise may include age, sex, disease severity, baseline function, baseline strength, past history of exercise, self-efficacy, cognition, or brain function.40
These analyses support the overall benefits of long-term exercise on gait, but do not support the superiority of either mFC or PRE. For the majority of our measures, a sample size of over 100 would be needed to detect statistically significant differences between groups, which is unlikely to be clinically meaningful. Interestingly, when comparing the PD data to the healthy controls, the mFC group appeared to have an advantage. Both groups with PD started the study with the same 10/16 gait measures impaired compared to controls. At study completion, the mFC group was impaired in 0/16 measures while the PRE group remained impaired in 7/16 gait measures. The observation that the mFC group’s gait measures were similar to healthy controls at 24 months may have been influenced by the observation that the mFC group’s gait and ankle strength measures were slightly closer to the healthy control values at baseline than the PRE group (Table 2 and Figure 1). Thus, at 24 months the similarity between the mFC group and healthy controls could reflect benefits of the exercise program itself or the importance of initiating regular exercise when gait performance is less limited by PD.41,42
Limitations
There were several limitations that should be considered. First, the study lacked a 24 month ‘best medical management’ control group with PD. Thus, we cannot say that PRE or mFC prevented a decline in gait performance; we only note when these long-term exercisers, with mild-to-moderate PD, were not different from healthy controls 6–9 years following diagnosis. A second limitation was that the PRET-PD trial was powered on finding a between-group difference for change in UPDRS motor score, and not change in gait measures. Based on the data collected in this study, group sizes from 30–81 participants may be enough to demonstrate that the mFC intervention improved stride length more than the PRE group. The other gait measures would require group sizes greater than 100, which are unlikely to reflect clinically relevant differences between the interventions. A third limitation was that the study lacked a task-specific gait-training group, the gold standard exercise for gait deficits, which could have led to more consistently improved gait performance.11,12
CONCLUSIONS
This study supported the improvement of fast gait velocity off medication, and improved cadence both off and on medication following 24 months of PRE or mFC in people with mild-to-moderate PD. In contrast, spatial and stability-related gait measures were resistant to long-term changes in response to PRE and mFC. Improvements in plantarflexion strength did not drive improvements in gait measures.
Supplementary Material
Acknowledgments
Source of Funding: PRET-PD was funded by grant R01-NS28127-12 to 16 from the National Institute of Neurological Disorders and Stroke. MRR also funded by the Foundation for Physical Therapy, and would also like to acknowledge funding from the University of Illinois at Chicago Graduate College, and National Institute of Mental Health T32 MH067631 Training in the Neuroscience of Mental Health, and by an Advances in Rehabilitation Research Training Grant (Administration for Community Living, NIDILRR grant number H133P130013, PI Allen Heinemann, PhD). These contents do not necessarily represent the policy or endorsement of the funding sources. MRR discloses that she has received honorarium from the National Parkinson Foundation (NPF), the publishers of the Fitness Counts exercise program, for travel and services related to the NPF Quality Improvement Initiative.
Full Authorship Statement and Full Funding Disclosures
| Conflict of Interest Disclosure |
Grant/research funding and support |
||
|---|---|---|---|
| Miriam R. Rafferty | Data processing, data analysis, data interpretation, statistical analysis, drafting and revising the manuscript | Unrelated to the submitted research project, I received honoriarium for participation as an external site reviewer for the National Parkinson Foundation (which published the Fitness Counts exercise program) Quality Improvement Initiative. | Research and training support from the Foundation for Physical Therapy, University of Illinois at Chicago Center for Clinical and Translational Science, National Institute of Mental Health, National Institute of Disability, Independent Living, and Rehabilitation Research. |
| Janey Prodoehl | Data interpretation, manuscript preparation, and critical manuscript revision | * | NIH |
| Julie A. Robichaud | Study concept and design, obtaining funding, data acquisition, and critical manuscript revision | * | NIH |
| Fabian J. David | Data acquisition, statistical analyses, and critical manuscript revision | * | NIH |
| Cynthia Poon | Data acquisition and critical manuscript revision | * | NIH |
| Lisa C. Goelz | Data acquisition, data processing, and critical manuscript revision | * | NIH |
| David E. Vaillancourt | Study concept and design, obtaining funding, study supervision and technical support, and critical manuscript revision | * | NIH, Michael J. Fox, and consults for projects at UT Southwestern Medical Center and Great Lakes NeuroTechnologies |
| Wendy M. Kohrt | Study concept and design, obtaining funding, study supervision, and critical manuscript revision | * | DoD and consulting fees from the NIH |
| Cynthia L. Comella | Study concept and design, obtaining funding, study supervision, participant recruitment, and critical manuscript revision | * | Research support from Allergan Inc., Merz Pharmaceuticals, Ipsen Limited, NIH, and Parkinson Disease Foundation and consulting fees from Neupathe, Allergan Inc., Merz Pharmaceuticals, Ipsen Limited and Medtronic Corporation. |
| Daniel M. Corcos | Study concept and design, obtaining funding, study supervision and technical/administrative/material support, and critical manuscript revision | * | NIH and Michael J. Fox, and receives lecture and reviewer fees from NIH. |
No significant conflicts of interest disclosed
Footnotes
Clinical Trial Registration: clinicaltrials.gov, NCT00591344
Prior Presentation of Data: These data were presented at the Combined Sections Meeting of the American Physical Therapy Association 2014. Las Vegas, NV. Other data from this clinical trial, including the full CONSORT diagram has been published in Corcos et al. Movement Disorders, 2013 and Prodoehl et al. Neurorehabilitation and Neural Repair, 2015.
Conflicts of Interest: No other conflicts of interest related to this project are reported by other authors.
LIST OF SUPPLEMENTAL DIGITAL CONTENT
Supplemental digital content 1: Video Abstact.mp4
Contributor Information
Miriam R. Rafferty, Center for Education in Health Sciences, Northwestern University.
Janey Prodoehl, Associate Professor, Physical Therapy Program, Midwestern University.
Julie A. Robichaud, Specialist in Physical Therapy, Department of Rehabilitation Services, University of Illinois Hospital and Health Science System.
Fabian J. David, Research Assistant Professor, Physical Therapy and Human Movement Science, Northwestern University.
Cynthia Poon, Research Assistant Professor, Physical Therapy and Human Movement Science, Northwestern University.
Lisa C. Goelz, Assistant Clinical Professor, Department of Kinesiology and Nutrition, University of Illinois at Chicago.
David E. Vaillancourt, Professor, Department of Applied Physiology and Kinesiology, University of Florida.
Wendy M. Kohrt, Professor, Division of Geriatric Medicine, University of Colorado School of Medicine.
Cynthia L. Comella, Professor, Department of Neurological Sciences, Rush University Medical Center.
Daniel M. Corcos, Professor, Physical Therapy and Human Movement Science, Northwestern University.
References
- 1.de Lau LM, Breteler MM. Epidemiology of Parkinson’s disease. Lancet Neurol. 2006;5(6):525–535. doi: 10.1016/S1474-4422(06)70471-9. [DOI] [PubMed] [Google Scholar]
- 2.Stewart KC, Fernandez HH, Okun MS, Jacobson CE, Hass CJ. Distribution of motor impairment influences quality of life in Parkinson’s disease. Mov Disord. 2008;23(10):1466–1468. doi: 10.1002/mds.22162. [DOI] [PubMed] [Google Scholar]
- 3.Lo RY, Tanner CM, Albers KB, et al. Clinical features in early Parkinson disease and survival. Arch Neurol. 2009;66(11):1353–1358. doi: 10.1001/archneurol.2009.221. [DOI] [PubMed] [Google Scholar]
- 4.Rascol O, Payoux P, Ory F, Ferreira JJ, Brefel-Courbon C, Montastruc JL. Limitations of current Parkinson’s disease therapy. Ann Neurol. 2003;53(Suppl 3):S3–12. doi: 10.1002/ana.10513. discussion S12–15. [DOI] [PubMed] [Google Scholar]
- 5.Pötter-Nerger M, Volkmann J. Deep brain stimulation for gait and postural symptoms in Parkinson’s disease. Mov Disord. 2013;28(11):1609–1615. doi: 10.1002/mds.25677. [DOI] [PubMed] [Google Scholar]
- 6.McNeely ME, Duncan RP, Earhart GM. Medication improves balance and complex gait performance in Parkinson disease. Gait Posture. 2012;36(1):144–148. doi: 10.1016/j.gaitpost.2012.02.009. [DOI] [PMC free article] [PubMed] [Google Scholar]
- 7.Blin O, Ferrandez AM, Pailhous J, Serratrice G. Dopa-sensitive and dopa-resistant gait parameters in Parkinson’s disease. J Neurol Sci. 1991;103(1):51–54. doi: 10.1016/0022-510x(91)90283-d. [DOI] [PubMed] [Google Scholar]
- 8.Rochester L, Baker K, Nieuwboer A, Burn D. Targeting dopa-sensitive and dopa-resistant gait dysfunction in Parkinson’s disease: selective responses to internal and external cues. Mov Disord. 2011;26(3):430–435. doi: 10.1002/mds.23450. [DOI] [PubMed] [Google Scholar]
- 9.Schaafsma JD, Giladi N, Balash Y, Bartels AL, Gurevich T, Hausdorff JM. Gait dynamics in Parkinson’s disease: relationship to Parkinsonian features, falls and response to levodopa. J Neurol Sci. 2003;212(1–2):47–53. doi: 10.1016/s0022-510x(03)00104-7. [DOI] [PubMed] [Google Scholar]
- 10.McNeely ME, Earhart GM. Medication and subthalamic nucleus deep brain stimulation similarly improve balance and complex gait in Parkinson disease. Parkinsonism Relat Disord. 2013;19(1):86–91. doi: 10.1016/j.parkreldis.2012.07.013. [DOI] [PMC free article] [PubMed] [Google Scholar]
- 11.Rocha PA, Porfírio GM, Ferraz HB, Trevisani VF. Effects of external cues on gait parameters of Parkinson’s disease patients: a systematic review. Clin Neurol Neurosurg. 2014;124:127–134. doi: 10.1016/j.clineuro.2014.06.026. [DOI] [PubMed] [Google Scholar]
- 12.Mehrholz J, Friis R, Kugler J, Twork S, Storch A, Pohl M. Treadmill training for patients with Parkinson’s disease. Cochrane Database Syst Rev. 2010;(1):CD007830. doi: 10.1002/14651858.CD007830.pub2. [DOI] [PubMed] [Google Scholar]
- 13.Scandalis TA, Bosak A, Berliner JC, Helman LL, Wells MR. Resistance training and gait function in patients with Parkinson’s disease. Am J Phys Med Rehabil. 2001;80(1):38–43. doi: 10.1097/00002060-200101000-00011. quiz 44–36. [DOI] [PubMed] [Google Scholar]
- 14.Hackney ME, Earhart GM. Effects of dance on gait and balance in Parkinson’s disease: a comparison of partnered and nonpartnered dance movement. Neurorehabil Neural Repair. 2010;24(4):384–392. doi: 10.1177/1545968309353329. [DOI] [PMC free article] [PubMed] [Google Scholar]
- 15.Li F, Harmer P, Fitzgerald K, et al. Tai chi and postural stability in patients with Parkinson’s disease. N Engl J Med. 2012;366(6):511–519. doi: 10.1056/NEJMoa1107911. [DOI] [PMC free article] [PubMed] [Google Scholar]
- 16.Wassom DJ, Lyons KE, Pahwa R, Liu W. Qigong exercise may improve sleep quality and gait performance in Parkinson’s disease: a pilot study. Int J Neurosci. 2014 doi: 10.3109/00207454.2014.966820. [DOI] [PubMed] [Google Scholar]
- 17.Dibble LE, Hale TF, Marcus RL, Gerber JP, LaStayo PC. High intensity eccentric resistance training decreases bradykinesia and improves Quality Of Life in persons with Parkinson’s disease: a preliminary study. Parkinsonism Relat Disord. 2009;15(10):752–757. doi: 10.1016/j.parkreldis.2009.04.009. [DOI] [PubMed] [Google Scholar]
- 18.Hass CJ, Buckley TA, Pitsikoulis C, Barthelemy EJ. Progressive resistance training improves gait initiation in individuals with Parkinson’s disease. Gait Posture. 2012;35(4):669–673. doi: 10.1016/j.gaitpost.2011.12.022. [DOI] [PubMed] [Google Scholar]
- 19.Corcos DM, Robichaud JA, David FJ, et al. A two-year randomized controlled trial of progressive resistance exercise for Parkinson’s disease. Mov Disord. 2013;28(9):1230–1240. doi: 10.1002/mds.25380. [DOI] [PMC free article] [PubMed] [Google Scholar]
- 20.Prodoehl J, Rafferty MR, David FJ, et al. Two-Year Exercise Program Improves Physical Function in Parkinson’s Disease: The PRET-PD Randomized Clinical Trial. Neurorehabil Neural Repair. 2015;29(2):112–122. doi: 10.1177/1545968314539732. [DOI] [PMC free article] [PubMed] [Google Scholar]
- 21.Allen NE, Sherrington C, Canning CG, Fung VS. Reduced muscle power is associated with slower walking velocity and falls in people with Parkinson’s disease. Parkinsonism Relat Disord. 2010;16(4):261–264. doi: 10.1016/j.parkreldis.2009.12.011. [DOI] [PubMed] [Google Scholar]
- 22.Pang MY, Mak MK. Influence of contraction type, speed, and joint angle on ankle muscle weakness in Parkinson’s disease: implications for rehabilitation. Arch Phys Med Rehabil. 2012;93(12):2352–2359. doi: 10.1016/j.apmr.2012.06.004. [DOI] [PubMed] [Google Scholar]
- 23.Schilling BK, Karlage RE, LeDoux MS, Pfeiffer RF, Weiss LW, Falvo MJ. Impaired leg extensor strength in individuals with Parkinson disease and relatedness to functional mobility. Parkinsonism Relat Disord. 2009;15(10):776–780. doi: 10.1016/j.parkreldis.2009.06.002. [DOI] [PubMed] [Google Scholar]
- 24.Albani G, Sandrini G, Künig G, et al. Differences in the EMG pattern of leg muscle activation during locomotion in Parkinson’s disease. Funct Neurol. 2003;18(3):165–170. [PubMed] [Google Scholar]
- 25.Dietz V, Colombo G. Influence of body load on the gait pattern in Parkinson’s disease. Mov Disord. 1998;13(2):255–261. doi: 10.1002/mds.870130210. [DOI] [PubMed] [Google Scholar]
- 26.Zhang TY, Hu Y, Nie ZY, et al. Effects of Tai Chi and Multimodal Exercise Training on Movement and Balance Function in Mild to Moderate Idiopathic Parkinson Disease. Am J Phys Med Rehabil. 2015 doi: 10.1097/PHM.0000000000000351. [DOI] [PubMed] [Google Scholar]
- 27.Cianci H. Parkinson’s Disease: Fitness Counts. 3rd. National Parkinson Foundation; 2006. [Google Scholar]
- 28.Hughes AJ, Daniel SE, Kilford L, Lees AJ. Accuracy of clinical diagnosis of idiopathic Parkinson’s disease: a clinico-pathological study of 100 cases. J Neurol Neurosurg Psychiatry. 1992;55(3):181–184. doi: 10.1136/jnnp.55.3.181. [DOI] [PMC free article] [PubMed] [Google Scholar]
- 29.Valls-Solé J, Pascual-Leone A, Brasil-Neto JP, Cammarota A, McShane L, Hallett M. Abnormal facilitation of the response to transcranial magnetic stimulation in patients with Parkinson’s disease. Neurology. 1994;44(4):735–741. doi: 10.1212/wnl.44.4.735. [DOI] [PubMed] [Google Scholar]
- 30.Folstein MF, Folstein SE, McHugh PR. “Mini-mental state”. A practical method for grading the cognitive state of patients for the clinician. Journal of psychiatric research. 1975;12(3):189–198. doi: 10.1016/0022-3956(75)90026-6. [DOI] [PubMed] [Google Scholar]
- 31.Langston JW, Widner H, Goetz CG, et al. Core assessment program for intracerebral transplantations (CAPIT) Mov Disord. 1992;7(1):2–13. doi: 10.1002/mds.870070103. [DOI] [PubMed] [Google Scholar]
- 32.David FJ, Robichaud JA, Leurgans SE, et al. Exercise Improves Cognition in Parkinson’s Disease: The PRET-PD Randomized, Clinical Trial. Mov Disord. 2015 doi: 10.1002/mds.26291. [DOI] [PMC free article] [PubMed] [Google Scholar]
- 33.Sturman MM, Vaillancourt DE, Metman LV, Bakay RA, Corcos DM. Effects of five years of chronic STN stimulation on muscle strength and movement speed. Exp Brain Res. 2010;205(4):435–443. doi: 10.1007/s00221-010-2370-8. [DOI] [PubMed] [Google Scholar]
- 34.Vaillancourt DE, Prodoehl J, Sturman MM, Bakay RA, Metman LV, Corcos DM. Effects of deep brain stimulation and medication on strength, bradykinesia, and electromyographic patterns of the ankle joint in Parkinson’s disease. Mov Disord. 2006;21(1):50–58. doi: 10.1002/mds.20672. [DOI] [PMC free article] [PubMed] [Google Scholar]
- 35.Portney LG, Watkins MP. Foundations of Clinical Research: Applications to Practice. 3rd. Upper Saddle River, NJ: Pearson Education Inc; 2009. [Google Scholar]
- 36.Combs SA, Diehl MD, Filip J, Long E. Short-distance walking speed tests in people with Parkinson disease: reliability, responsiveness, and validity. Gait Posture. 2014;39(2):784–788. doi: 10.1016/j.gaitpost.2013.10.019. [DOI] [PubMed] [Google Scholar]
- 37.Steffen T, Seney M. Test-retest reliability and minimal detectable change on balance and ambulation tests, the 36-item short-form health survey, and the unified Parkinson disease rating scale in people with parkinsonism. Phys Ther. 2008;88(6):733–746. doi: 10.2522/ptj.20070214. [DOI] [PubMed] [Google Scholar]
- 38.Lim LI, van Wegen EE, de Goede CJ, et al. Measuring gait and gait-related activities in Parkinson’s patients own home environment: a reliability, responsiveness and feasibility study. Parkinsonism Relat Disord. 2005;11(1):19–24. doi: 10.1016/j.parkreldis.2004.06.003. [DOI] [PubMed] [Google Scholar]
- 39.Hass CJ, Bishop M, Moscovich M, et al. Defining the clinically meaningful difference in gait speed in persons with Parkinson disease. J Neurol Phys Ther. 2014;38(4):233–238. doi: 10.1097/NPT.0000000000000055. [DOI] [PubMed] [Google Scholar]
- 40.King LA, Peterson DS, Mancini M, et al. Do cognitive measures and brain circuitry predict outcomes of exercise in Parkinson Disease: a randomized clinical trial. BMC Neurol. 2015;15:218. doi: 10.1186/s12883-015-0474-2. [DOI] [PMC free article] [PubMed] [Google Scholar]
- 41.King LA, Priest KC, Nutt J, et al. Comorbidity and functional mobility in persons with Parkinson disease. Arch Phys Med Rehabil. 2014;95(11):2152–2157. doi: 10.1016/j.apmr.2014.07.396. [DOI] [PMC free article] [PubMed] [Google Scholar]
- 42.Frazzitta G, Maestri R, Bertotti G, et al. Intensive rehabilitation treatment in early Parkinson’s disease: a randomized pilot study with a 2-year follow-up. Neurorehabil Neural Repair. 2015;29(2):123–131. doi: 10.1177/1545968314542981. [DOI] [PubMed] [Google Scholar]
Associated Data
This section collects any data citations, data availability statements, or supplementary materials included in this article.