Abstract
Heterogeneity of tumor cells and their microenvironment can affect outcome in cancer. Blockade of immune checkpoints (ICPs) expressed only on a subset of immune cells leads to durable responses in advanced melanoma. Tissue-resident memory T (TRM) cells have recently emerged as a distinct subset of memory T cells in nonlymphoid tissues. Here, we show that functional properties and expression of ICPs within tumor-infiltrating lymphocytes (TILs) differ from those of blood T cells. TILs secrete less IL-2, IFN-γ, and TNF-α compared with circulating counterparts, and expression of VEGF correlated with reduced TIL infiltration. Within tumors, ICPs are particularly enriched within T cells with phenotype and genomic features of TRM cells and the CD16+ subset of myeloid cells. Concurrent T cell receptor (TCR) and tumor exome sequencing of individual metastases in the same patient revealed that interlesional diversity of TCRs exceeded differences in mutation/neoantigen load in tumor cells. These findings suggest that the TRM subset of TILs may be the major target of ICP blockade and illustrate interlesional diversity of tissue-resident TCRs within individual metastases, which did not equilibrate between metastases and may differentially affect the outcome of immune therapy at each site.
Tissue resident memory T cells are the major target of immune checkpoint blockade in melanoma, and their inter-lesional diversity exceeds differences in the tumor neo-antigen load.
Introduction
Tumor-related mortality in human melanoma is largely due to the growth of metastatic tumor cells in nonlymphoid tissues (NLTs). Several studies have shown that infiltration of primary and metastatic lesions by immune cells, particularly T cells and myeloid cells, affects outcome (1). Paradigmatically, it is thought that uptake of antigens from dying tumor cells by antigen-presenting cells leads to activation of antitumor T cells in the lymph nodes, and resultant effector memory T cells traffic back to the tumor to mediate antitumor effects, creating a tumor-immunity cycle (2). Activation of inhibitory immune checkpoints (ICPs) in the tumor microenvironment has emerged as a major barrier to effective tumor immunity, and antibody-mediated blockade of these pathways can lead to durable clinical regressions (3). Interestingly, the expression of these ICPs in most tumors, including melanoma, is restricted to only a minor subset of infiltrating immune cells (3). Therefore, there is an unmet need to precisely define both the phenotype and function of the subsets of immune cells involved in ICP-mediated regulation and understand their distinct biologic properties.
Initial models of T cell memory classified effector/central memory T (TEM/TCM) cells with the effector subset implicated in surveying NLTs (4). Recent studies have identified a third subset, termed tissue-resident memory T (TRM) cells, that reside for prolonged periods in NLTs and play an important role in protective immunity (5). An important aspect of TRM-mediated immune surveillance is its regional nature, which manifests by the lack of equilibration between antigenic tissues in parabiotic mice (5). TRM cells have also been identified in humans (6) and implicated in tissue-restricted pathology, although their contribution to tumor immunity is only beginning to be explored (7, 8). As with T cells, human monocytes also exhibit functional diversity, with a subset of CD16+ monocytes implicated as patrolling monocytes (9). Genomic studies of tumor cells have demonstrated a complex and heterogeneous landscape with a potential intratumoral heterogeneity effect on clinical outcome (10, 11).
In order to better understand the phenotypic and functional properties of immune cells within the tumor microenvironment, we combined several tools, such as single-cell mass cytometry, cytokine and gene expression profiling of sort-purified immune cells, T cell receptor (TCR) sequencing, and exome sequencing of tumor cells, to analyze tumor metastases.
Results
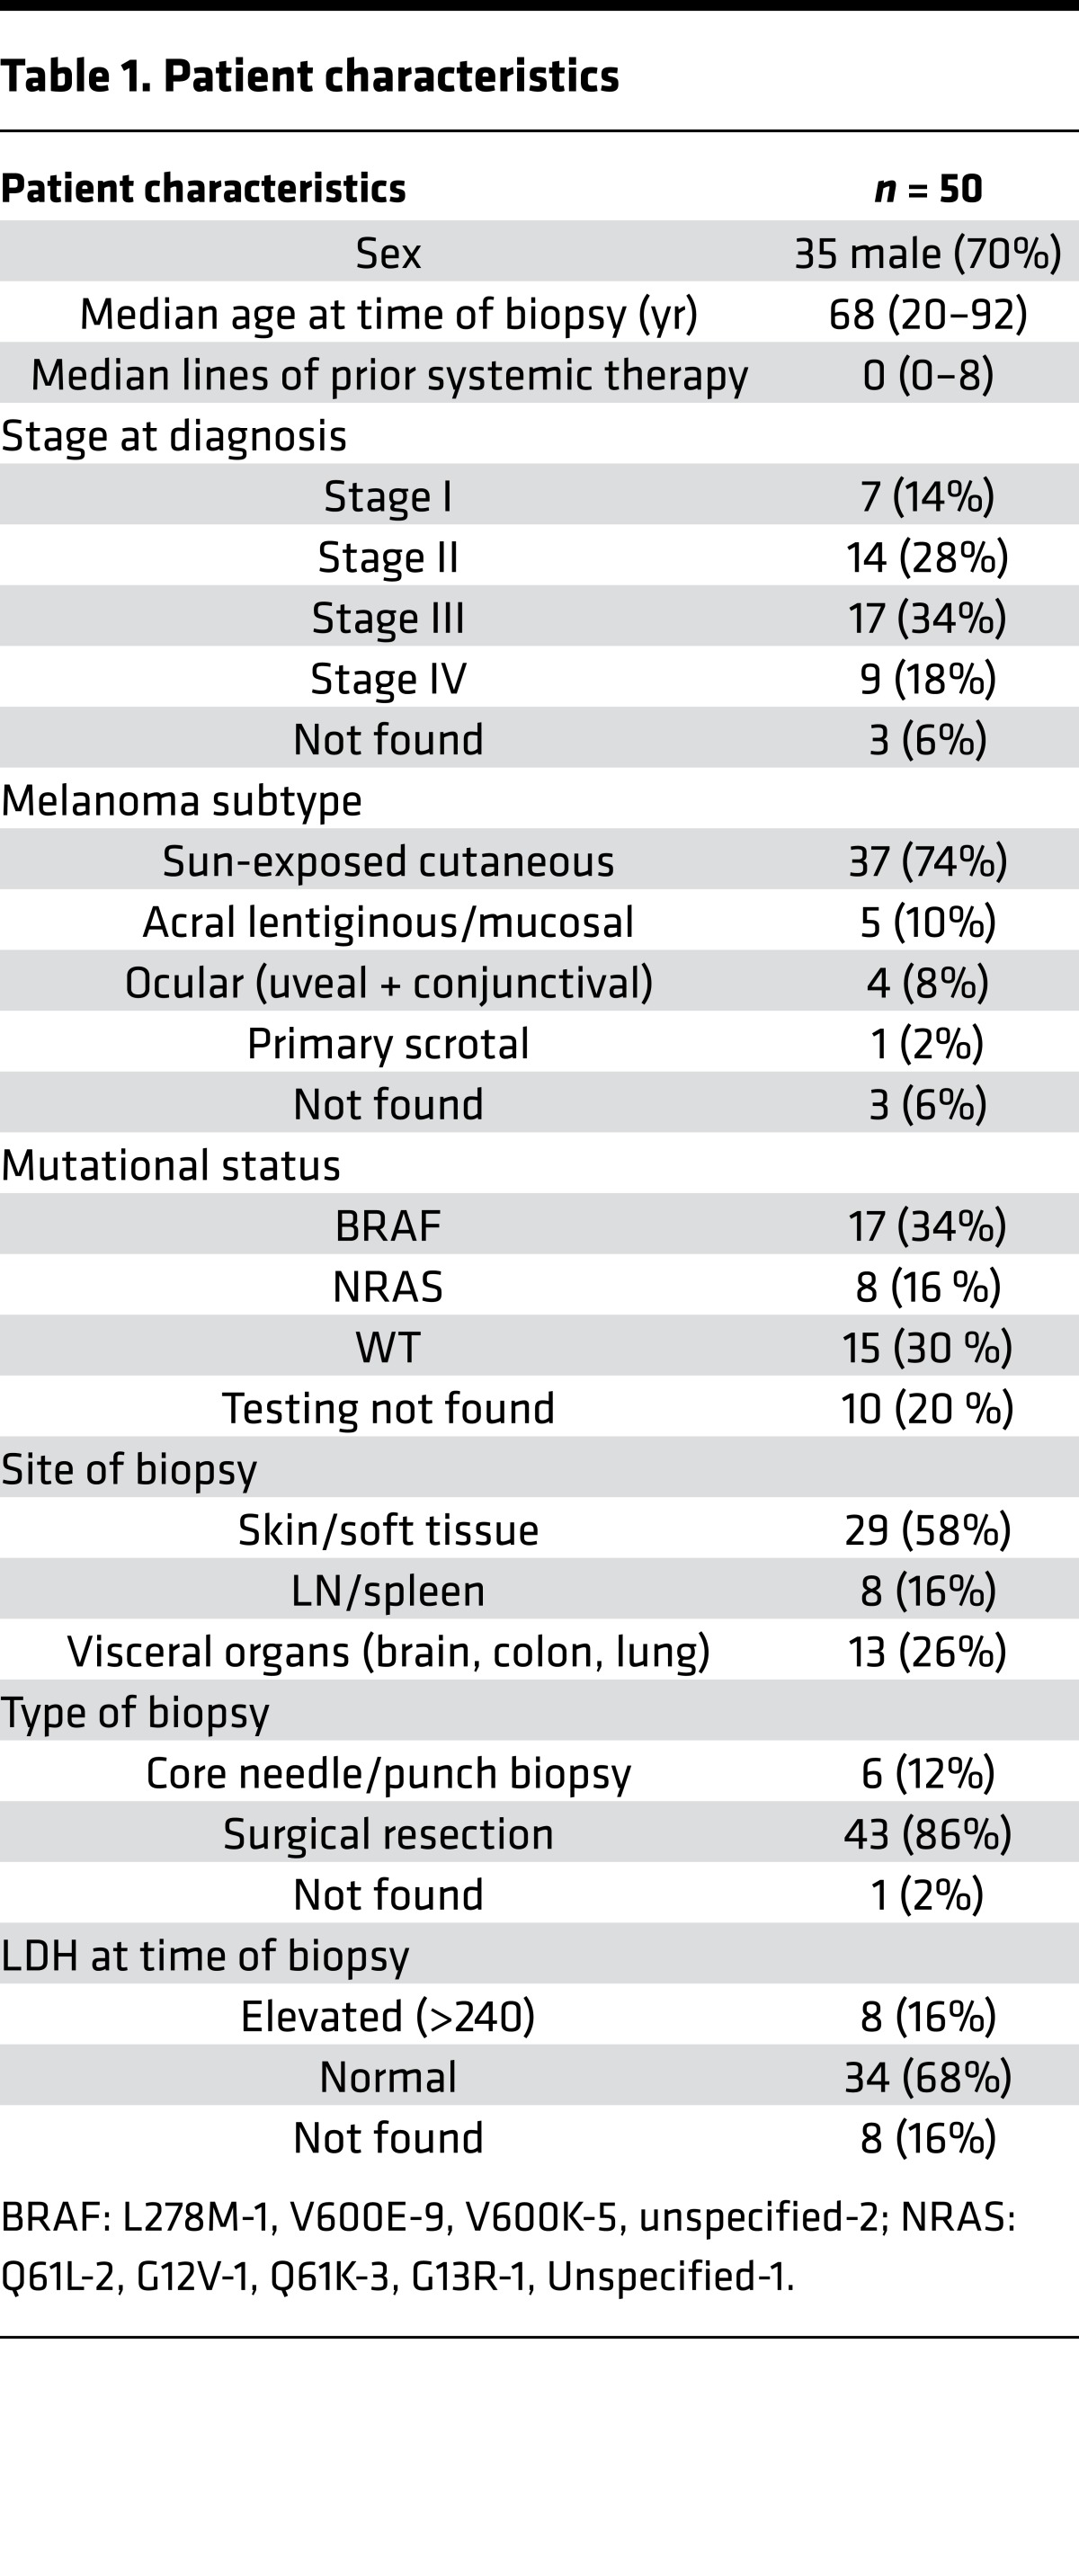
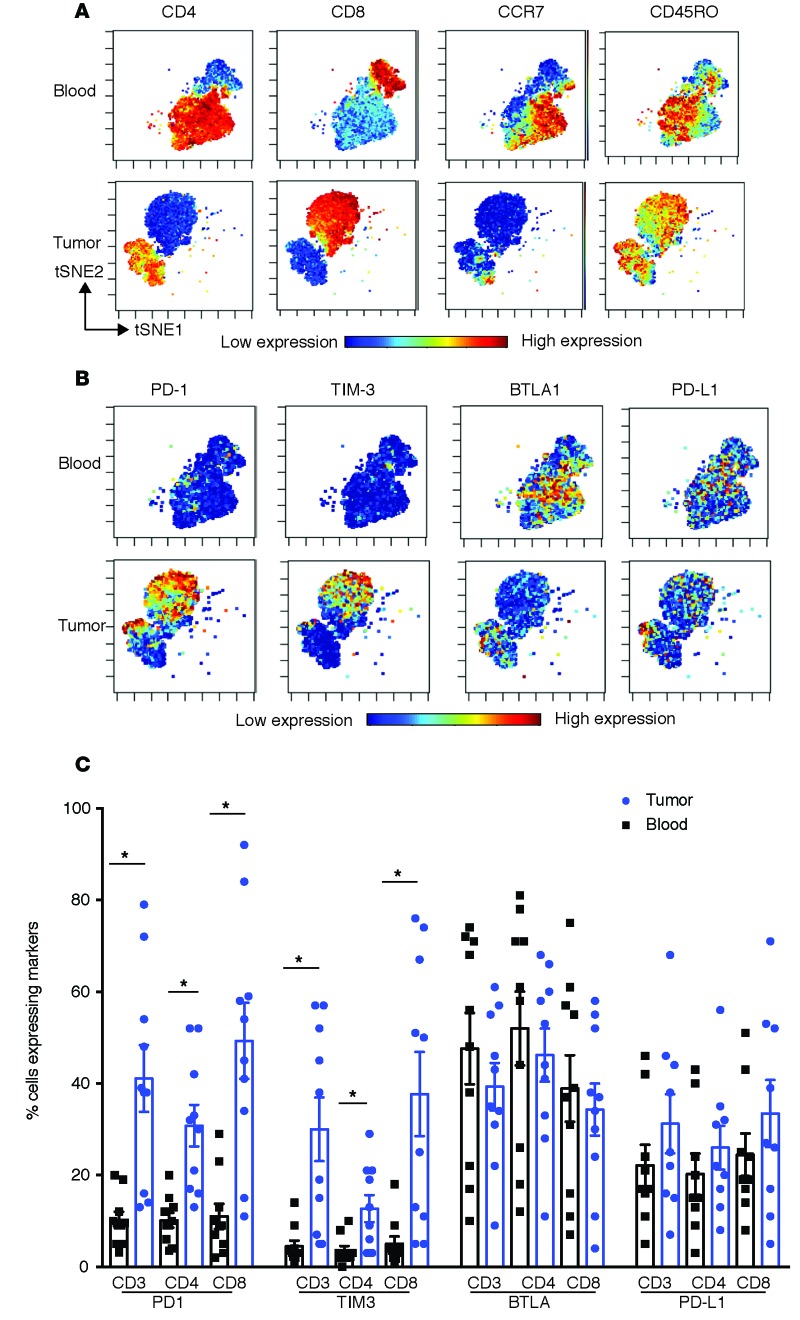
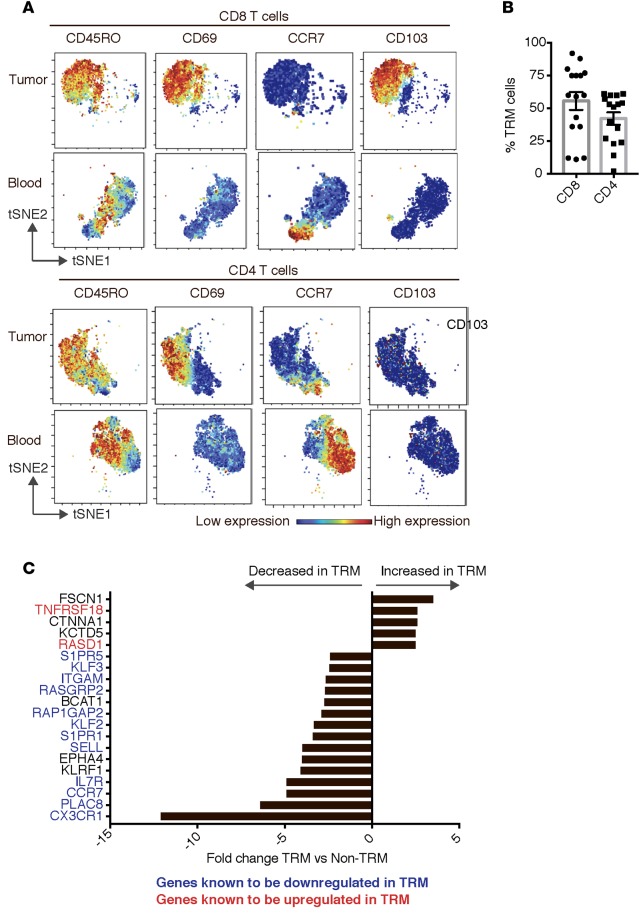
The initial goal of these studies was to characterize the phenotype and functional diversity of tumor-infiltrating immune cells, with a particular focus on the subset of cells expressing ICPs. To this end, we combined single-cell mass cytometry with analysis of functional profiles of T cells within individual metastases in melanoma patients (patient characteristics; Table 1). Compared with paired circulating cells, tumor-infiltrating T cells were enriched for CD8+ T cells with a memory phenotype (Figure 1A). Higher proportions of T cells within tumors expressed inhibitory checkpoint proteins PD-1 and TIM3 compared with T cells in circulation (Figure 1, B and C). Detailed analysis of memory T cells within tumors revealed that nearly 60% of CD8+ T cells and 50% of CD4+ T cells are CD45RO+CD69+CCR7–, consistent with the phenotype of TRM cells (Figure 2, A and B) (5, 12). CD69 is well recognized as a marker of TRM cells in all tissues (13). While CD69 was initially implicated as a marker of recent activation in the lymph node, the expression of CD69 in TRM cells is not thought to be a marker of recent T cell activation and is primarily implicated in tissue retention by downregulation of receptor for sphingosine-1-phosphate (S1P1R) (13). Nonetheless, in order to evaluate this issue further in the context of human tumor-associated TRM cells, we compared the gene expression profile of tumor-associated TRM cells with circulating T cells activated in vitro using anti-CD3/28 and sorted for the expression of CD69 (Supplemental Figures 1 and 2; supplemental material available online with this article; https://doi.org/10.1172/jci.insight.88955DS1). Genes implicated in tissue egress are indeed downregulated in tumor-associated CD4 and CD8+ TRM cells compared with CD69+ activated CD4 and CD8T cells (Supplemental Figure 1). Comparison of the gene expression profile of murine TRM cells with splenic TEM cells has been utilized to derive the core signature of murine CD8+ TRM cells (14, 15). Human melanoma tumor-associated TRM cells also demonstrated altered expression of these “core CD8+ TRM” genes compared with activated CD69+ T cells (Supplemental Figure 2). Comparison of gene expression profiles of flow-sorted TRM cells with non-TRM cells within the tumor tissue revealed that the top 20 differentially expressed genes in these subsets were again highly enriched for genes known to have altered expression in murine TRM cells and implicated in tissue retention (Figure 2C; see Supplemental Figure 3 for the sorting strategy) (13–15). Of the TRM cells, nearly half of the CD8 TRM cells, but <5% of CD4 TRM cells coexpress CD103 (Supplemental Figure 4). This is consistent with prior studies showing that in humans CD103 is mostly associated with CD8+ TRM cells in mucosal/epithelial tissues (5, 12). Consistent with studies in murine tissue, CD103+ and CD103– subsets of CD8+ melanoma-associated TRM cells had comparable expression of several genes in the core gene signatures of murine TRM cells (Supplemental Figure 5) (14, 15).
Table 1. Patient characteristics.
Figure 1. Melanoma tissue is enriched for memory T cells expressing higher levels of inhibitory checkpoints compared with T cells in peripheral blood.
Paired blood and tumor tissue (n = 10) were stained and analyzed together using single-cell mass cytometry. Data were acquired using a CyTOF2 machine and analyzed using the CyTOBank analysis software, including the viSNE analysis. (A) viSNE analysis of the CD3+ T cells in the blood and tumor of a representative patient. Expression of CD4/CD8/CCR7 and CD45RO is shown. (B) viSNE analysis of CD3+ T cells in paired blood and tumor tissue showing expression of immune checkpoint proteins PD-1, TIM3, BTLA, and PD-L1. Data are from a representative patient. (C) The expression of immune checkpoints on CD3, CD4, and CD8 T cells in paired blood and tumor tissue samples (n = 10). *P < 0.01 (paired t test followed by multiple test correction using Hochberg sequential test).
Figure 2. Melanoma tumors are enriched for tissue-resident memory T cells.
Paired blood and tumor tissue (n = 10) were stained and analyzed together using single-cell mass cytometry. Data were acquired using a CyTOF2 machine and analyzed using the CyTOBank analysis software, including the viSNE analysis. The top 20 genes that are differentially expressed between CD8 TRM and CD8 non-TRM cells from tumor tissue are shown. (A) Phenotypic analysis of the T cells within the tumor tissue. Data shows viSNE analysis of CD8+ and CD4+ T cell populations in paired peripheral blood as well as tumor tissue. (B) CD8 and CD4 TRM cells as a percentage of memory T cells within the tumor (n = 15). (C) Freshly obtained tumor-infiltrating lymphocytes from two different patients were flow sorted to isolate CD8 TRM (CD45RO+CD69+CCR7–CD8+) and CD8 non-TRM cells.
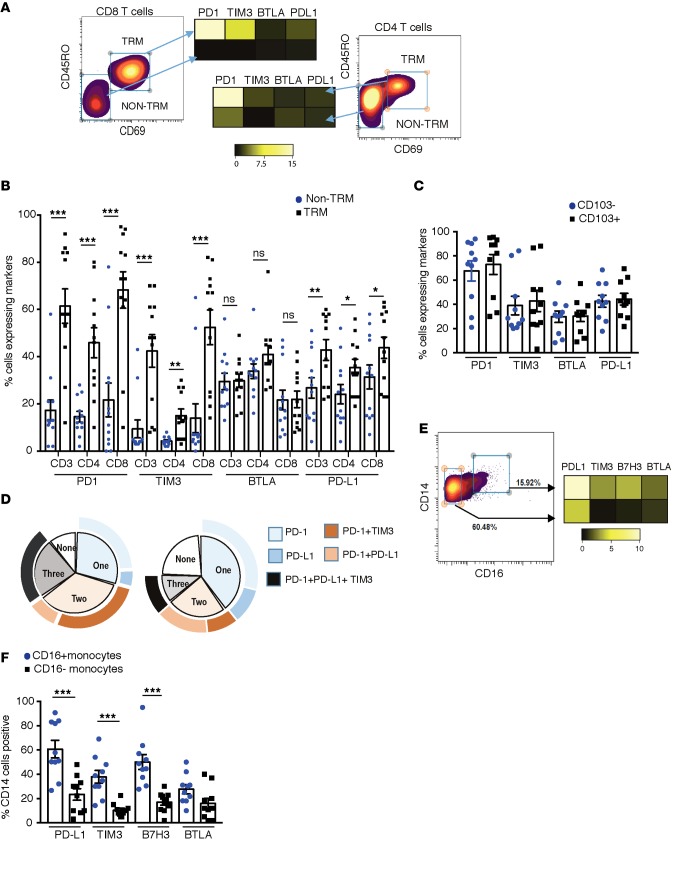
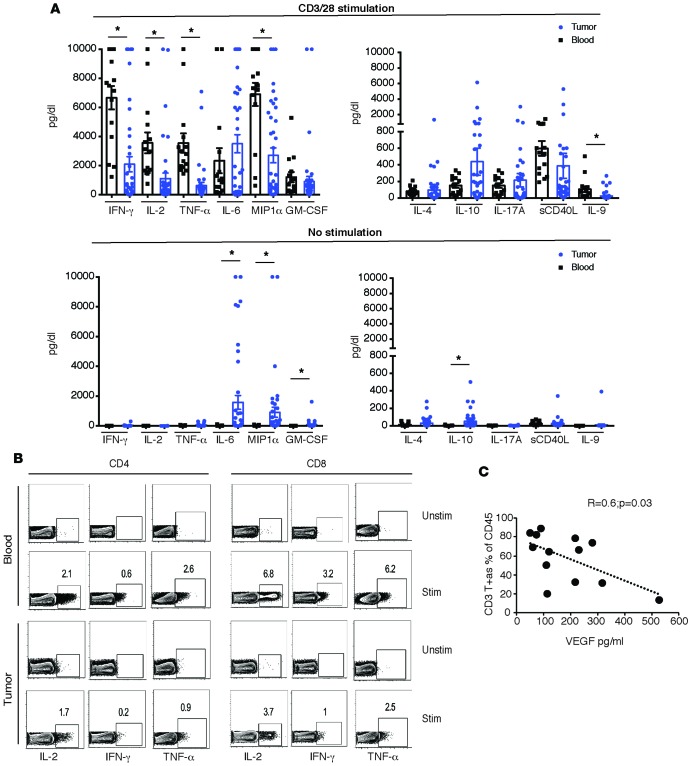
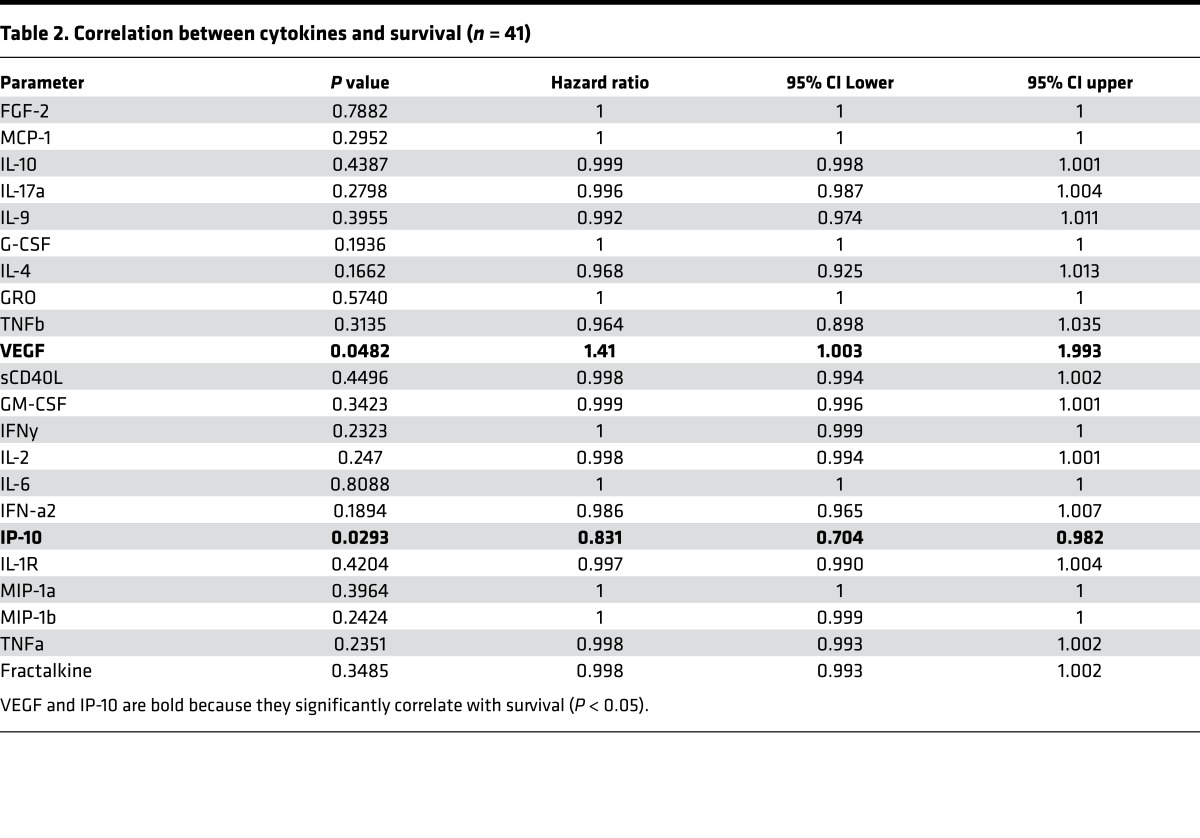
Expression of TRM markers emerged as the key discriminant of the subset of T cells expressing higher levels of PD-1, TIM3, and PD-L1 in the tumor (Figure 3, A and B). In contrast, expression of BTLA did not differ between TRM and non-TRM cells. The expression of PD-1, TIM3, BTLA, and PD-L1 was similar in CD103– as well as CD103+ CD8+ TRM cells within the tumors (Figure 3C). The majority of T cells coexpressed more than one ICP (Figure 3D). Evaluation of ICPs (PD-L1, TIM3, and B7H3) in myeloid cell subsets revealed that the expression of these markers was also not homogenous and was particularly enriched in CD16+ subset of myeloid cells (Figure 3, E and F). To understand functional properties of T cells within the tumor compartment, we compared cytokine profiles of paired blood/tumor T cells following anti-CD3/28 stimulation. Tumor-infiltrating T cells expressed lower levels of IL-2, IFN-γ, and TNF-α, but comparable levels of IL4, IL10, and IL17(Figure 4, A and B). Interestingly, VEGF level correlated inversely with the percentage of tumor-infiltrating CD3+ T cells (Figure 4C). Of the cytokines tested, IP-10 was associated with improved overall survival, while VEGF was associated with shortened survival (Table 2). Together, these data demonstrate that ICPs are particularly enriched in the subset of tumor-infiltrating lymphocytes (TILs) with phenotype and gene expression profile of TRM cells and in the CD16/FcγRIII+ subset of myeloid cells. They also illustrate that functional properties of T cells can affect outcome, with an inverse correlation between VEGF and both T cell infiltration and overall outcome.
Figure 3. Expression of inhibitory checkpoints on tumor-infiltrating immune cells.
(A) Heatmap showing expression of immune checkpoint proteins PD-1, TIM3, BTLA, and PD-L1 on TRM and non-TRM cells within the tumor of a representative patient. (B) The expression of immune checkpoint proteins PD-1, TIM3, BTLA, and PD-L1 on TRM and non-TRM cells within the tumor. The graph shows data from 10 patients. (C) The expression of PD-1, TIM3, BTLA, and PD-L1 immune checkpoint proteins on CD103–CD8 TRM as well as CD103+CD8 TRM cells. The graph shows data from 10 patients. (D) Single-cell mass cytometry was performed to simultaneously examine multiple checkpoint proteins (PD-1, PD-L1, and TIM3) on freshly isolated cells. A mean percentage of TRM cells that express none, one, two, or three checkpoint proteins on their surface is shown. Left panel: CD8+ TRM cells. Right panel: CD4+ TRM cells. (E) Heatmap showing expression of PD-L1, TIM3, B7H3, and BTLA on CD14+CD16– as well as CD14+CD16+ monocytes within tumor tissue. (F) Data for expression of PD-L1, TIM3, BTLA, and B7H3 on CD16+ and CD16– myeloid cells from 10 different patients. All bar graph data represent mean and SEM. *P < 0.05, **P < 0.005, ***P < 0.0005 (paired t test followed by multiple test correction using Hochberg sequential test).
Figure 4. Functional characteristics of tumor T cells.
Cytokine secretion by tumor-infiltrating lymphocytes (n = 41) and peripheral blood mononuclear cells (n = 15) was analyzed using multiplex ELISA assay. All values were capped at a maximum of 10,000, and Student t test was used for analysis. (A) Th1, Th2, and Th17 cytokines secreted with or without CD3/28 bead stimulation. *P < 0.05. (B) Tumor T cells and paired peripheral blood mononuclear cells were stimulated overnight with CD3/28 beads (STIM) or left unstimulated (UNSTIM). An intracellular cytokine secretion assay using flow cytometry for IL-2, IFN-γ, and TNF-α in CD4 and CD8 T cells from a representative patient is shown. (C) Correlation between VEGF levels obtained by ELISA and CD3+ T cells within the tumor, as assessed by CyTOF (n = 13).
Table 2. Correlation between cytokines and survival (n = 41).
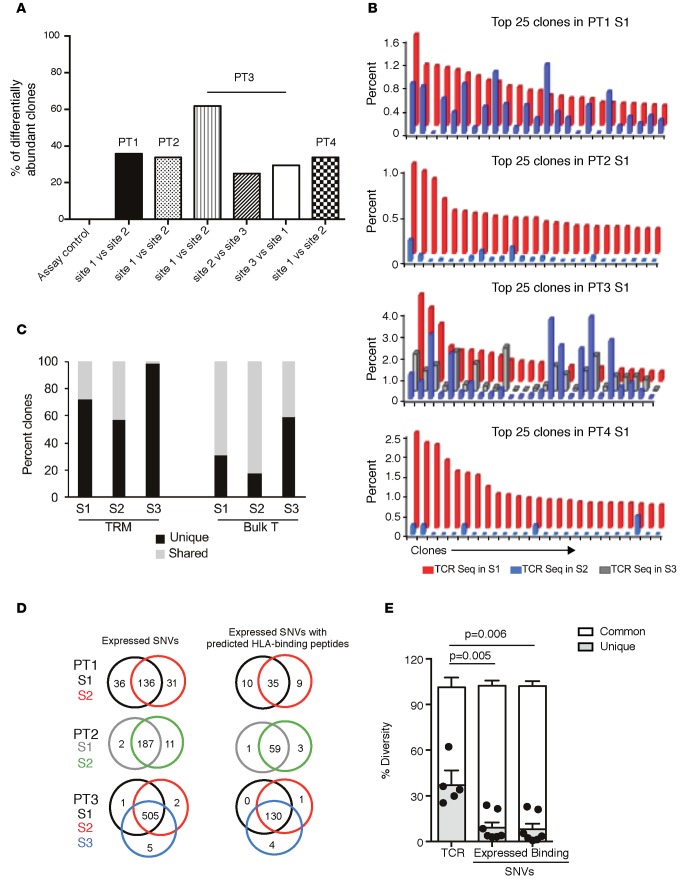
Tissue restriction of murine TRM cells without recirculation has been extensively studied in antigen-bearing parabiotic mice, wherein T cells do not migrate to other antigen-bearing tissues in spite of shared systemic circulation (5). The finding that metastatic lesions are enriched for TRM cells suggested the possibility that each of the metastatic lesions may contain a distinct microcosm of TRM cells without equilibration in spite of shared systemic circulation within the same host, analogous to the biology in parabiotic mice. To test this directly, we compared the TCRβ sequences from tumor tissues of 4 patients who underwent biopsy/excision of more than one metastatic site at the same time (clinical features in Table 3). The differential abundance tool of ImmunoSEQ analyzer v3.0 (Adaptive Biotechnologies) was utilized to quantify the overlap in TCRs. We observed substantial variation in differentially abundant clones between the individual biopsies, with 20% to 60% of TCRs being unique to individual lesions (Figure 5A). Top clones within the tumor tissue are the ones most likely to be tumor reactive (16). Comparison of top 25 clones within each metastatic lesion revealed that the nature or proportion of dominant clones in each lesion showed clear differences (Figure 5B). Thus, even in the cases (such as patients 1 and 3) in which some of the top 25 TCR clones are partially shared, their relative proportion is markedly different in each of the lesions. In one patient (patient 3), TRM cells were sorted from individual metastases, and deep sequencing was performed on sorted cells for the TCRβ locus. Data demonstrated that the interlesional diversity of TCRs was also present in the sorted TRM cells (Figure 5C). Diversity of TCR sequences in each of the metastatic lesions could in principle result from differences in mutations or neoepitopes within these lesions. In order to address this, we compared the genomic analysis of tumor cells from these lesions using whole-exome sequencing. The expression of somatic protein-altering single nucleotide variants (SNVs) as well as predicted HLA-binding epitopes was calculated for 9-mers and the HLA-A allele using published algorithms (16) and compared between different metastatic sites in the same patient (Figure 5D). The degree of TCR diversity between individual lesions was significantly higher than the corresponding differences in expressed SNVs (P = 0.005) or predicted peptide-binding SNVs (P = 0.006) (Figure 5E). Therefore, the genetic variability of TCRs between different metastatic lesions is greater than the variance in mutational or neoepitope load in tumor cells.
Table 3. Tumor tissue used for TCR sequencing.
Figure 5. Heterogeneity of T cell receptors in melanoma metastases and its comparison with expressed SNV and neoantigen load.
Genomic DNA obtained from tumor tissue was utilized to perform deep sequencing of the TCRβ loci. TCR sequencing data were analyzed using the ImmunoSEQ v3.0 analyzer. Tumors were also analyzed by exome sequencing. (A) The differential abundance tool (ImmunoSEQ analyzer) was utilized to compare overlap of TCR sequences between individual lesions from the same patient. (B) Comparison of top clonotypes between two different metastatic sites in patients 1, 2, and 4 and three different metastatic sites in patient 3. (C) Deep sequencing was performed for the TCRβ locus on sorted TRM cells from three different metastatic lesions (S1, S2, S3) in patient 3. The unique TCRs (black bar) and TCRs shared (gray bar) with other sites for sorted TRM cells as well as unsorted bulk tumor T cells from the same metastatic sites are shown. (D) Comparison of expressed and predicted peptide-binding SNVs from multiple metastases in patients 1, 2, and 3. (E) Compiled data for the differential abundance of TCR sequences and overlap of these sequences with all expressed SNVs (left) and overlap with those SNVs predicted to lead to MHC-binding peptides for the 3 patients shown in D. Data for an individual patient. P values obtained using paired t test are shown for comparison between unique TCR sequences in a lesion and SNVs with predicted HLA-binding peptides for the same lesion.
Discussion
In this study, we have analyzed tumor-infiltrating immune cells from metastatic melanoma lesions to make several findings of potential relevance to the application of immunotherapy in this setting. We show that T cells within metastatic lesions differ from their blood counterparts both in terms of the expression of ICPs and their functional properties. Expression of ICPs within melanoma metastases is particularly enriched within two distinct subsets of immune cells — both CD4 and CD8+ TRM cells and a CD16+ subset of myeloid cells. Enrichment of PD-1 within CD8+CD103+ T cells was previously described in the setting of surgically resected lung cancer (7). However, understanding the subset of immune cells that express ICPs is particularly relevant in the setting of patients with distant metastases, as these are the patients treated with ICP blockade. In contrast to CD8+ TRM cells within epithelial/mucosal tissues, CD103 is less reliable as a marker for human CD4+ TRM cells and CD8+ TRM cells within some tissues (5, 12, 17). We show that both CD103+ and CD103– subsets of CD8+ TRM cells within melanoma metastases are enriched in core TRM gene signature and that ICPs, including PD-1, TIM3, and PD-L1, are enriched in both of these TRM subsets. It is notable that PD-1–expressing T cells in melanoma were shown to be enriched for tumor-reactive T cells (18).
T cells within lesions also had altered functional properties compared with their blood counterparts. While some of these differences could be related to differences in methods for isolation of blood versus tissue T cells, it is unlikely to be the case as the expression of only a limited number of cytokines (IFN-γ, TNF-α, and IL2) was significantly altered. Reduction in cytokine production within TILs is consistent with their exhausted phenotype (19). Of the cytokines tested, only IP-10 and VEGF levels correlated with survival. Interestingly, VEGF levels also correlated inversely with T cell content of tumors, reminiscent of similar findings in ovarian cancer (20). The relationship between VEGF and immune cells is complex and involves both T cells and myeloid cells (21). However, the effect of VEGF on the biology of tumor-associated TRM cells should be explored, and inhibition of VEGF axis may synergize with ICP blockade (22).
The concept that ICPs are particularly enriched within TRM cells suggests that this subset may be a major target of ICP blockade. The ability of TRM cells to persist long term in tissues (23) may underlie the durability of clinical responses observed following ICP blockade. This long-term tissue/tumor persistence may also explain why TRM cells are enriched for the expression of ICPs. As cells with the TRM phenotype are known to remain in tissues without equilibration in parabiotic mice, it may help explain why the TCR sequences at individual metastases can differ significantly. Differences in TCRβ usages in individual melanoma metastases were also previously noted before the biology of TRM cells was known (24, 25).
As with T cells, only a subset of myeloid cells within tumors express ICPs such as PD-L1, and the expression of PD-L1 on myeloid cells has been correlated with responses to ICP blockade in some settings (26). While the expression of PD-L1 on circulating monocytes is well documented, our data show that the expression of PD-L1 within the myeloid compartment is particularly enriched within the CD16+ subset of nonclassical monocytes, implying that this subset may be an important target of ICP blockade. Interestingly, this subset was recently implicated in the context of depletion of regulatory T cells following ipilimumab (27). Myeloid cells may play an important role in terms of retention of TRM cells within tissues (28), and the effect of such TRM-macrophage networks in the context of tumors needs to be evaluated.
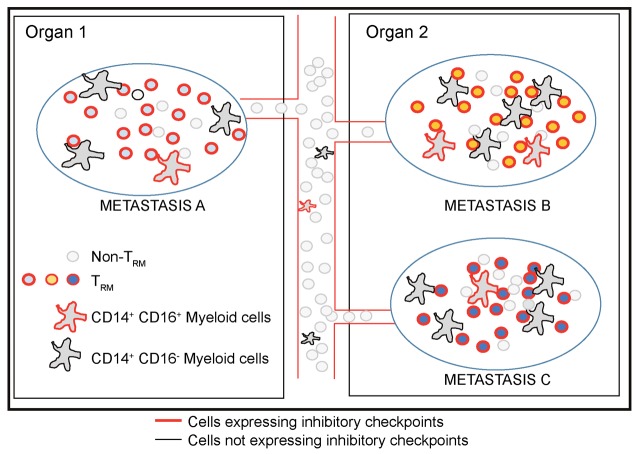
The concept of TCR diversity within individual metastatic lesions has several implications for both immune therapy and cancer biology (Figure 6). Several mechanisms may underlie the generation of this diversity, including the recruitment of T cells directed against different tumor antigens or against different epitopes from the same antigen at different sites. Irrespective of the underlying mechanism, interlesional diversity of TCRs may contribute to mixed responses of individual lesions occasionally observed following immune therapies. Lesion-specific differences in TCRs may also affect monitoring of immune responses in clinical studies (29–31), wherein the nature of the specific lesion biopsied before/after therapy should be considered. Adoptive transfer of tumor-infiltrating T cells typically isolated from a single lesion has shown promise in melanoma (32), but isolation of T cells from multiple lesions may provide a more diverse repertoire and should be explored. The ability to activate and retain TRM cells may be an important determinant of the T cell content of the tumor microenvironment and should be a goal for future vaccines (33, 34). One limitation of the data relating to TCR sequencing is the small numbers of patients studied. However, to our knowledge these are the first studies to compare TCR sequencing of multiple lesions in the same patient in the context of concurrent exome sequencing of melanoma tumors. If the interlesional heterogeneity is confirmed in larger studies, it should have major implications for ongoing efforts at monitoring tissue-based immunity in current clinical trials.
Figure 6. Intralesional and interlesional diversity of immune checkpoint proteins and TCRs in melanoma metastases.
Proposed model illustrating diversity of T cell receptors and subsets of cells expressing checkpoint proteins in the immune microenvironment of melanoma metastases. Immune checkpoints are particularly expressed in TRM cells and CD16+ myeloid cells. Each lesion includes distinct TCRs that do not equilibrate between metastases, in spite of highly overlapping antigenic load, analogous to the biology of TRM cells in parabiotic mice.
Advances in genetics have helped unravel the genetic complexity of melanoma as well as intratumoral heterogeneity (11, 35). Our data show that differences in TCRs resident within these lesions are greater than the genetic differences between individual metastases, and therefore, these TCR differences are likely not explained simply by differences in candidate neoepitopes in these lesions. As the TCR analysis in this study was limited to TCRβ, differences in TCR diversity that we observed may be even greater if TCRα/β pairs are considered. A single antigen/epitope may be recognized by several genetically distinct TCRs with potential differences in avidity or other functional properties. TCR diversity could also result from T cells against shared antigens. Notably, however, consistent with TRM biology, TCRs do not seem to equilibrate between individual metastatic lesions in spite of highly overlapping mutation load. While the pathways leading to recruitment and retention of TRM cells in tissues remain an area of active investigation, a recent study suggested that both TRM and TCM cells share a common precursor in the setting of skin immunization (34). While trafficking to peripheral tissue may be driven by inflammatory signals, the retention and accumulation of TRM within peripheral tissues may depend on continued presence of antigen within the tissue site (36). In addition, the capacity of T cells to infiltrate or remain within individual tissues may also depend on the expression of specific chemokines or retention integrins, which in turn may affect immune control of tumors (37–39). Cross-talk between tumors and the immune system may in principle affect the evolution of either system (10). Future studies will explore whether the observed differences in genetics of TCRs resident at individual sites may contribute to differential evolution of tumors within individual metastases.
Methods
Isolation of blood mononuclear cells and tumor-infiltrating cells.
Tissue and blood samples were collected from melanoma patients (clinical characteristics in Table 1) by the Tissue Resource Core of the Yale SPORE in Skin Cancer, with informed written consent obtained from participants according to Health Insurance Portability and Accountability Act (HIPAA) regulations. TILs were isolated following manual dissociation of the tissue, as described previously (40). Briefly, tumor tissue was dissected manually using surgical blade, washed, and filtered through a 70-micron filter. In some cases, the tumor tissue was incubated with medium containing collagenase and DNAse1 for 30 minutes at 37°C. The TILs obtained were counted and used for various assays, described below. Peripheral blood mononuclear cells (PBMCs) were isolated using Ficoll density gradient centrifugation. Freshly obtained TILs and PBMCs were used for phenotypic analysis by single-cell mass cytometry as well as for cytokine secretion assay. Inclusion of the specific lesion for individual assays was based on the number of TILs isolated, as noted under individual assay. For some experiments, TRM and non-TRM cells were flow sorted prior to analysis. The number of sorted TRM and non-TRM cells was >105 cells in all experiments.
Single-cell mass cytometry.
TILs (n = 20) and PBMCs (n = 10) were suspended at 1 × 10⁶ to 3 × 10⁶ per ml in 1× PBS for viability staining by Cell-ID Cisplatin (Fluidigm Sciences). The staining was quenched with MaxPar Cell staining buffer and washed twice before surface and intracellular staining, as per manufacturer’s protocol (Fluidigm Sciences). Cells were stained with the following surface markers: CD45-89Y, B7H3-141Pr, CD19-142Nd, C-kit-143Nd, CD27-144Nd, CD4-145Nd, CD8-146Nd, CD11c-147Sm, CD14-148Nd, CD25-149Sm, CD103-151Eu, TIM3-153Eu, CD3-154Sm, CXCR5-155Gd, CD16-156Gd, CD33-158Gd, CCR7-159Tb, 41BB-161Dy, BTLA-163Dy, CD95-164Dy, CD45RO-165Ho, HLADR-166Er, CD69-169Tm, CTLA4-170Er, CD38-172Yb, ICOS-173Yb, PDL1-174Yb, PD1-175Lu, and CD56-176Yb (Supplemental Table 1). After staining, cells were washed, fixed, permeabilized, and stained with the following markers: PLZF-152Sm, GATA3-167Er, Ki67-168Er, TBET-160Gd, Foxp3-162Dy, and Granzyme-171Yb. Cells were stained with MaxPar Intercalator-Ir prior to acquisition on CyTOF 2 instrument (DVS; Fluidigm Sciences). All data were analyzed and plots were generated using the DVS Cytobank software (Cytobank), including viSNE analysis as previously described (41). viSNE is an unsupervised cluster analysis tool, which allows visualization of high-parameter data obtained with single-cell mass cytometry in two dimensions based on the t-Distributed Stochastic Neighbor Embedding (tSNE) algorithm (41). Each event on the scatter plot represents a single cell, and the distance between cells is a representation of the pairwise distance between the cells in high dimension. tSNE1 and tSNE2 are the axes used to depict the data, and the color represents the expression of the marker visualized.
Functional profiling.
The capacity of T cells from TILs (n = 41) or PBMCs (n = 15) to secrete a panel of cytokines following TCR-based stimulation was utilized as a measure of their functional properties (42, 43). Freshly isolated TILs, as described earlier, were cultured in medium alone or with anti-CD3/28 beads in 200 μl of 5% PHS (0.2 million/well in 5% pooled human serum). The cell supernatant was collected 48 hours later and analyzed using a multiplex cytokine ELISA assay following the manufacturer’s instructions (38-plex human panel, Millipore). The samples were collected on a LuminexR 100 instrument (Luminex Corporation) and analyzed using the xPONENT software (Luminex Corporation). Ratios of Th1/Th2/Th17 cytokines for each sample were computed separately.
TILs obtained from tumor tissue were flow sorted to obtain purified CD4 and CD8 TRM cells (CD45RO+CD69+CCR7–CD4+, CD45RO+CD69+CCR7–CD8+). In one patient, we also sorted CD103+ and CD103– CD8 TRM cells. Peripheral blood T cells were activated with CD3/28 beads and activated CD69+CD4+ and CD8+ T cells were isolated using flow sort. RNA from these T cell subsets was utilized to analyze gene expression profiles using U133Plus2.0 Affymetrix chips. Gene expression data were analyzed using GeneSpring.
TCR sequencing.
Genomic DNA was isolated from metastatic lesions and utilized for high-throughput deep sequencing of rearranged TCRβ loci by Adaptive Biotechnologies with a mean sequencing depth of 62X coverage and productive fraction of 0.75 as previously described (43–45). Genomic DNA used for the TCR sequencing was obtained from fresh tumor tissue or tumor that was snap frozen. In addition, for patient 3, >105 TRM cells were obtained from each of 3 different metastatic lesions prior to performing TCRβ sequencing. The TCRβ loci sequencing analysis does not differentiate between CD4 and CD8 T cells. Data were analyzed with the help of the ImmunoSEQ analyzer v3.0 platform (Adaptive Biotechnologies). The differential abundance tool was utilized to evaluate TCR diversity between metastatic sites from the same patient. Productive TCR sequences between samples were compared using Fisher’s exact test. P value of <0.0001 with Benjamini Hochberg used to correct for false discovery rate, as described previously (46).
Whole-exome sequencing analysis.
Whole-exome sequencing was performed on the tumor samples from 3 patients with multiple biopsies. Exome sequencing and somatic variant calling was performed as described earlier (35). In particular, we used bwa and SAMtools for read alignment and SNV calling, employing fully validated filtering criteria for identifying high-quality DNA variants. Only somatic, expressed, and protein-altering SNVs were used for further analysis. We used a sliding window approach for constructing 9-mer peptides containing the mutated amino acids corresponding to all somatic missense mutations. We established protein expression using previously described melanoma gene expression data (47). We assigned peptide HLA affinity using netMHCpan 2.8 (48, 49). High-binding affinity peptides were identified by using an affinity threshold of <50nM for HLA-A.
Statistics.
Cox regression analysis was utilized for correlation of immunologic data with survival. Two-tailed paired t test was used to compare groups. Pearson correlation was used to correlate phenotypic and functional data. Significance was set at P < 0.05. All bar graphs show mean and SEM.
Study approval.
Tissue and blood samples were collected by the Tissue Resource Core of the Yale SPORE in Skin Cancer using protocols approved by the IRD of Yale University (New Haven, Connecticut, USA). Patients signed Yale University IRB-approved informed consent prior to giving blood and tissue samples for these studies.
Author contributions
CSB, NB, and KK designed and performed experiments, analyzed data, and helped write the manuscript; ZM and RD performed experiments and analyzed data; MK and NP analyzed sequencing data; SA, DN, HK, AB, and RH assisted with obtaining clinical specimens and analyzed data; RV and YD helped with data analysis; MS and MVD analyzed data and designed experiments; and KMD designed and supervised the entire study, analyzed data, performed experiments, and wrote manuscript.
Supplementary Material
Acknowledgments
This work was supported in part by National Institutes of Health grants R01-AI0792222 (to KMD) and CA106802 and CA197603 (to MVD) as well as by Hyundai Hope on Wheels (to KMD). Research reported in this publication was also supported in part by the Yale SPORE in Skin Cancer, which is funded by the National Cancer Institute, National Institutes of Health, under award number 1 P50 CA121974 (RH, PI). We thank colleagues at Adaptive Biotechnologies for help with analysis of TCR sequences.
Footnotes
Conflict of interest: The authors have declared that no conflict of interest exists.
Reference information:JCI Insight. 2016;1(21):e88955. doi:10.1172/jci.insight.88955.
Contributor Information
Noffar Bar, Email: noffar.bar@yale.edu.
Krishna Kadaveru, Email: krishnakadaveru@gmail.com.
Michael Krauthammer, Email: michael.krauthammer@yale.edu.
Zifeng Mai, Email: frederickmai@gmail.com.
Stephan Ariyan, Email: stephan.ariyan@yale.edu.
Deepak Narayan, Email: deepak.narayan@yale.edu.
Harriet Kluger, Email: harriet.kluger@yale.edu.
Yanhong Deng, Email: yanhong.deng@yale.edu.
Rakesh Verma, Email: rakesh.verma@yale.edu.
Rituparna Das, Email: rituparna.das@yale.edu.
Antonella Bacchiocchi, Email: antonietta.bacchiocchi@yale.edu.
Ruth Halaban, Email: ruth.halaban@yale.edu.
Mario Sznol, Email: mario.sznol@yale.edu.
References
- 1.Bindea G, Mlecnik B, Angell HK, Galon J. The immune landscape of human tumors: Implications for cancer immunotherapy. Oncoimmunology. 2014;3(1):e27456. doi: 10.4161/onci.27456. [DOI] [PMC free article] [PubMed] [Google Scholar]
- 2.Chen DS, Mellman I. Oncology meets immunology: the cancer-immunity cycle. Immunity. 2013;39(1):1–10. doi: 10.1016/j.immuni.2013.07.012. [DOI] [PubMed] [Google Scholar]
- 3.Sznol M, Chen L. Antagonist antibodies to PD-1 and B7-H1 (PD-L1) in the treatment of advanced human cancer. Clin Cancer Res. 2013;19(5):1021–1034. doi: 10.1158/1078-0432.CCR-12-2063. [DOI] [PMC free article] [PubMed] [Google Scholar]
- 4.Mueller SN, Gebhardt T, Carbone FR, Heath WR. Memory T cell subsets, migration patterns, and tissue residence. Annu Rev Immunol. 2013;31:137–161. doi: 10.1146/annurev-immunol-032712-095954. [DOI] [PubMed] [Google Scholar]
- 5.Schenkel JM, Masopust D. Tissue-resident memory T cells. Immunity. 2014;41(6):886–897. doi: 10.1016/j.immuni.2014.12.007. [DOI] [PMC free article] [PubMed] [Google Scholar]
- 6.Sathaliyawala T, et al. Distribution and compartmentalization of human circulating and tissue-resident memory T cell subsets. Immunity. 2013;38(1):187–197. doi: 10.1016/j.immuni.2012.09.020. [DOI] [PMC free article] [PubMed] [Google Scholar]
- 7.Djenidi F, et al. CD8+CD103+ tumor-infiltrating lymphocytes are tumor-specific tissue-resident memory T cells and a prognostic factor for survival in lung cancer patients. J Immunol. 2015;194(7):3475–3486. doi: 10.4049/jimmunol.1402711. [DOI] [PubMed] [Google Scholar]
- 8.Webb JR, Milne K, Watson P, Deleeuw RJ, Nelson BH. Tumor-infiltrating lymphocytes expressing the tissue resident memory marker CD103 are associated with increased survival in high-grade serous ovarian cancer. Clin Cancer Res. 2014;20(2):434–444. doi: 10.1158/1078-0432.CCR-13-1877. [DOI] [PubMed] [Google Scholar]
- 9.Wong KL, Yeap WH, Tai JJ, Ong SM, Dang TM, Wong SC. The three human monocyte subsets: implications for health and disease. Immunol Res. 2012;53(1-3):41–57. doi: 10.1007/s12026-012-8297-3. [DOI] [PubMed] [Google Scholar]
- 10.Jamal-Hanjani M, Quezada SA, Larkin J, Swanton C. Translational implications of tumor heterogeneity. Clin Cancer Res. 2015;21(6):1258–1266. doi: 10.1158/1078-0432.CCR-14-1429. [DOI] [PMC free article] [PubMed] [Google Scholar]
- 11.Sanborn JZ, et al. Phylogenetic analyses of melanoma reveal complex patterns of metastatic dissemination. Proc Natl Acad Sci USA. 2015;112(35):10995–11000. doi: 10.1073/pnas.1508074112. [DOI] [PMC free article] [PubMed] [Google Scholar]
- 12.Watanabe R, et al. Human skin is protected by four functionally and phenotypically discrete populations of resident and recirculating memory T cells. Sci Transl Med. 2015;7(279):279ra39. doi: 10.1126/scitranslmed.3010302. [DOI] [PMC free article] [PubMed] [Google Scholar]
- 13.Park CO, Kupper TS. The emerging role of resident memory T cells in protective immunity and inflammatory disease. Nat Med. 2015;21(7):688–697. doi: 10.1038/nm.3883. [DOI] [PMC free article] [PubMed] [Google Scholar]
- 14.Mackay LK, et al. The developmental pathway for CD103(+)CD8+ tissue-resident memory T cells of skin. Nat Immunol. 2013;14(12):1294–1301. doi: 10.1038/ni.2744. [DOI] [PubMed] [Google Scholar]
- 15.Wakim LM, et al. The molecular signature of tissue resident memory CD8 T cells isolated from the brain. J Immunol. 2012;189(7):3462–3471. doi: 10.4049/jimmunol.1201305. [DOI] [PMC free article] [PubMed] [Google Scholar]
- 16.Pasetto A, et al. Tumor- and neoantigen-reactive T-cell receptors can ce identified based on their frequency in fresh tumor. Cancer Immunol Res. 2016;4(9):734–743. doi: 10.1158/2326-6066.CIR-16-0001. [DOI] [PMC free article] [PubMed] [Google Scholar]
- 17.Clark RA. Resident memory T cells in human health and disease. Sci Transl Med. 2015;7(269):269rv1. doi: 10.1126/scitranslmed.3010641. [DOI] [PMC free article] [PubMed] [Google Scholar]
- 18.Gros A, et al. PD-1 identifies the patient-specific CD8+ tumor-reactive repertoire infiltrating human tumors. J Clin Invest. 2014;124(5):2246–2259. doi: 10.1172/JCI73639. [DOI] [PMC free article] [PubMed] [Google Scholar]
- 19.Baitsch L, et al. Exhaustion of tumor-specific CD8+ T cells in metastases from melanoma patients. J Clin Invest. 2011;121(6):2350–2360. doi: 10.1172/JCI46102. [DOI] [PMC free article] [PubMed] [Google Scholar]
- 20.Zhang L, et al. Intratumoral T cells, recurrence, and survival in epithelial ovarian cancer. N Engl J Med. 2003;348(3):203–213. doi: 10.1056/NEJMoa020177. [DOI] [PubMed] [Google Scholar]
- 21.Li YL, Zhao H, Ren XB. Relationship of VEGF/VEGFR with immune and cancer cells: staggering or forward? Cancer Biol Med. 2016;13(2):206–214. doi: 10.20892/j.issn.2095-3941.2015.0070. [DOI] [PMC free article] [PubMed] [Google Scholar]
- 22.Hodi FS, et al. Bevacizumab plus ipilimumab in patients with metastatic melanoma. Cancer Immunol Res. 2014;2(7):632–642. doi: 10.1158/2326-6066.CIR-14-0053. [DOI] [PMC free article] [PubMed] [Google Scholar]
- 23.Thome JJ, et al. Spatial map of human T cell compartmentalization and maintenance over decades of life. Cell. 2014;159(4):814–828. doi: 10.1016/j.cell.2014.10.026. [DOI] [PMC free article] [PubMed] [Google Scholar]
- 24.thor Straten P, et al. In situ T cell responses against melanoma comprise high numbers of locally expanded T cell clonotypes. J Immunol. 1999;163(1):443–447. [PubMed] [Google Scholar]
- 25.Yazdi AS, et al. Heterogeneity of T-cell clones infiltrating primary malignant melanomas. J Invest Dermatol. 2006;126(2):393–398. doi: 10.1038/sj.jid.5700082. [DOI] [PubMed] [Google Scholar]
- 26.Powles T, et al. MPDL3280A (anti-PD-L1) treatment leads to clinical activity in metastatic bladder cancer. Nature. 2014;515(7528):558–562. doi: 10.1038/nature13904. [DOI] [PubMed] [Google Scholar]
- 27.Romano E, et al. Ipilimumab-dependent cell-mediated cytotoxicity of regulatory T cells ex vivo by nonclassical monocytes in melanoma patients. Proc Natl Acad Sci USA. 2015;112(19):6140–6145. doi: 10.1073/pnas.1417320112. [DOI] [PMC free article] [PubMed] [Google Scholar]
- 28.Iijima N, Iwasaki A. T cell memory. A local macrophage chemokine network sustains protective tissue-resident memory CD4 T cells. Science. 2014;346(6205):93–98. doi: 10.1126/science.1257530. [DOI] [PMC free article] [PubMed] [Google Scholar]
- 29.Malyguine AM, Strobl SL, Shurin MR. Immunological monitoring of the tumor immunoenvironment for clinical trials. Cancer Immunol Immunother. 2012;61(2):239–247. doi: 10.1007/s00262-011-1148-6. [DOI] [PMC free article] [PubMed] [Google Scholar]
- 30.Kluger HM, et al. Characterization of PD-L1 expression and associated T-cell infiltrates in metastatic melanoma samples from variable anatomic sites. Clin Cancer Res. 2015;21(13):3052–3060. doi: 10.1158/1078-0432.CCR-14-3073. [DOI] [PMC free article] [PubMed] [Google Scholar]
- 31.Das R, et al. Combination therapy with anti-CTLA-4 and anti-PD-1 leads to distinct immunologic changes in vivo. J Immunol. 2015;194(3):950–959. doi: 10.4049/jimmunol.1401686. [DOI] [PMC free article] [PubMed] [Google Scholar]
- 32.Restifo NP, Dudley ME, Rosenberg SA. Adoptive immunotherapy for cancer: harnessing the T cell response. Nat Rev Immunol. 2012;12(4):269–281. doi: 10.1038/nri3191. [DOI] [PMC free article] [PubMed] [Google Scholar]
- 33.Yu CI, et al. Human CD1c+ dendritic cells drive the differentiation of CD103+ CD8+ mucosal effector T cells via the cytokine TGF-β. Immunity. 2013;38(4):818–830. doi: 10.1016/j.immuni.2013.03.004. [DOI] [PMC free article] [PubMed] [Google Scholar]
- 34.Gaide O, et al. Common clonal origin of central and resident memory T cells following skin immunization. Nat Med. 2015;21(6):647–653. doi: 10.1038/nm.3860. [DOI] [PMC free article] [PubMed] [Google Scholar]
- 35.Krauthammer M, et al. Exome sequencing identifies recurrent somatic RAC1 mutations in melanoma. Nat Genet. 2012;44(9):1006–1014. doi: 10.1038/ng.2359. [DOI] [PMC free article] [PubMed] [Google Scholar]
- 36.Khan TN, Mooster JL, Kilgore AM, Osborn JF, Nolz JC. Local antigen in nonlymphoid tissue promotes resident memory CD8+ T cell formation during viral infection. J Exp Med. 2016;213(6):951–966. doi: 10.1084/jem.20151855. [DOI] [PMC free article] [PubMed] [Google Scholar]
- 37.Jacquelot N, et al. Chemokine receptor patterns in lymphocytes mirror metastatic spreading in melanoma. J Clin Invest. 2016;126(3):921–937. doi: 10.1172/JCI80071. [DOI] [PMC free article] [PubMed] [Google Scholar]
- 38.Salerno EP, Olson WC, McSkimming C, Shea S, Slingluff CL. T cells in the human metastatic melanoma microenvironment express site-specific homing receptors and retention integrins. Int J Cancer. 2014;134(3):563–574. doi: 10.1002/ijc.28391. [DOI] [PMC free article] [PubMed] [Google Scholar]
- 39.Boddupalli CS, et al. ABC transporters and NR4A1 identify a quiescent subset of tissue-resident memory T cells. J Clin Invest. 2016;126(10):3905–3916. doi: 10.1172/JCI85329. [DOI] [PMC free article] [PubMed] [Google Scholar]
- 40.Dudley ME, Wunderlich JR, Shelton TE, Even J, Rosenberg SA. Generation of tumor-infiltrating lymphocyte cultures for use in adoptive transfer therapy for melanoma patients. J Immunother. 2003;26(4):332–342. doi: 10.1097/00002371-200307000-00005. [DOI] [PMC free article] [PubMed] [Google Scholar]
- 41.Amir el-AD, et al. viSNE enables visualization of high dimensional single-cell data and reveals phenotypic heterogeneity of leukemia. Nat Biotechnol. 2013;31(6):545–552. doi: 10.1038/nbt.2594. [DOI] [PMC free article] [PubMed] [Google Scholar]
- 42.Sehgal K, et al. Clinical and pharmacodynamic analysis of pomalidomide dosing strategies in myeloma: impact of immune activation and cereblon targets. Blood. 2015;125(26):4042–4051. doi: 10.1182/blood-2014-11-611426. [DOI] [PMC free article] [PubMed] [Google Scholar]
- 43.Nair S, et al. Type II NKT-TFH cells against Gaucher lipids regulate B-cell immunity and inflammation. Blood. 2015;125(8):1256–1271. doi: 10.1182/blood-2014-09-600270. [DOI] [PMC free article] [PubMed] [Google Scholar]
- 44.Emerson R, Sherwood A, Desmarais C, Malhotra S, Phippard D, Robins H. Estimating the ratio of CD4+ to CD8+ T cells using high-throughput sequence data. J Immunol Methods. 2013;391(1-2):14–21. doi: 10.1016/j.jim.2013.02.002. [DOI] [PubMed] [Google Scholar]
- 45.Robins HS, et al. Comprehensive assessment of T-cell receptor beta-chain diversity in alphabeta T cells. Blood. 2009;114(19):4099–4107. doi: 10.1182/blood-2009-04-217604. [DOI] [PMC free article] [PubMed] [Google Scholar]
- 46.DeWitt WS, et al. Dynamics of the cytotoxic T cell response to a model of acute viral infection. J Virol. 2015;89(8):4517–4526. doi: 10.1128/JVI.03474-14. [DOI] [PMC free article] [PubMed] [Google Scholar]
- 47.Tworkoski K, et al. Phosphoproteomic screen identifies potential therapeutic targets in melanoma. Mol Cancer Res. 2011;9(6):801–812. doi: 10.1158/1541-7786.MCR-10-0512. [DOI] [PMC free article] [PubMed] [Google Scholar]
- 48.Hoof I, et al. NetMHCpan, a method for MHC class I binding prediction beyond humans. Immunogenetics. 2009;61(1):1–13. doi: 10.1007/s00251-008-0341-z. [DOI] [PMC free article] [PubMed] [Google Scholar]
- 49.Nielsen M, et al. NetMHCpan, a method for quantitative predictions of peptide binding to any HLA-A and -B locus protein of known sequence. PLoS One. 2007;2(8):e796. doi: 10.1371/journal.pone.0000796. [DOI] [PMC free article] [PubMed] [Google Scholar]
Associated Data
This section collects any data citations, data availability statements, or supplementary materials included in this article.


