Abstract
Background
Mutations in SCN2B, encoding voltage-gated sodium channel (VGSC) β2 subunits, are associated with human cardiac arrhythmias, including atrial fibrillation and Brugada syndrome. Because of this, we propose that β2 subunits play critical roles in the establishment or maintenance of normal cardiac electrical activity in vivo.
Methods and Results
To understand the pathophysiological roles of β2 in the heart, we investigated the cardiac phenotype of Scn2b null mice. We observed reduced sodium and potassium current density in ventricular myocytes, as well as conduction slowing in the right ventricular outflow tract region. Functional re-entry, resulting from the interplay between slowed conduction, prolonged repolarization, and increased incidence of premature ventricular complexes, was found to underlie the mechanism of spontaneous polymorphic ventricular tachycardia. Scn5a transcript levels were similar in Scn2b null and wild type ventricles, as were levels of Nav1.5 protein, suggesting that similar to previous work in neurons, the major function of β2 subunits in the ventricle is to chaperone VGSC α subunits to the plasma membrane. Interestingly, Scn2b deletion resulted in region-specific effects in the heart. Scn2b null atria had normal levels of sodium current density compared to wild type. Scn2b null hearts were more susceptible to atrial fibrillation, had increased levels of fibrosis, and higher repolarization dispersion than WT littermates.
Conclusions
Genetic deletion of Scn2b in mice results in ventricular and atrial arrhythmias, consistent with reported SCN2B mutations in human patients.
Keywords: sodium channels, potassium channels, fibrosis, action potential, optical mapping
Journal Subject Terms: Animal Models of Human Disease, Basic Science Research, Arrhythmias, Ion Channels/Membrane Transport
Introduction
Voltage-gated sodium channels (VGSCs) are responsible for the upstroke of the cardiac action potential (AP) and are required for impulse propagation in the heart1. They are composed of one pore-forming α subunit and two non-pore-forming β subunits1. While α subunits are sufficient for conduction, β subunits regulate sodium current (INa) by modulating kinetics, voltage-dependence, and channel cell surface expression2. In addition, some VGSC β subunits regulate potassium currents (IK) and function as cell adhesion molecules that are substrates for sequential cleavage by BACE-1 and γ-secretase2, 3. Mutations in the genes encoding β subunits are implicated in human disease, including cardiac arrhythmia2, 4. Mutations in SCN2B, encoding β2, are associated with atrial fibrillation (AF) and Brugada syndrome (BrS) in humans5, 6, suggesting that β2 is critical in establishing or maintaining normal cardiac electrical activity. β2 is covalently linked to α, including the major cardiac VGSC, NaV1.5, via disulfide bonds7. β2 enhances the trafficking of neuronal VGSC α subunits to the plasma membrane and modulates the voltage-dependence of channel gating8, 9. Consistent with the channel trafficking role of β2, Scn2b null neurons have reduced VGSC cell surface expression with no change in total cellular protein levels10. Heterologous co-expression of NaV1.5 with a SCN2B patient mutation linked to arrhythmia resulted in reduced INa density compared to NaV1.5 alone, suggesting defective cell surface VGSC trafficking5, 6. However, the role of β2 in heart has not been explored in vivo. Here, we test the hypothesis that β2 plays critical roles in cardiac excitability via regulation of cell surface VGSC levels and INa density. We report changes in INa and, unexpectedly IK, density as well as ventricular and atrial arrhythmias in Scn2b null mice. These novel results advance our understanding of the physiological and pathophysiological roles of β2 in the heart.
Methods
Myocyte isolation, electrophysiological recording, qRT-PCR, western blot, super-resolution patch clamp, optical mapping, intracardiac recording, assessment of fibrosis, and statistical analysis are described in Supplemental Material.
Animals
This study was carried out in accordance with the Guide for the Care and Use of Laboratory Animals of the National Institutes of Health and with approval from the University of Michigan Institutional Animal Care and Use Committee. Male and female Scn2b null and wildtype (WT) mice8, congenic on the C57BL/6J background for over 20 generations, were used at ages indicated in each method in Supplemental Material.
Cell isolation
WT and Scn2b null cardiac myocytes were acutely isolated10.
Single Cell Electrophysiology
Voltage clamp INa and IK recordings were performed at room temperature (RT). Current clamp recordings were acquired at 37°C. Cells with a diastolic membrane potential more negative than −65 mV were used for analysis.
qRT-PCR
qRT-PCR was performed as described11.
Western blotting
Western blots were performed as described11.
Optical Mapping
Ventricular mapping
Hearts were perfused through the aorta with warm, oxygenated Tyrode’s solution followed by 7 μM Blebbistatin (Cayman Chemical)12, 13 and 100 μM Di-4-ANEPPS (Life Technologies) to uncouple excitation-contraction and to stain the heart, respectively. High-resolution optical mapping was performed, imaging at 800 frames per second. Optical movies were recorded at baseline and at progressively shorter cycle lengths.
Atrial Mapping
The atrium was excised and a camera positioned to face the posterior walls of both atria. Arrhythmias were induced by applying burst pacing at 66.67 Hz for 5 or 10 s before and after carbachol administration.
Intracardiac recording
An octapolar catheter (Science) was inserted through the jugular vein and advanced into the right atrium (RA) and ventricle. Programmed electrical stimulation was assessed to determine the basal sinus node recovery time (SNRT), atrial refractory period (AERP), atrio-ventricular nodal effective refractory period (AVERP), and ventricular refractory period (VERP). Arrhythmia inducibility was assessed by application of 12–18 atrial bursts of pacing before and after intraperitoneal (IP) carbachol (50 ng/g) administration. AF was defined as the occurrence of rapid and fragmented atrial electrograms (lack of regular P waves) with irregular AV-nodal conduction and ventricular rhythm, all lasting at least 1 s.
Assessment of Fibrosis
LA and RA posterior walls from both genders and genotypes were collected and analyzed.
Statistics
Statistical significance was evaluated using Mixed Effects Regression (MRE) analysis to address multiple observations from individual animals, Student’s T-test, Mann-Whitney rank sum test, or Fisher’s exact test, as indicated. P < 0.05 was considered significant.
Results
Scn2b deletion results in decreased INa density in ventricular myocytes
We measured whole-cell INa in acutely isolated ventricular and atrial myocytes. Null ventricular myocytes showed a reduction in total INa density over a voltage range of −50 mV to −20 mV (Fig. 1A) and steeper slope (κ) of the activation curve compared to WT, indicating increased sensitivity to changes in voltage (Fig. 1B). There were no differences in the voltage-dependence of activation or inactivation, kinetics of recovery from inactivation, persistent INa density, or kinetics of steady state inactivation between genotypes (Table 1). In contrast to ventricular myocytes, null atrial myocytes showed no changes in INa or persistent INa density, voltage-dependence of activation, or inactivation between genotypes, suggesting that the role of β2 in heart is region specific (Fig. 1C–D, Table 2). qRT-PCR (Fig. 1E) and western blotting (Fig. 1F) showed no differences in Scn5a mRNA or Nav1.5 protein in the ventricle, respectively, between genotypes, suggesting that changes in INa density in null ventricle are due to defective VGSC targeting to the plasma membrane, similar to that observed in neurons8, 9.
Figure 1.
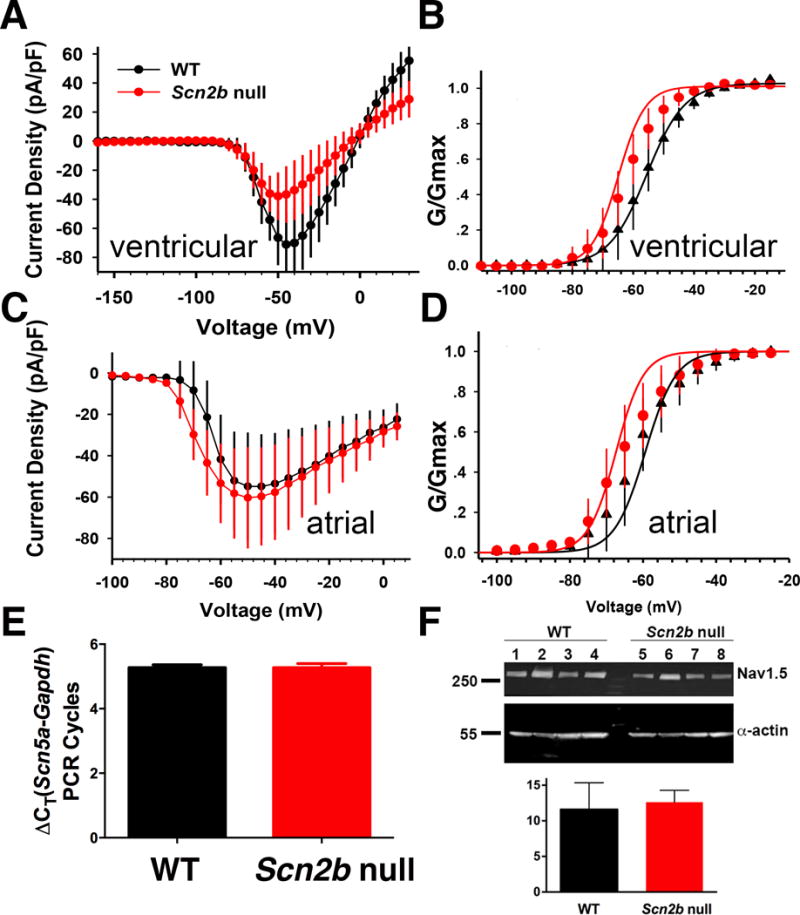
INa in ventricular and atrial cardiomyocytes. A. Null ventricular myocytes have decreased INa density over a voltage range from −50 mV to −20 mV (*P<0.05, null: n=12, N=6; WT: n=9, N=6, MRE analysis,) with no differences in cell capacitance between genotypes (Scn2b null vs WT: 115.9±13.3, n=9, N=6, vs 85.85±11.8, n=12, N=6; P=0.136, MRE analysis). B. Scn2b deletion had no effect on the voltage-dependence of activation (p=0.065, null: n=12 N=6; WT: n=9, N=6, MRE analysis) but decreased the slope factor κ (p=0.005, null: n=12, N=6; WT: n=9 N=6, Mixed Effect Regression analysis,). C. No change in atrial INa density between genotypes (P=0.07 to 0.92 over a voltage range from −100mV to 5mV, null: n=15, N=3; WT: n=12, N=3, MRE analysis). D. Scn2b deletion had no effect on the voltage-dependence of activation (P=0.15) or slope factor κ (P=0.56) (null: n=15, N=3; WT: n=12, N=3, MRE analysis). E. qRT-PCR shows no difference in levels of Scn5a transcript between null and WT ventricle relative to GAPDH controls (null: N=6, WT: N=6, P=0.98, Student’s T-test). F. Western blotting shows no difference in Nav1.5 protein levels between null and WT ventricle (upper panel). α-actin was used as a loading control for quantification (lower panel). (WT: N=4; Null: N=4, P=0.63, Student’s T-test). n: number of cells tested. N: number of animals tested.
Table 1.
Ventricular INa Biophysical Properties
| WT | Scn2b null | P-value | |
|---|---|---|---|
|
| |||
| N=6 | N=6 | ||
| Voltage dependence of activation | |||
| V1/2(mV) | −55.9 (−60.66,−51.12) | −61.9 (−66.26,−57.53) | P=0.065 |
| κ | 6.2 (5.4,7) | 4.5 (3.8,5.2) | P=0.005 |
| n | 9 | 12 | |
| Voltage dependence of inactivation | |||
| V1/2(mV) | −91.2 (−96.25,−86.2) | −92.4 (−96.7,−88) | P=0.712 |
| κ | −6 (−643,−5.58) | −6.1 (−6.5,−5.76) | P=0.632 |
| C | 0.03 (0.008,0.058) | 0.02 (0.01,0.042) | P=0.390 |
| n | 9 | 12 | |
| Kinetics of inactivation | |||
| τslow (ms) | 5.2 (3.32,7.13) | 4.42 (2.54,6.3) | P=0.516 |
| n | 9 | 9 | |
| τfast (ms) | 1.96 (1.39,2.53) | 1.59 (1.07,2.11) | P=0.317 |
| n | 9 | 12 | |
| Steady-state persistent current | |||
| % of peak current | 3.9 (2.8,4.9) | 2.7 (1.7,3.7) | P=0.100 |
| n | 9 | 11 | |
| Kinetics of recovery | |||
| τ (ms) | 10.4 (7.33,13.4) | 8.6 (5.84,11.3) | P=0.344 |
| n | 8 | 10 | |
Data are expressed as mean (95% CI). Kinetics of inactivation were recorded at a test potential of −45 mV. Persistent INa was recorded at a test potential −45 mV, 50–52 ms after the voltage step.
Significance determined by MRE analysis with P < 0.05. n: number of cells tested. N: number of animals tested.
Table 2.
Atrial INa Biophysical Properties
| WT N=3 |
Scn2b null N=3 |
P-value | |
|---|---|---|---|
| Peak INa density (pA/pF) | −54.8 (−80.1,−29.6) | −59.7 (−83.4,−36) | 0.78 |
| mV of Peak INa | −46.7 ± 2.2 | −50.7 ± 2.3 | 0.23 |
| Persistent INa density at −45 mV (pA/pF) | −2.14 (−3.11,−1.2) | −1.88 (−2.7,−1) | 0.67 |
| n | 12 | 15 | |
| Voltage-dependence of activation | |||
| V1/2 (mV) | −59.4 (−64,−54.8) | −64.7 (−68.8,−60.5) | 0.15 |
| κ | 4.19 (3.37,5) | 3.8 (3.11,4.6) | 0.56 |
| n | 12 | 15 | |
| Voltage-dependence of inactivation | |||
| V1/2 (mV) | −91.8 (−97.3,−86.3) | −93.9 (−99.2,−88.7) | 0.59 |
| κ | −6.9 (−7.6,−6.2) | −7.4 (−8.1,−6.7) | 0.39 |
| n | 12 | 15 | |
Data are expressed as mean (95%CI). Kinetics of inactivation were recorded at a test potential of −45 mV. Persistent INa density was recorded at a test potential −45 mV, 50–52 ms after the voltage step.
Significance determined with MRE analysis or Student T-test (for mV of peak INa) with P < 0.05. n: number of cells tested. N: number of animals tested.
VGSCs are differentially localized to subcellular domains in cardiac myocytes7, 14. We performed super-resolution scanning patch clamp recordings of INa at the t-tubules and cell crests of ventricular myocytes15 to investigate changes in the subcellular distribution of VGSCs in response to Scn2b deletion. No differences were apparent between genotypes (Fig. S1), suggesting that, in agreement with immunofluorescence data14, INa in Scn2b null myocytes may be most affected at the intercalated discs. Alternatively, it is possible that channel openings at both sites may be less frequent events in the null myocytes.
Scn2b null hearts have impaired impulse propagation in the right ventricular outflow tract region
We performed optical mapping of ex vivo Langendorff perfused hearts to investigate the effects of Scn2b deletion on cardiac conduction (Fig. 2). Slowed conduction was observed in the null right ventricular outflow tract (RVOT), but not the RV, region compared to WT (Fig. 2A–C). To examine excitability changes in this region more closely, we performed current clamp recordings of APs in RVOT myocytes. AP amplitude, maximal upstroke velocity, and resting membrane potential were not statistically different between genotypes (Fig. S2A–C; WT: N = 8, n = 10–14; Scn2b null: N=5, n=11–16). APDs at early phases (APD30–APD50) were unchanged between genotypes (Fig. S2D–F). In contrast, late phase APDs (APD70–APD90) showed significant prolongation in null myocytes at different pacing frequencies (Fig. 3A–C). Consistent with prolongation of late phase APD, we observed a significantly higher incidence of early afterdepolarizations (EADs) in null myocytes (9 of 21 cells) compared to WT (1 of 15 cells) (Fig. 3C,D, P=0.024).
Figure 2.
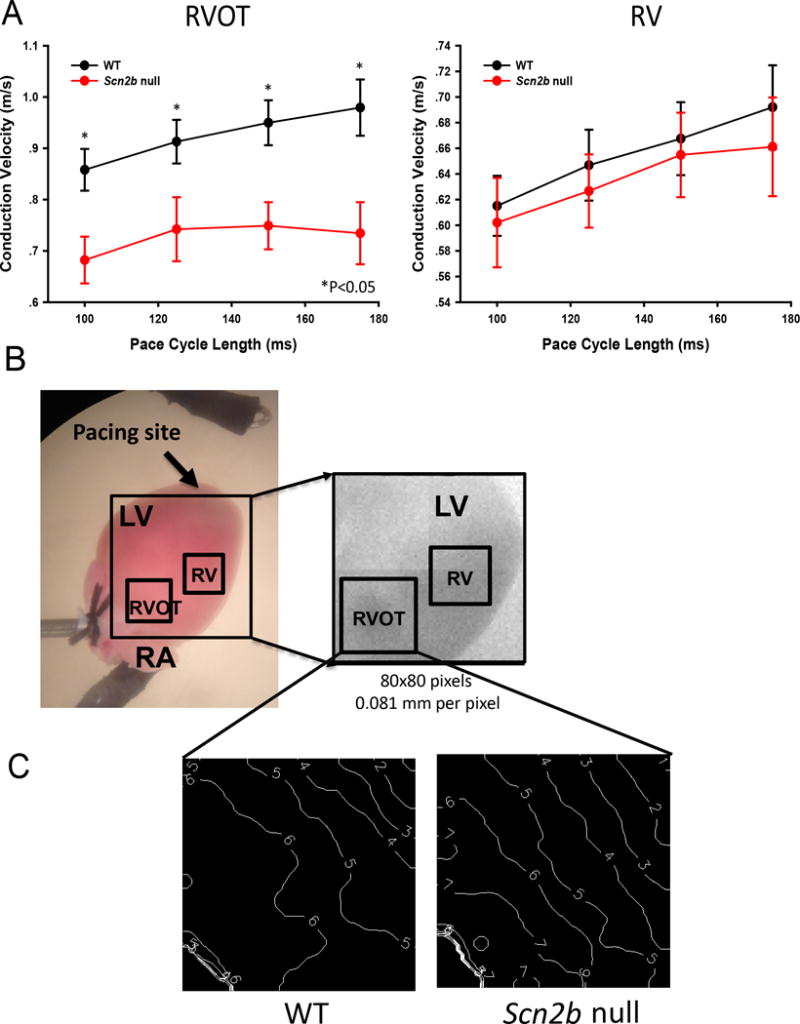
Conduction velocity is decreased in the null RVOT. A. Conduction velocity is decreased in the RVOT but not RV free wall (null: N=9; WT: N=11) paced at cycle lengths (CL) of 100ms P=0.011; CL=125ms, P=0.032; CL=150ms *P=0.015; CL=175ms P=0.012; Student’s T-test or Mann-Whitney Rank Sum Test where applicable. B. Langendorff heart prep during optical mapping. Box: region of measurement. C. Representative activation maps from null and WT at 150 ms CL. White lines: isochrone lines. Numbers indicate time in ms. Isochrone lines show conduction slowing in the null RVOT. N: number of animals tested.
Figure 3.
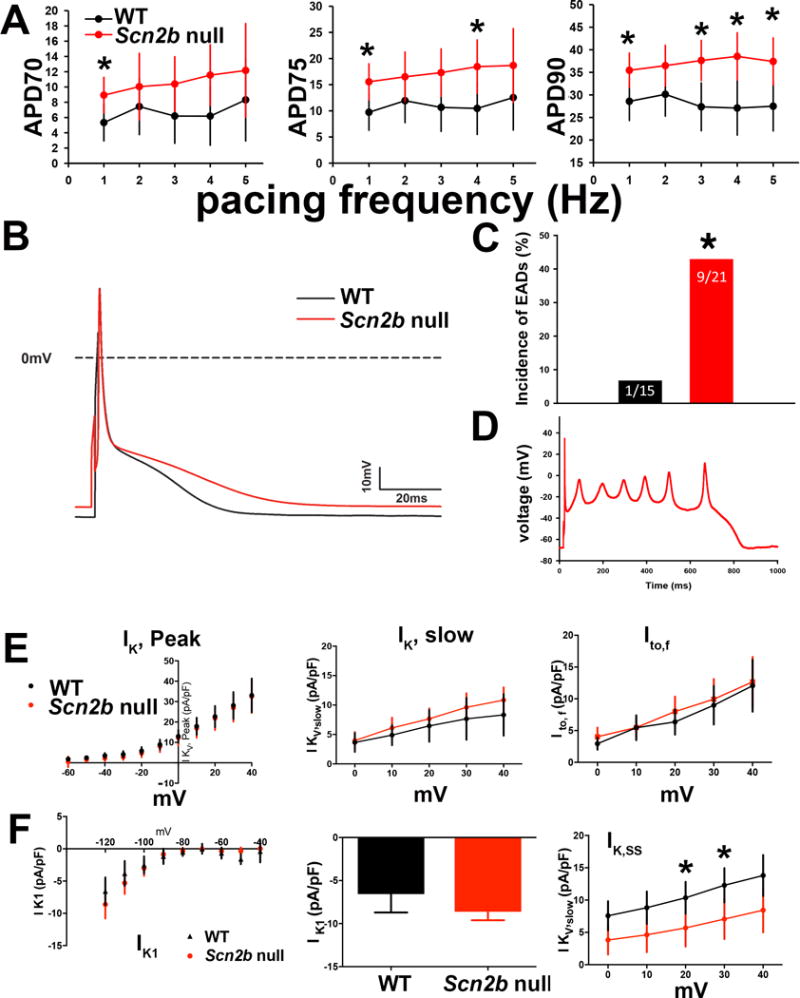
AP and IK in single RVOT myocytes. A. Late phase APD values (APD70–90) were prolonged in nulls (WT: n=10–14, N=8; Null: n=12–16, N=5; *P=0.01–0.04, as indicated, MRE analysis). WT: black. Null: red. B. Representative AP traces. WT: black. Null: red. The final phase of the null AP is prolonged compared to WT. C. Null myocytes exhibited a higher incidence of early afterdepolarizations (EADs) than WT (P=0.024, Fisher’s exact test). D. Representative null EAD trace paced at 4Hz. E. Null myocytes have reduced IK, SS density. Upper panels: I-V curves for IK, peak, IK, slow, Ito, and IK, SS measured in RVOT myocytes Lower panels: Peak current at +40 mV for IK, peak (WT: 33.35 (24.46,42.24) pA/pF, n=13, N=5; null: 32.43 (22.98,41.88) pA/pF, n=10, N=6; P=0.88), IK, slow at +40 mV (WT: 7.96 (4.15,11.77), n=13, N=5; null: 10.81 (6.98,14.64) pA/pF, n=10, N=6; P=0.28), Ito at +40 mV (WT: 12.18 (8,16.36), n=13, N=5; null: 12.35 (7.8,16.9) pA/pF, n=10, N=6; P=0.95), and IK,ss at +20 mV (WT: 10.60 (7.47,13.73), n=13, N=5; null: 5.70 (2.50,8.91) pA/pF, n=10, N=6; P=0.04), at +30 mV (WT: 12.54 (8.91,16.17), n=13, N=5; null: 7.02 (3.41,10.64) pA/pF, n=10, N=6; P=0.04), and at +40 mV (WT: 14.13 (9.77,18.49), n=13, N=5; null: 8.32 (4.02,12.62) pA/pF, n=10, N=6; P=0.07) WT: black. Null: red. F. Scn2b null myocytes have normal IK1 density. Upper panel: No differences in inward rectifying current (IK1) between null (red) and WT (black) RVOT myocytes. Lower panel: Bar graph of IK1 at −120 mV (WT: −6.47(−9.35,−3.58), n=11, N=5; null: −8.24(−10.89,−5.59) pA/pF, n=12, N=6; P=0.35). Results in E and F are reported as mean (95% confidence interval), with significance determined using MRE analysis.
Scn2b deletion results in impaired steady-state K+ current in ventricular myocytes
We recorded IK density from RVOT myocytes to ask whether alterations in repolarizing currents may underlie prolongation of late phase APD in the nulls (Fig. 3E,F). We observed no differences in IK, peak density between genotypes (Fig. 3E). The decay phase of the current was fit with a bi-exponential function to assess the contributions of slowly inactivating IK (IK,slow) and transient outward current (Ito)16. There were no differences between genotypes for IK,slow or Ito density (Fig. 3E). There were no differences between genotypes in the time constants of inactivation for IK,slow (1404 ± 183 vs. 1289 ± 84 msec; P=0.61, not shown) or Ito (93.6 ± 29.1 vs. 75.06 ± 13.6 msec; P=0.61, not shown) for WT and null, respectively. In contrast, non-inactivating steady-state IK, IK,ss, density was decreased 40% in null myocytes at 20 mV and 30 mV (Fig. 3E). We observed no differences in the inward rectifying current, IK1, density between genotypes (Fig. 3F). Prolonged late phase APD is in agreement with the finding of decreased IK,SS, which determines IK amplitude at times late after the onset of depolarization17.
Scn2b null ventricles are arrhythmogenic
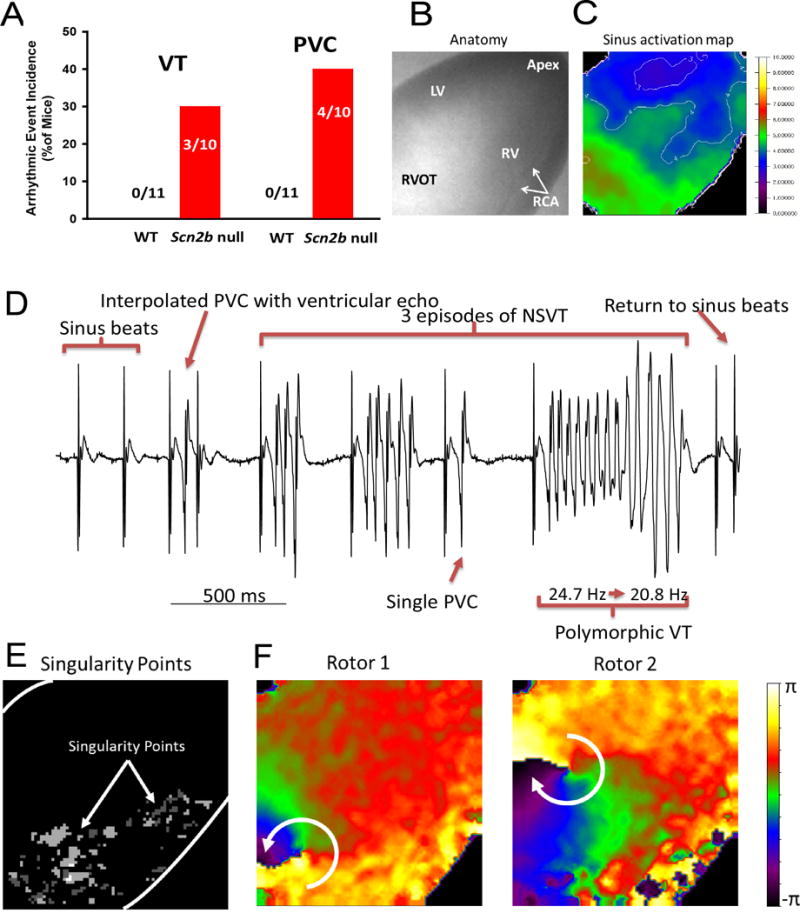
To assess the susceptibility of null ventricles to arrhythmia, we performed optical mapping with simultaneous, volume-conducted ECGs in isolated hearts (Fig. 4). Episodes of spontaneous, non-sustained ventricular tachycardia (NSVT) were observed in 3 of 10 null hearts and premature ventricular complexes (PVCs) were observed in 4 of 10 null hearts, but none in the 11 WT hearts tested (Fig. 4A). Fig. 4 B and C show anatomical views of the heart during the optical mapping and epicardial activation during a sinus beat, respectively. As expected12, during the sinus beat, two breakthroughs appeared on the LV and RV free wall close to the apex and the excitation wave front then propagated toward the base of the heart. All spontaneous aberrant rhythm events appeared with a PVC within an average of 25–26 min following cannulation and before pacing or administration of drugs (Fig. 4D). Episodes of spontaneous NSVT were recorded and phase maps were generated to analyze activation patterns during tachycardia (Fig. 4D–F). Rotors were observed (Movie S1), implicating functional re-entry as the underlying mechanism of arrhythmia in null hearts. Singularity points, the organizing centers of each rotor, were concentrated in the null RVOT (Fig. 4E), suggesting that wave-breaks were more likely to occur in this area. Rotors were not confined to the RVOT, but observed to meander to the left and right anterior ventricular free walls over time (Fig. 4F), giving rise to the polymorphic appearance of the ECG (Fig. 4D). Closely coupled PVCs served as triggers for NSVT initiation in null hearts. Chronological snapshots taken from a phase movie of a null heart capturing initiation of an episode of spontaneous polymorphic VT illustrate the interplay between a PVC and the arrhythmogenic substrate leading to arrhythmia (Fig. S3). During the sinus beat preceding VT, the epicardium was homogeneously activated from apex to base (Fig. S3A). A PVC then emerged (Fig. S3B,C) as an epicardial breakthrough on the anterior RV free wall near the apex. This premature impulse traveled to the RVOT and was blocked, likely due to prolonged APD and maintenance of refractoriness (Fig. S3C,D). The impulse then detoured to the LV, circumventing the RVOT. When the RVOT was finally activated, due to slowed impulse conduction within this region, the rest of the heart had finished repolarizing and was ready for re-excitation. As a result, the excitation wave-front turned at the RVOT and initiated a rotor (Fig. S3E,F).
Figure 4.
Arrhythmic events captured in Scn2b null hearts by optical mapping.
A. Incidence of PVC and VT in WT (0 of 11) vs. null (4 of 10 and 3 of 10, respectively) (P=0.02 and P=0.09, respectively, Fisher’s Exact Test). B. Anatomical view of the heart during optical mapping. LV: left ventricle, RV: right ventricle, RVOT: right ventricular outflow tract, RCA: right coronary artery. C. Activation map of a sinus beat. Normal epicardial activation during the sinus beat had two breakthroughs on the LV and RV free wall close to the apex and then the excitation wave front propagated towards the base of the heart. White lines: isochrone lines in ms. D. Volume-conducted ECG (bipolar mode, frontal plane) showed 3 episodes of polymorphic NSVT and PVC. Each episode of VT was triggered by a PVC, sharing the same morphology as a single independent PVC, indicating a focal source of the triggering ectopic beat. The polymorphic VT had a frequency transition from 24.7 Hz to 20.8 Hz. E. Singularity point map showing that the location of the rotors (white dots) remained in the RVOT during most of the recording period. F. Phase map snapshots of two rotors during VT. Rotors are dynamic, spin in multiple directions, and meander to other regions, giving rise to the polymorphic appearance of ECG.
Scn2b null mice have a normal cardiac conduction system
We performed intracardiac recordings to measure the conduction time for each segment along the conduction pathway and to assess the electrophysiological properties of the sinoatrial node (SAN) and atrio-ventricular node (AVN). Atrial-His conduction time, His-ventricular conduction time, SAN recovery time, AVN refractoriness, and Wenckebach periodicity were similar between genotypes (Table 3), suggesting that the conduction system is intact in Scn2b null hearts.
Table 3.
Intracardiac Electrophysiological Values
| WT | Scn2b null | P value | |
|---|---|---|---|
| AH Interval (ms) | 27.2±2 | 27.8±2.5 | P=0.87* |
| HV Interval (ms) | 9.5±0.5 | 10.4±0.6 | P=0.31 |
| N=5 | N=7 | ||
| SNRT100 (ms) | 74.9±11.9 | 62.4±11 | P=0.23* |
| SNRT90 (ms) | 106±9.9 | 83.1±14.3 | P=0.22 |
| AVERP100 (ms) | 47.6±2.6 | 48.5±2.3 | P=0.79 |
| N=7 | N=8 | ||
| AVERP80 (ms) | 58.1±2.2 | 58.6±2 | P=0.89 |
| AERP100 (ms) | 26.3±2.4 | 22.3±1.8 | P=0.2 |
| AERP80 (ms) | 19.8±1.1 | 19.4±1 | P=0.78 |
| N=7 | N=7 | ||
| WP (ms) | 72.6±2.1 | 73.3±1.1 | P=0.77 |
| WP2:1 (ms) | 53.7±2.1 | 52.2±1.6 | P=0.59 |
| N=7 | N=8 | ||
| VERP100 (ms) | 45.2±2.5 | 38.7±3 | P=0.13 |
| N=6 | N=6 | ||
| VERP80 (ms) | 42.5±3 | 39.2±3.2 | P=0.48 |
| N=4 | N=5 |
Values are means ± SE; N, number of mice. AH, interval from atrial to His-signal; HV, interval from His to first QRS- movement in surface-ECG; SNRT, sinus-node recovery-time; AVERP, atrial-ventricular effective refractory period; AERP, right atrial effective refractory period; WP Wenckebach-periodicity, WP2:1, Wenckebach-periodicity at 2:1 conduction; VERP, right ventricular effective refractory period. Subscripts indicate S1S1 drive cycle lengths.
Student T-test and Mann-Whitney rank sum test.
Scn2b null mice have increased susceptibility to atrial fibrillation in vivo
Atrial fibrillation (AF) can be reproducibly induced in the mouse heart by a combination of endocardial pacing and administration of the cholinergic agonist, carbachol18–20. We applied burst pacing before and after carbachol administration to test whether null hearts are prone to atrial arrhythmias. The efficacy of carbachol was assessed by the observation of decreased heart rate following drug administration. We defined AF as episodes of 1 s or longer in duration, before or after carbachol administration, during burst pacing or the S1–S2 protocol. Using these criteria, we found that AF susceptibility was higher in null (7 of 9) compared to WT (1 of 7) (P=0.02, Fig. 5A). Durations of induced AF were variable in null mice, ranging from just over 1 s to 11 min (Fig. 5B). In contrast, the majority of AF episodes in WT mice had durations of less than 1 s (not shown). Fig. 5C shows a representative surface ECG lead-II trace and atrial electrogram acquired during AF/AT in a null mouse. This is compared to traces from a WT mouse that was resistant to induction of tachyarrhythmia.
Figure 5.
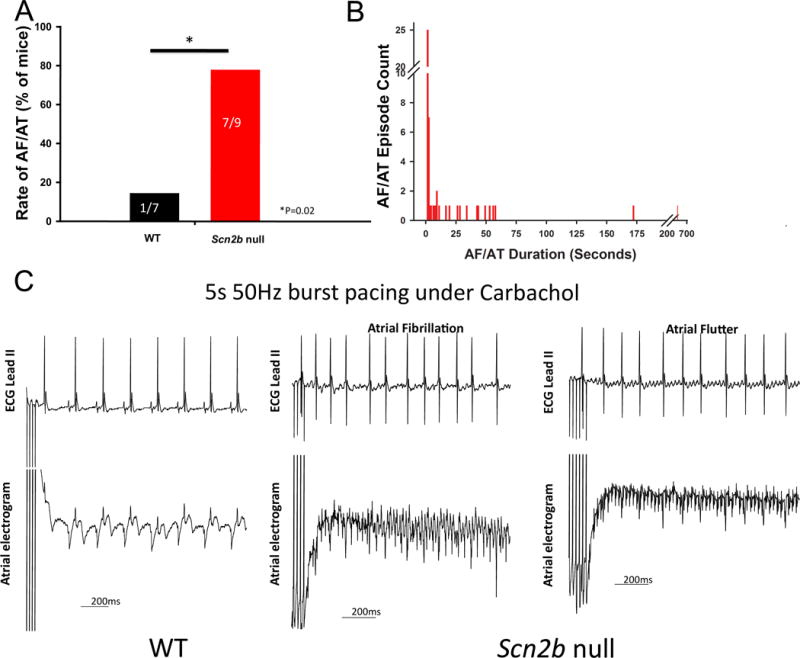
Scn2b null atria are more susceptible to AF. AF was defined as episodes of >1 sec either before or after carbachol administration. Animals that had at least one AF episode that lasted >1 s were considered to be inducible. A. Null mice (7 of 9) were more susceptible to atrial arrhythmia than WT (1 of 7) (P=0.02, Fisher’s exact test, one tailed). B. Distribution of the durations of all AF episodes recorded in nulls. The majority of episodes recorded in WT were <1 s (not shown). C. Representative surface ECG and atrial electrogram from each group. Under 5-s 50 Hz burst pacing with carbachol administration, AF/AT could be induced in nulls but not in WT. During AF, the atrial electrogram was more disorganized. Numbers on the bars indicate number of animals tested.
Re-entry underlies the mechanism of atrial fibrillation in Scn2b null atria
To investigate the mechanism of atrial arrhythmia in null hearts, we performed ex vivo optical mapping (Fig. 6A). Consistent with in vivo observations, we induced AF by burst pacing in 5 of 11 null atria compared to 1 of 10 WT atria in the absence of carbachol (P=0.073). As expected from previous work18–20, carbachol administration increased the level of AF induction in both genotypes (6 of 11 Scn2b null vs. 3 of 10 WT, P=0.39). Phase movies recorded during AF in null atria showed variable forms of rotors, which served as drivers to maintain the arrhythmia. Fig. 6B and Movie S2 demonstrate AF driven by a single rotor in the RA. Fig. 6C and Movies S3 and S4 show AF driven by two rotors in the figure-of-eight conformation (2 counterclockwise rotating rotors that share a common pathway) in the RA in the absence of carbachol and then driven by a single rotor in the pulmonary vein (PV) region of the LA after carbachol administration. Fig. 6D and Movie S5 show AF driven by three independent rotors at different dominant frequencies (17.7 Hz and 26.5 Hz, respectively). One rotor was located in the RA, while the other two, with figure-of-eight configuration at the higher common frequency, were located in the PV region. In this case, the AF terminated and then was spontaneously re-initiated by a sinus beat due to wavebreak in the RA. This re-initiated AF was sustained by a single rotor in the RA (Fig. 6D). Spontaneous AF was also observed in one null atrium but not in any of the WT atria, suggesting higher atrial arrhythmogenicity in the mutant animals (Fig. S4). Taken together, the dynamic, complex, and non-hierarchical organization of rotors in Scn2b null atria suggest that the substrates for AF/AT may be functionally and anatomically heterogeneous.
Figure 6.
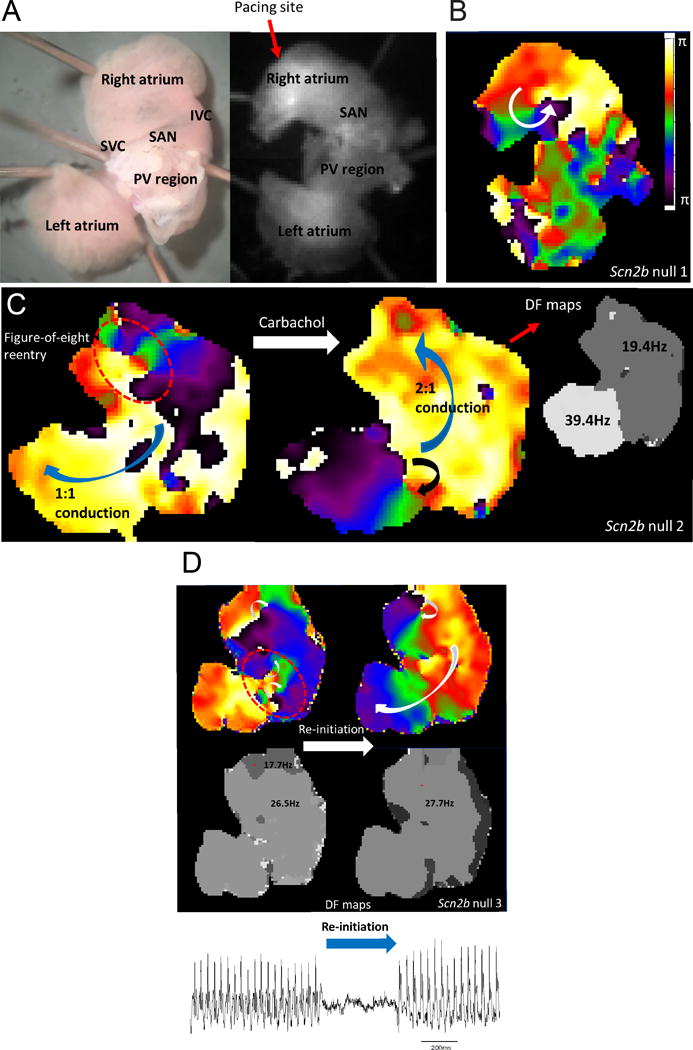
Complex and dynamic rotors underlie the mechanism of AF in Scn2b null atria. A. Anatomical view from posterior of the atrial preparation under microscope (left) and camera (right). SVC: superior vena cava, SAN: sino-atrial node, IVC: inferior vena cava, PV: pulmonary veins. Pacing was at the edge of the RA appendage. B. Pacing-induced AF was driven by a single rotor in the RA. C. Induced AF was driven by two counter-rotating rotors (figure-of-eight re-entry) with 1:1 conduction to the left side. After carbachol perfusion, AF was driven by a single rotor located in the LA PV region with 2:1 conduction to the right side, resulting in twice the dominant frequency in left compared to the right. D. AF was driven by three different rotors spinning at 17.7 Hz and 26.5 Hz in RA and LA, respectively (upper left and lower left rotors, respectively). After its termination, the AF was spontaneously re-initiated by the wavebreak occurring in the RA (upper right and lower right). The resultant single rotor then drove the entire episode at 27.7 Hz in the RA with 1:1 conduction to the left. A volume conducted bipolar atrium electrogram showed two corresponding episodes of AF (bottom atrial ECG trace).
APD is heterogeneously prolonged in Scn2b null atrium
In contrast to the RVOT, we observed no changes in atrial conduction velocity between genotypes (Fig. S5). AP recordings from single RA myocytes showed no differences in amplitude, maximum upstroke velocity, or resting membrane potential between groups (Fig. 7A). We observed a significant increase in the later phases of the APD (APD50–90) in null myocytes compared to WT at the highest pacing frequency tested (Fig. 7B). Fig. 7C shows representative, superimposed AP wave-forms from each genotype to illustrate the AP prolongation in null atrial myocytes compared to WT. In Fig. 7D we plot the range of APD values for atrial myocytes of each genotype to illustrate the degree of heterogeneity in the null atrial data set. For comparison, Fig. S6 shows the range of APD values for ventricular myocytes of each genotype. We propose that this dispersion of repolarization in atrial myocytes generates functionally heterogeneous substrates in the null atrium that predispose the tissue to wave-break during fast pacing.
Figure 7.
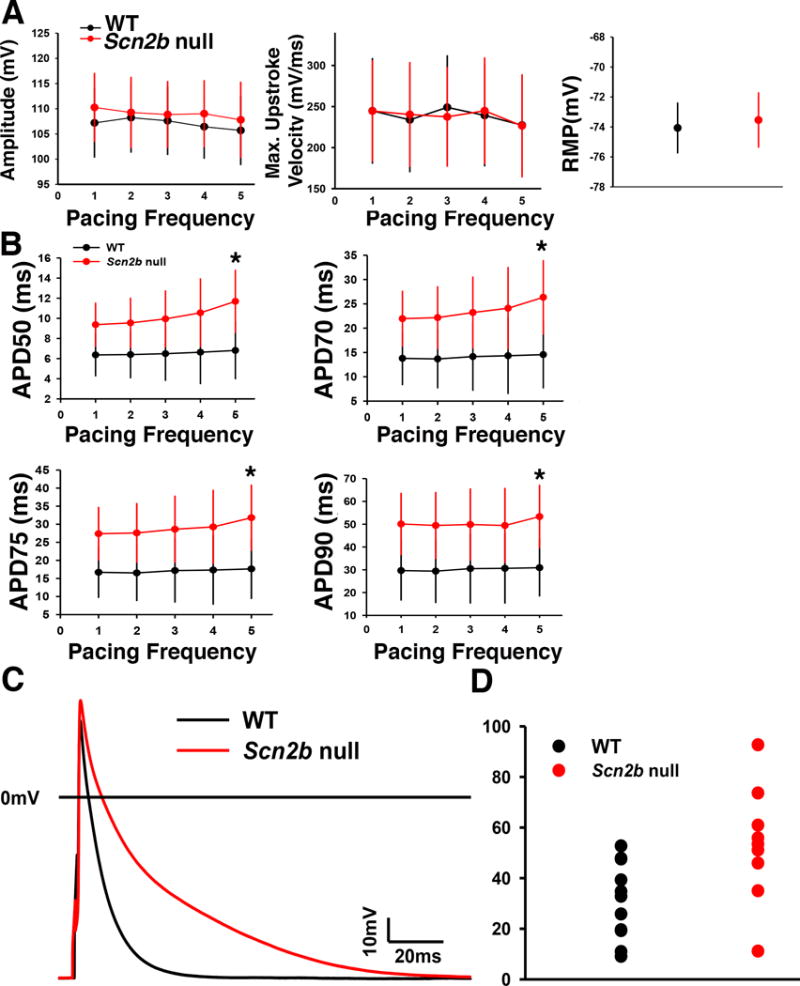
AP recordings from right atrial myocytes. A. No differences between genotypes in AP amplitude, AP maximum upstroke velocity, or resting membrane potential. WT: black. Null: red. B. APD50–90 was prolonged in the nulls at a pacing frequency of 5 Hz (*P<0.05, MRE analysis,). C. Representative superimposed AP traces from null and WT myocytes. D. Distribution of the APD90 data paced at 5 Hz from atrial myocytes. APD lengthening in atrial myocytes is heterogeneous, resulting in a dispersed distribution of the data set (Null: n=13, N=4; WT: n=12, N=5, Student’s T test). WT: black. Null: red. Blue: mean. n: number of cells tested. N: number of animals tested.
Increased fibrosis in Scn2b null right atrium
Evidence connects cardiac VGSC dysfunction to fibrosis21–23. To assess the presence of fibrosis in the null model, the posterior walls of the RA and left atria (LA) were sectioned in the coronary plane parallel to the posterior wall and stained using Masson’s trichrome protocol. We observed increased levels of fibrosis in the null RA, but not the LA, compared to WT (Fig. 8A,B). We propose that fibrotic tissue deposited in the null RA interstitial space creates anatomical substrates for wave-breaks as well as anchor points for rotors, and may explain transitions from AF to atrial flutter in the null animals (e.g. Fig. 8C).
Figure 8.
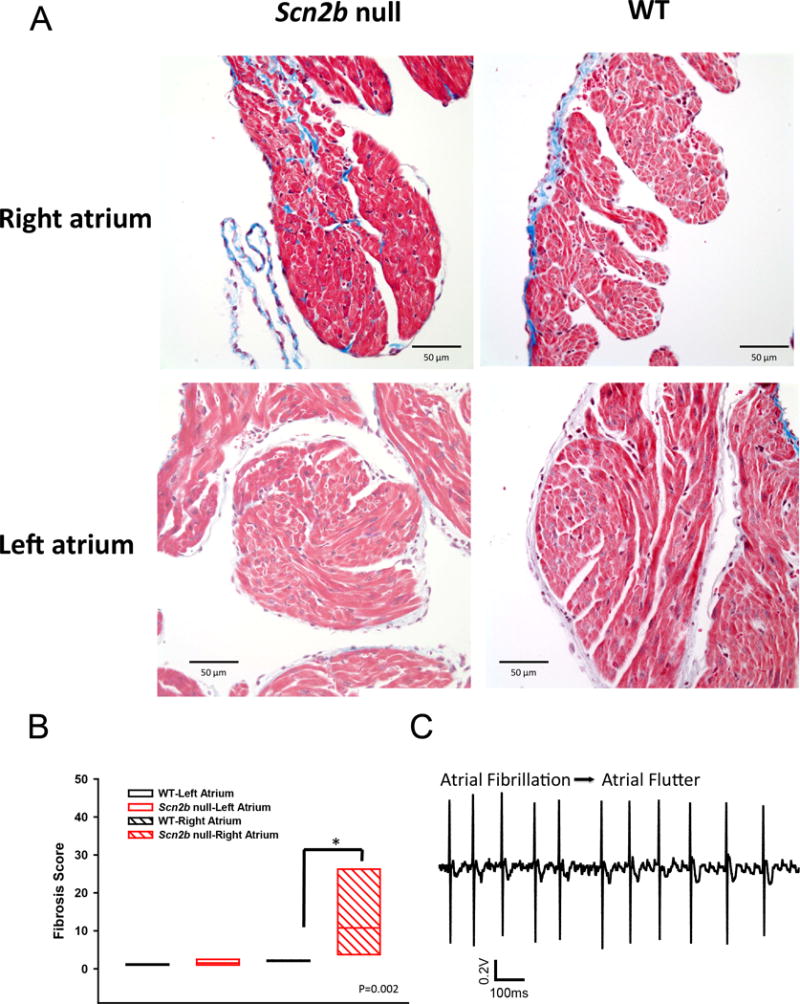
Increased fibrosis in Scn2b null right atrium. A. Masson’s trichrome staining shows increased fibrosis (blue) in null RA but not LA compared to WT. B. Quantification of fibrosis (P=0.002, Mann-Whitney Rank Sum Test). N=6 per genotype. C. Transition of atrial fibrillation to atrial flutter in null atrium. Increased levels of fibrosis are proposed to provide anchoring points for rotors underlying the transition.
Discussion
This study presents the first investigation of the effects of Scn2b deletion on cardiac electrophysiology in mice. Loss of VGSC β2 results in reduction of INa density due to impaired channel cell surface expression over a defined voltage range and reduction of IK, SS density in ventricular myocytes, with subsequent slowing of conduction in the RVOT. Slowed conduction and prolonged repolarization in the RVOT interact with PVCs to initiate functional re-entry, increasing the susceptibility of null hearts to ventricular arrhythmia. In contrast to the ventricle, atrial INa density and biophysical properties were not different between genotypes, demonstrating region-specific functionality of β2 in the heart. Finally, null mice are more susceptible to AF/AT and have increased atrial fibrosis compared to WT. We propose that increased functional and anatomical heterogeneity in the atrium due to repolarization dispersion and fibrosis contribute to the mechanism of atrial arrhythmia in Scn2b null hearts.
Scn2b null mice may mimic some aspects of Brugada syndrome
BrS is a rare cardiac disease that results in increased risk of ventricular fibrillation and sudden cardiac death24. Approximately 35% of BrS cases are attributable to known pathogenic gene variants, with ~30% of these resulting from loss of INa25. The RVOT is the most affected region in human heart in BrS26. Similarly, Scn2b null mice have reduced INa density throughout the ventricle with decreased impulse propagation in the RVOT. While the mechanism for selective propagation slowing in the RVOT here and in human BrS is not completely understood, previous work has shown that Scn5a mRNA and Nav1.5 protein levels are reduced in the WT mouse RVOT compared to the rest of the RV27. This normally occurring lowered conduction reserve is proposed to result in greater conduction slowing in the RVOT under conditions of reduced cardiac INa, e.g. administration of VGSC blocking agents or the presence of loss-of-function VGSC gene mutations, increasing the susceptibility for arrhythmias. We propose that reductions in functional VGSC expression in Scn2b null ventricle result in larger decrements in conduction reserve in the RVOT compared to the remainder of the RV. In addition to aberrant depolarization, prolongation of repolarization is observed in the RVOT of BrS patients26, 28, 29. We observed reduced IK, SS density and prolongation of the APD90 in Scn2b null RVOT myocytes, results that are functionally consistent with clinical findings.
PVCs and arrhythmogenesis in Scn2b null hearts
PVCs are proposed to serve as triggers for arrhythmogenesis. Trigger elimination, by focal ablation of PVCs originating from the RVOT30, is effective in preventing arrhythmic events in patients. The timing of emergence and spatial orientation of the excitation wave fronts of ectopic beats are key factors in arrhythmia initiation. In Scn5a+/− mice, PVCs play important roles in initiating re-entrant, spontaneous polymorphic VT31. In Scn2b null hearts, every recorded VT episode occurred following a PVC, suggesting a requirement for PVCs to serve as triggers. In addition, epicardial breakthrough of the initiating PVC was observed at the RV free wall near the apex rather than at the RVOT. We found no differences in the coupling interval between VT-initiating PVCs and PVCs that did not trigger VT (Fig. S7). Because the morphologies of these PVC types were similar, we propose that the origins of the PVCs were focal. Thus, the subsequent occurrence of VT was dependent on the repolarizing state of the preceding sinus beat, in which case the repolarization or refractoriness was dynamic.
SCN2B and Atrial Fibrillation
AF is the most prevalent clinical arrhythmia32, with even higher incidence in BrS compared to the general population28, 29, 33–35 . Both loss- and gain-of-function mutations in SCN5A have been linked to familial AF36. The two reported AF patients with SCN2B mutations exhibited saddleback type ST segment elevation in the right precordial leads, suggesting that these individuals may have also experienced BrS-like symptoms6. Here, Scn2b deletion resulted in effects on atrial AP repolarization and tissue remodeling, but not atrial INa. The APD was increased in a heterogeneous fashion in Scn2b null atrium, resulting in larger repolarization dispersion. In addition, higher levels of fibrosis were found preferentially in Scn2b null RA. These changes are proposed to provide electrical and anatomical substrates that favor AF. The notion of increased heterogeneity of Scn2b null atrium is supported by our finding that the number, frequency, location, and organization of rotors are highly dynamic and complex.
Increased fibrosis in Scn2b null atrium is consistent with reported links between VGSC dysfunction and fibrosis in the heart. For example, TGF-β1-mediated fibrosis is triggered by Scn5a disruption21. In other studies, relaxin suppressed AF in aged rats37 and in spontaneously hypertensive rats38 through decreased atrial fibrosis, increased INa, and increased atrial conduction velocity. As an alternative hypothesis, fibrosis in null mice may be triggered directly by the absence of β2 polypeptides during atrial development. β2 subunits are substrates for sequential cleavage by BACE-1 and γ-secretase39. The cleaved intracellular domain of β2, at least in neurons, translocates to the nucleus to participate in transcriptional regulation of VGSC α subunits and possibly other genes39. Thus, the cleaved β2 intracellular domain may normally regulate genes that inhibit fibrosis in the atrium, resulting in uncontrolled fibrosis in Scn2b null hearts.
In summary, Scn2b null mice may be useful for modeling aspects of human ventricular arrhythmias that exhibit increased susceptibility to atrial arrhythmia. This study provides insight into the role of VGSC β2 subunits in maintaining normal cardiac electrical activity and provides a novel perspective on the connection between ventricular and atrial arrhythmias in patients who carry VGSC gene mutations.
Supplementary Material
WHAT IS KNOWN
Voltage-gated sodium channel β2 subunits are cell adhesion molecules expressed in both brain and heart. In neurons, β2 subunits are known to function to chaperone sodium channel pore-forming α subunits to the plasma membrane. In addition, generation of C-terminal β2 fragments by sequential cleavage of β2 subunits by BACE1 and γ-secretase has been shown to regulate sodium channel α subunit gene transcription in neurons.
Mutations in the gene encoding sodium channel β2 subunits, SCN2B, are associated with atrial fibrillation and Brugada syndrome in human patients. However, the function of β2 in heart has not been studied.
WHAT THE STUDY ADDS
Scn2b deletion results in changes in reduced sodium current density and, unexpectedly, reduced potassium current density in ventricular myocytes, with subsequent slowing of conduction in the right ventricular outflow tract (RVOT) region.
Slowed conduction and prolonged repolarization in the RVOT interact with premature ventricular complexes (PVCs) to initiate functional re-entry, increasing the susceptibility of Scn2b null hearts to ventricular arrhythmia.
In contrast to the ventricle, atrial sodium current density and biophysical properties are not different between genotypes, demonstrating region-specific functionality of β2 in the heart.
Scn2b null mice are more susceptible to atrial fibrillation and have increased atrial fibrosis compared to wildtype. Increased functional and anatomical heterogeneity in the atrium due to repolarization dispersion and fibrosis may contribute to the mechanism of atrial arrhythmia in Scn2b null hearts.
Acknowledgments
Sources of Funding: Funded by NIH NS064245 (to LLI), HL122352 (to JJ), HL055438 (to HHV), HL124319 (JA), T32HL007853 and UL1TR000433 (CRF trainee), and the China Scholarship Council (YB trainee).
Footnotes
Disclosures: None
References
- 1.Catterall WA. Voltage-gated sodium channels at 60: Structure, function and pathophysiology. J Physiol. 2012;590:2577–2589. doi: 10.1113/jphysiol.2011.224204. [DOI] [PMC free article] [PubMed] [Google Scholar]
- 2.O’Malley HA, Isom LL. Sodium channel beta subunits: Emerging targets in channelopathies. Annu Rev Physiol. 2015;77:481–504. doi: 10.1146/annurev-physiol-021014-071846. [DOI] [PMC free article] [PubMed] [Google Scholar]
- 3.Brackenbury WJ, Isom LL. Na channel beta subunits: Overachievers of the ion channel family. Front Pharmacol. 2011;2:53. doi: 10.3389/fphar.2011.00053. [DOI] [PMC free article] [PubMed] [Google Scholar]
- 4.Bao Y, Isom LL. Nav1.5 and regulatory β subunits in cardiac sodium channelopathies. Card Electrophysiol Clin. 2014;6:679–694. [Google Scholar]
- 5.Riuro H, Beltran-Alvarez P, Tarradas A, Selga E, Campuzano O, Verges M, Pagans S, Iglesias A, Brugada J, Brugada P, Vazquez FM, Perez GJ, Scornik FS, Brugada R. A missense mutation in the sodium channel beta2 subunit reveals scn2b as a new candidate gene for brugada syndrome. Hum Mutat. 2013;34:961–966. doi: 10.1002/humu.22328. [DOI] [PubMed] [Google Scholar]
- 6.Watanabe H, Darbar D, Kaiser DW, Jiramongkolchai K, Chopra S, Donahue BS, Kannankeril PJ, Roden DM. Mutations in sodium channel β1- and β2-subunits associated with atrial fibrillation. Circ Arrhythm Electrophysiol. 2009;2:268–275. doi: 10.1161/CIRCEP.108.779181. [DOI] [PMC free article] [PubMed] [Google Scholar]
- 7.Malhotra J, Chen C, Rivolta I, Abriel H, Malhotra R, Mattei LN, Brosius FC, Kass RS, Isom LL. Characterization of sodium channel alpha- and beta-subunits in rat and mouse cardiac myocytes. Circulation. 2001;103:1303–1310. doi: 10.1161/01.cir.103.9.1303. [DOI] [PubMed] [Google Scholar]
- 8.Chen C, Bharucha V, Chen Y, Westenbroek RE, Brown A, Malhotra JD, Jones D, Avery C, Gillespie PJ, 3rd, Kazen-Gillespie KA, Kazarinova-Noyes K, Shrager P, Saunders TL, Macdonald RL, Ransom BR, Scheuer T, Catterall WA, Isom LL. Reduced sodium channel density, altered voltage dependence of inactivation, and increased susceptibility to seizures in mice lacking sodium channel beta 2-subunits. Proc Natl Acad Sci U S A. 2002;99:17072–17077. doi: 10.1073/pnas.212638099. [DOI] [PMC free article] [PubMed] [Google Scholar]
- 9.Lopez-Santiago LF, Pertin M, Morisod X, Chen C, Hong S, Wiley J, Decosterd I, Isom LL. Sodium channel beta2 subunits regulate tetrodotoxin-sensitive sodium channels in small dorsal root ganglion neurons and modulate the response to pain. J Neurosci. 2006;26:7984–7994. doi: 10.1523/JNEUROSCI.2211-06.2006. [DOI] [PMC free article] [PubMed] [Google Scholar]
- 10.Auerbach DS, Jones J, Clawson BC, Offord J, Lenk GM, Ogiwara I, Yamakawa K, Meisler MH, Parent JM, Isom LL. Altered cardiac electrophysiology and sudep in a model of dravet syndrome. PLoS One. 2013;8:e77843. doi: 10.1371/journal.pone.0077843. [DOI] [PMC free article] [PubMed] [Google Scholar]
- 11.Signore S, Sorrentino A, Borghetti G, Cannata A, Meo M, Zhou Y, Kannappan R, Pasqualini F, O’Malley H, Sundman M, Tsigkas N, Zhang E, Arranto C, Mangiaracina C, Isobe K, Sena BF, Kim J, Goichberg P, Nahrendorf M, Isom LL, Leri A, Anversa P, Rota M. Late Na(+) current and protracted electrical recovery are critical determinants of the aging myopathy. Nat Commun. 2015;6:8803. doi: 10.1038/ncomms9803. [DOI] [PMC free article] [PubMed] [Google Scholar]
- 12.Cerrone M, Noujaim SF, Tolkacheva EG, Talkachou A, O’Connell R, Berenfeld O, Anumonwo J, Pandit SV, Vikstrom K, Napolitano C, Priori SG, Jalife J. Arrhythmogenic mechanisms in a mouse model of catecholaminergic polymorphic ventricular tachycardia. Circ Res. 2007;101:1039–1048. doi: 10.1161/CIRCRESAHA.107.148064. [DOI] [PMC free article] [PubMed] [Google Scholar]
- 13.Fedorov VV, Lozinsky IT, Sosunov EA, Anyukhovsky EP, Rosen MR, Balke CW, Efimov IR. Application of blebbistatin as an excitation-contraction uncoupler for electrophysiologic study of rat and rabbit hearts. Heart Rhythm. 2007;4:619–626. doi: 10.1016/j.hrthm.2006.12.047. [DOI] [PubMed] [Google Scholar]
- 14.Maier SK, Westenbroek RE, McCormick KA, Curtis R, Scheuer T, Catterall WA. Distinct subcellular localization of different sodium channel alpha and beta subunits in single ventricular myocytes from mouse heart. Circulation. 2004;109:1421–1427. doi: 10.1161/01.CIR.0000121421.61896.24. [DOI] [PubMed] [Google Scholar]
- 15.Bhargava A, Lin X, Novak P, Mehta K, Korchev Y, Delmar M, Gorelik J. Super-resolution scanning patch clamp reveals clustering of functional ion channels in adult ventricular myocyte. Circ Res. 2013;112:1112–1120. doi: 10.1161/CIRCRESAHA.111.300445. [DOI] [PMC free article] [PubMed] [Google Scholar]
- 16.Marionneau C, Brunet S, Flagg TP, Pilgram TK, Demolombe S, Nerbonne JM. Distinct cellular and molecular mechanisms underlie functional remodeling of repolarizing k+ currents with left ventricular hypertrophy. Circ Res. 2008;102:1406–1415. doi: 10.1161/CIRCRESAHA.107.170050. [DOI] [PMC free article] [PubMed] [Google Scholar]
- 17.Xu H, Guo W, Nerbonne JM. Four kinetically distinct depolarization-activated k+ currents in adult mouse ventricular myocytes. J Gen Physiol. 1999;113:661–678. doi: 10.1085/jgp.113.5.661. [DOI] [PMC free article] [PubMed] [Google Scholar]
- 18.Kovoor P, Wickman K, Maguire CT, Pu W, Gehrmann J, Berul CI, Clapham DE. Evaluation of the role of i(kach) in atrial fibrillation using a mouse knockout model. J Am Coll Cardiol. 2001;37:2136–2143. doi: 10.1016/s0735-1097(01)01304-3. [DOI] [PubMed] [Google Scholar]
- 19.Wakimoto H, Maguire CT, Kovoor P, Hammer PE, Gehrmann J, Triedman JK, Berul CI. Induction of atrial tachycardia and fibrillation in the mouse heart. Cardiovasc Res. 2001;50:463–473. doi: 10.1016/s0008-6363(01)00264-4. [DOI] [PubMed] [Google Scholar]
- 20.Tuomi JM, Chidiac P, Jones DL. Evidence for enhanced m3 muscarinic receptor function and sensitivity to atrial arrhythmia in the rgs2-deficient mouse. Am J Physiol Heart Circ Physiol. 2010;298:H554–561. doi: 10.1152/ajpheart.00779.2009. [DOI] [PubMed] [Google Scholar]
- 21.Hao X, Zhang Y, Zhang X, Nirmalan M, Davies L, Konstantinou D, Yin F, Dobrzynski H, Wang X, Grace A, Zhang H, Boyett M, Huang CL, Lei M. Tgf-beta1-mediated fibrosis and ion channel remodeling are key mechanisms in producing the sinus node dysfunction associated with scn5a deficiency and aging. Circ Arrhythm Electrophysiol. 2011;4:397–406. doi: 10.1161/CIRCEP.110.960807. [DOI] [PubMed] [Google Scholar]
- 22.van Veen TA, Stein M, Royer A, Le Quang K, Charpentier F, Colledge WH, Huang CL, Wilders R, Grace AA, Escande D, de Bakker JM, van Rijen HV. Impaired impulse propagation in scn5a-knockout mice: Combined contribution of excitability, connexin expression, and tissue architecture in relation to aging. Circulation. 2005;112:1927–1935. doi: 10.1161/CIRCULATIONAHA.105.539072. [DOI] [PubMed] [Google Scholar]
- 23.Royer A, van Veen TA, Le Bouter S, Marionneau C, Griol-Charhbili V, Leoni AL, Steenman M, van Rijen HV, Demolombe S, Goddard CA, Richer C, Escoubet B, Jarry-Guichard T, Colledge WH, Gros D, de Bakker JM, Grace AA, Escande D, Charpentier F. Mouse model of scn5a-linked hereditary lenegre’s disease: Age-related conduction slowing and myocardial fibrosis. Circulation. 2005;111:1738–1746. doi: 10.1161/01.CIR.0000160853.19867.61. [DOI] [PubMed] [Google Scholar]
- 24.Antzelevitch C, Brugada P, Borggrefe M, Brugada J, Brugada R, Corrado D, Gussak I, LeMarec H, Nademanee K, Perez Riera AR, Shimizu W, Schulze-Bahr E, Tan H, Wilde A. Brugada syndrome: Report of the second consensus conference: Endorsed by the heart rhythm society and the european heart rhythm association. Circulation. 2005;111:659–670. doi: 10.1161/01.CIR.0000152479.54298.51. [DOI] [PubMed] [Google Scholar]
- 25.Sarquella-Brugada G, Campuzano O, Arbelo E, Brugada J, Brugada R. Brugada syndrome: Clinical and genetic findings. Genet Med. 2016;18:3–12. doi: 10.1038/gim.2015.35. [DOI] [PubMed] [Google Scholar]
- 26.Meregalli PG, Wilde AA, Tan HL. Pathophysiological mechanisms of brugada syndrome: Depolarization disorder, repolarization disorder, or more? Cardiovasc Res. 2005;67:367–378. doi: 10.1016/j.cardiores.2005.03.005. [DOI] [PubMed] [Google Scholar]
- 27.Boukens BJ, Sylva M, de Gier-de Vries C, Remme CA, Bezzina CR, Christoffels VM, Coronel R. Reduced sodium channel function unmasks residual embryonic slow conduction in the adult right ventricular outflow tract. Circ Res. 2013;113:137–141. doi: 10.1161/CIRCRESAHA.113.301565. [DOI] [PubMed] [Google Scholar]
- 28.Bigi MA, Aslani A, Shahrzad S. Clinical predictors of atrial fibrillation in brugada syndrome. Europace. 2007;9:947–950. doi: 10.1093/europace/eum110. [DOI] [PubMed] [Google Scholar]
- 29.Morita H, Kusano-Fukushima K, Nagase S, Fujimoto Y, Hisamatsu K, Fujio H, Haraoka K, Kobayashi M, Morita ST, Nakamura K, Emori T, Matsubara H, Hina K, Kita T, Fukatani M, Ohe T. Atrial fibrillation and atrial vulnerability in patients with brugada syndrome. J Am Coll Cardiol. 2002;40:1437–1444. doi: 10.1016/s0735-1097(02)02167-8. [DOI] [PubMed] [Google Scholar]
- 30.Haissaguerre M, Extramiana F, Hocini M, Cauchemez B, Jais P, Cabrera JA, Farre J, Leenhardt A, Sanders P, Scavee C, Hsu LF, Weerasooriya R, Shah DC, Frank R, Maury P, Delay M, Garrigue S, Clementy J. Mapping and ablation of ventricular fibrillation associated with long-qt and brugada syndromes. Circulation. 2003;108:925–928. doi: 10.1161/01.CIR.0000088781.99943.95. [DOI] [PubMed] [Google Scholar]
- 31.Martin CA, Guzadhur L, Grace AA, Lei M, Huang CL. Mapping of reentrant spontaneous polymorphic ventricular tachycardia in a scn5a+/− mouse model. Am J Physiol Heart Circ Physiol. 2011;300:H1853–1862. doi: 10.1152/ajpheart.00034.2011. [DOI] [PMC free article] [PubMed] [Google Scholar]
- 32.Andrade J, Khairy P, Dobrev D, Nattel S. The clinical profile and pathophysiology of atrial fibrillation: Relationships among clinical features, epidemiology, and mechanisms. Circ Res. 2014;114:1453–1468. doi: 10.1161/CIRCRESAHA.114.303211. [DOI] [PubMed] [Google Scholar]
- 33.Rodriguez-Manero M, Namdar M, Sarkozy A, Casado-Arroyo R, Ricciardi D, de Asmundis C, Chierchia GB, Wauters K, Rao JY, Bayrak F, Van Malderen S, Brugada P. Prevalence, clinical characteristics and management of atrial fibrillation in patients with brugada syndrome. Am J Cardiol. 2013;111:362–367. doi: 10.1016/j.amjcard.2012.10.012. [DOI] [PubMed] [Google Scholar]
- 34.Toh N, Morita H, Nagase S, Taniguchi M, Miura D, Nishii N, Nakamura K, Ohe T, Kusano KF, Ito H. Atrial electrophysiological and structural remodeling in high-risk patients with brugada syndrome: Assessment with electrophysiology and echocardiography. Heart Rhythm. 2010;7:218–224. doi: 10.1016/j.hrthm.2009.10.035. [DOI] [PubMed] [Google Scholar]
- 35.Kusano KF, Taniyama M, Nakamura K, Miura D, Banba K, Nagase S, Morita H, Nishii N, Watanabe A, Tada T, Murakami M, Miyaji K, Hiramatsu S, Nakagawa K, Tanaka M, Miura A, Kimura H, Fuke S, Sumita W, Sakuragi S, Urakawa S, Iwasaki J, Ohe T. Atrial fibrillation in patients with brugada syndrome relationships of gene mutation, electrophysiology, and clinical backgrounds. J Am Coll Cardiol. 2008;51:1169–1175. doi: 10.1016/j.jacc.2007.10.060. [DOI] [PubMed] [Google Scholar]
- 36.Savio-Galimberti E, Darbar D. Atrial fibrillation and variants. Card Electrophysiol Clin. 2014;6:741–748. doi: 10.1016/j.ccep.2014.07.006. [DOI] [PMC free article] [PubMed] [Google Scholar]
- 37.Henry B, Gabris B, Li Q, Martin B, Giannini M, Parikh A, Patel D, Haney J, Schwartzman D, Shroff SG, Salama G. Relaxin suppresses atrial fibrillation in aged rats by reversing fibrosis and upregulating na-channels. Heart Rhythm. 2016;13:983–991. doi: 10.1016/j.hrthm.2015.12.030. [DOI] [PMC free article] [PubMed] [Google Scholar]
- 38.Parikh A, Patel D, McTiernan CF, Xiang W, Haney J, Yang L, Lin B, Kaplan AD, Bett GC, Rasmusson RL, Shroff SG, Schwartzman D, Salama G. Relaxin suppresses atrial fibrillation by reversing fibrosis and myocyte hypertrophy and increasing conduction velocity and sodium current in spontaneously hypertensive rat hearts. Circ Res. 2013;113:313–321. doi: 10.1161/CIRCRESAHA.113.301646. [DOI] [PMC free article] [PubMed] [Google Scholar]
- 39.Kim DY, Carey BW, Wang H, Ingano LA, Binshtok AM, Wertz MH, Pettingell WH, He P, Lee VM, Woolf CJ, Kovacs DM. Bace1 regulates voltage-gated sodium channels and neuronal activity. Nat Cell Biol. 2007;9:755–764. doi: 10.1038/ncb1602. [DOI] [PMC free article] [PubMed] [Google Scholar]
Associated Data
This section collects any data citations, data availability statements, or supplementary materials included in this article.


