

Abstract
Analyses of somatic hypermutation (SHM) patterns in B-cell immunoglobulin (Ig) sequences have important basic science and clinical applications, but are often confounded by the intrinsic biases of SHM targeting on specific DNA motifs (i.e., hot- and cold-spots). Modeling these biases has been hindered by the difficulty in identifying mutated Ig sequences in vivo in the absence of selection pressures, which skew the observed mutation patterns. To generate a large number of unselected mutations, we immunized B1-8 heavy-chain transgenic mice with nitrophenyl (NP) to stimulate NP-specific λ+ germinal center B cells, and sequenced the unexpressed κ light chains using next-generation methods. Most of these κ sequences had out-of-frame junctions and were presumably uninfluenced by selection. Despite being non-functionally rearranged, they were targeted by SHM and displayed a higher mutation frequency than functional sequences. We used 39,173 mutations to construct a quantitative SHM targeting model. The model showed targeting biases that were consistent with classic hot- and cold-spots, yet revealed additional highly mutable motifs. We observed comparable targeting for functional and non-functional sequences, suggesting similar biological processes operate at both loci. However, we observed species-specific and chain-specific targeting patterns, demonstrating the need for multiple SHM targeting models. Interestingly, the targeting of C/G bases and the frequency of transition mutations at C/G bases was higher in mice compared with humans, suggesting lower levels of DNA repair activity in mice. Our models of SHM targeting provide insights into the SHM process and support future analyses of mutation patterns.
INTRODUCTION
Somatic hypermutation (SHM) is a process that diversifies B cell receptors (BCRs) by introducing point mutations into immunoglobulin (Ig) genes at a high rate (1). SHM is initiated when activation-induced cytidine deaminase (AID) is recruited to the Ig locus and converts cytosines (Cs) to uracils (Us). Error-prone DNA repair pathways are then activated, resulting in somatic mutations either at the AID-targeted C/G base-pair (phase I) or at neighboring base-pairs (phase II) (2). Although stochastic, SHM is biased by the local DNA sequence context and preferentially introduces mutations at specific DNA motifs (hot-spots) while avoiding others (cold-spots) (3–5). SHM plays a crucial role in the B cell immune response and immune-mediated disorders. The analysis of mutation patterns and distributions has been widely used to infer selective processes involved in such responses (6). However, the analysis of SHM patterns can be confounded by the intrinsic biases of SHM targeting, driving the need for accurate characterization of “neutral” SHM targeting that reflects inherent SHM properties in the absence of antigen-driven selection (7, 8).
The SHM process can be quantitatively characterized by a targeting model, consisting of a mutability model, which specifies the relative mutation frequency of DNA micro-sequence motifs, and a substitution model, which describes the specific nucleotide substitution frequencies at the mutated sites (9–13). These models can serve as a background distribution for statistical analysis of mutation patterns in Ig sequences, improving the ability to detect deviations in SHM pathways related to disease or identify selected mutations that drive antigen specificity and affinity maturation (7, 8). However, modeling these intrinsic biases has been limited by the lack of large sets of Ig sequences that have undergone SHM in vivo in the absence of selection pressures. Previous work has focused on studying mutations in intronic regions or in Ig sequences that were determined to be non-functional (e.g., due to an out-of-frame junction) (9–11, 13). However, intronic regions have limited diversity and a different base composition from exonic V(D)J regions, and some mutations in non-functional sequences may be subject to selection pressures if the sequences were rendered non-functional during the affinity maturation process. Another strategy to determine targeting models involves using mutations that do not alter the amino acid sequence (i.e., silent or synonymous mutations), which presumably are not subject to selection pressures. We previously used this strategy to construct the “Silent, 5-mer, Functional (S5F)” SHM targeting model from >800,000 mutations in functional Ig sequences (12). Despite the high resolution of this S5F model, the mutability of some DNA motifs could not be estimated directly because they do not yield silent mutations.
Modeling and analysis of SHM would also benefit from a clear understanding of whether equivalent models can be used across chains (light and heavy) and species (mouse and human). Light and heavy chain genes are located on different chromosomes, thus different regulatory elements and epigenetic effects may impact micro-sequence targeting specificity (14–17). Previously, Shapiro et al. reported comparable di- and trinucleotide mutabilities between light and heavy chains, and between mouse and human sequences (9). However, the small sequence database and short motif comparisons limited the resolution of this study.
Here, we utilize a novel experimental strategy based on the (4-Hydroxy-3-Nitrophenyl)Acetyl (NP) immunization system in mice, combined with next-generation sequencing (NGS) technologies, to generate a large set of unselected mutations from non-functionally rearranged Ig κ chain sequences. For comparison, we also sequenced light and heavy chains from healthy human subjects. Using a modified version of the 5-mer motif framework previously developed (12), we have used this novel database of mutations spanning the full V gene to develop a next-generation targeting model. We found that targeting patterns on non-functional sequences resemble those on functional sequences, but revealed unexpected chain- and species-specific differences in SHM targeting. These models provide insights into the SHM process and support future analyses of SHM patterns.
MATERIALS AND METHODS
mIgM Tg mouse dataset – cell sorting
Four mIgM Tg JHD−/− BALB/c strain female mice (18), 6-10 week old, were immunized with NP-CGG in alum adjuvant. 28 days after immunization the mice were sacrificed and splenocytes were harvested. Germinal center cells (live, B220+, NIP+, CD95+, CD38−) were FACS-sorted, leaving 64,000, 87,000, 120,000, and 107,000 cells, respectively. As a control, non-germinal center B cells expressing κ light chain with a B220+, CD95−, CD38+, λ− phenotype were FACS-sorted from two non-immunized mice, leaving 500,000 and 400,000 cells, respectively. RNA was isolated from sorted cells using the RNeasy Mini kit (Qiagen) per the manufacturer protocol and stored at −80C.
Human dataset – cell sorting
Four healthy donors were recruited for the assessment of B cell antibody repertoire analysis. Specimens were collected after informed written consent was obtained, under a protocol approved by the Human Research Protection Program at Yale School of Medicine. PBMCs were isolated from whole blood by Ficoll-Paque gradient centrifugation. B cells were first enriched with CD20 MicroBeads (Miltenyi Biotec) then memory (CD27+) B cells subsets were isolated through fluorescent activated cell sorting (FACS) on a FACS Aria flow cytometer (BD) into bulk collections prior to RNA isolation and sequencing. For cytometric analysis and sorting enriched B cells were stained with perCP-Cy5.5 anti-human CD27 (clone O323), Pacific Blue anti-human CD19 (clone HIB 19) (both from BioLegend) and with FITC anti-human IgM (clone G20-127, from BD). The study included both unsorted and memory cell subsets for three subjects, and memory cells only for the other subject.
Sequencing
RNA from sorted memory B cells was extracted via Qiagen RNeasy kit as per manufacturer recommendation. 250ng of RNA input was used for each sample. Immune sequencing library construction for human samples was performed as previously described using human VH and VL primer mix in each reaction (19–21), and for mouse samples was performed using mouse VL-λ and VL-κ primer mix (21). Briefly, RNA was reverse transcribed using biotin-dT oligonucleotide, and barcoded on the 5′ end in a template switch-like reaction using an oligonucleotide harboring a semi-degenerate 17 nucleotide long Unique Identifier barcode (UID) and a universal flanking sequence. The cDNA was purified using streptavidin bead pull down and then subjected to a first round of 12 cycles of PCR. The human samples used a human constant region primer mix composed of IGHC, IGKC and IGLC flanked by another universal sequence (19–21), and the mouse samples used a mouse primer mixed composed of IGKC and IGLC (21). A second round of 12 cycles of PCR was then performed using universal overhang from both ends to add the required Illumina sequencing and clustering adapters. The samples were then pooled at equimolar ratio and subjected to sequencing on the Illumina MiSeq platform at 325bp x 275bp. 1,000,000 raw sequences (including both κ and λ chains) were generated per mouse and were deposited in the SRA database (project ID: PRJNA283640 http://www.ncbi.nlm.nih.gov/sra). 1,409,212, 1,826,378, 2,565,481, and 1,492,802 raw sequences were generated for each of the four human subjects (SRA project ID: PRJNA338795, runs: HD07_U_A8ALE, HD09_U_A8ALE, HD09_M_A7VDM, HD10_U_A8ALE, HD10_M_A7VDM, HD13_U_A8ALE, HD13_M_A7VDM).
Sequencing data pre-processing
Raw sequences were processed using the Repertoire Sequencing Toolkit (pRESTO) (22) as previously described (12). The script containing the detailed procedures is in Supplementary File 1. In summary, we removed low quality sequences, annotated sequences by UID (corresponding to the same mRNA molecule) and isotype-specific primer, generated a consensus sequence for each UID, and assembled pair-end reads. To obtain high-fidelity sequences, the reads being used for mutation analysis were constrained to appear at least twice. Furthermore, a sliding window approach was used to eliminate sequences with 6 or more mutations in 10 consecutive nucleotides. IMGT was used to assign germline V(D)J segments and determine functionality (23). Mutations were defined as nucleotides that were different from the inferred germline sequence. Clustering of sequences into clonal groups was carried out using the Change-O command line tool (24). Heavy chain sequences were assigned into clonal groups on the basis of identical V gene, J gene and junction length, with a weighted intraclonal distance threshold of 10 using the substitution probabilities previously described (25). Light chain sequences were assigned into clonal groups on the basis of identical V gene, J gene and junction sequence.
Estimation of the sequencing error rate after quality control
The empirical sequencing error rate for each sequence was computed by comparing the number of mismatched nucleotides with the consensus sequence in each UID group. The UID consensus sequence was obtained by majority rule at each nucleotide base in each UID group. The error rate of UID sequences was estimated by subtracting the probability that each base is correct (defined by more than half of the sequences at each position being correct) from one. The actual error is expected to be lower as sequencing may result in distinct errors, in which case less than half correct bases at a position would result in the correct UID consensus.
Mutability calculation for RS models
The construction of S (silent) 5-mer models was previously described (12). The RS (replacement and silent) model was constructed using the same method except that both silent and replacement mutations were included.
Inference for substitution and mutability frequencies
The shm R package (version 0.1.1) in the Change-O software suite was used to compute the targeting models (12, 24). For substitution models, the values of 5-mers with less than 20 mutations were inferred. Inference was performed by first averaging substitution frequencies of all mutations in 5-mers matching the same inner 3-mers. If the number of mutations was still insufficient (less than 20), substitution frequencies of all mutations in 5-mers matching the same middle base were averaged. In the mutability models, 5-mers with less than 500 mutations in sequences containing the mutated 5-mer were inferred. If the mutated base was A or T, inference was done by averaging the mutability of all 5-mers sharing the same inner 3-mer. For the base C, inference was based on 5-mers sharing the same upstream 3-mer (the mutated base and 2 nucleotides upstream of it), whereas for the base G, inference was based on 5-mers sharing the same downstream 3-mer (the mutated base and 2 nucleotides downstream of it).
Construction of sequencing-error models
Sequencing-error models were constructed for the purposes of comparing with targeting models. Combined PCR and MiSeq sequencing error (hereafter referred to as sequencing error) profiles were generated using sequences from large UID groups (more than 20 sequences) in mice. A consensus sequence was constructed per group through majority rule at each nucleotide position. Within each UID group, the deviations from consensus sequences were counted as sequencing errors and used to construct the error models. Targeting models for these errors were built the same way as the 5-mer RS targeting model, except that all sequences were treated independently (instead of collapsing mutations for each clone). 5-mer motifs with less than 20 mutations in the center base or 500 mutations in any base in sequences containing the mutated motif were excluded. Samples that did not have any 5-mers matching the criteria were excluded from the study.
Principal component analysis on targeting models
For each pair of samples, the distance was defined as one minus the Spearman correlation coefficient between any two targeting models, considering only the motifs observed in both models. The R function prcomp was used to project the distance matrix onto the first two principal components.
Mutation simulation
Ten simulated repertoires were generated for each SHM model (mouse light chain, human light chain and human heavy chain). For each repertoire, 2,000 sequences were simulated with 5 mutations per sequence, roughly the same mutation levels as observed in the germinal center cells from mice analyzed here. The mutations were added to the sequences stochastically using a mutation algorithm previously described (8). All the simulations were initiated with the germline Musmus IGKV1-135*01, the most abundant V segment among non-functional chains in the NP-immunized mice. The simulation results were compared across different SHM targeting models by calculating the number of different mutations (defined as mutations at different positions or mutations to different bases) between repertoires divided by the total number of mutations.
RESULTS
Non-functional rearrangements of the κ light chain accumulate somatic hypermutations
To generate a large number of unselected mutations necessary to precisely model SHM targeting, we carried out next-generation repertoire sequencing (Rep-Seq) (26) in NP-immunized mIgM Tg mice (18). These mice express a transgenic heavy chain (B1-8) that binds the NP antigen when paired with λ, but not κ, light chains. We reasoned that NP-binding B cells in these mice would likely carry non-functionally rearranged κ chains, since λ chains are generally utilized only after failure to generate a productive κ chain rearrangement during B cell development (27). Next-generation sequencing of κ light chains of sorted germinal center (GC) NP-binding B cells from four mice 28 days post-immunization with NP produced 25,341 distinct κ light chain sequences (Table 1). Consistent with our expectations, 20,194 sequences (80%) were identified as non-functional because they contained an out-of-frame junction (92%) or a stop codon in the junction (8%) (Figure S1). The small fraction of in-frame κ light chain sequences may be derived from B cells reacting to the NP carrier protein (CGG) that contaminated the sort, or may represent cells carrying both a productive κ and λ chain (28, 29).
Table 1.
Mouse sequencing data
| # Unique Sequences | # Clones | # Mutations | ||||||||
|---|---|---|---|---|---|---|---|---|---|---|
|
| ||||||||||
| Sample | Chain | Processed | Functional | Total | Functional | Non- functional * |
Functional | Non- functional * |
Functional Silent |
Non- functional Silent * |
| NP1 | IGK | 2,526 | 534 | 1,163 | 232 | 942 | 739 | 4,225 | 183 | 1,081 |
| IGL | 25,755 | 21,332 | 1,298 | 516 | 794 | 2,728 | 3,691 | 718 | 703 | |
| NP2 | IGK | 8,703 | 1,555 | 2,671 | 464 | 2,233 | 1,546 | 12,489 | 370 | 3,347 |
| IGL | 84,141 | 70,990 | 2,552 | 930 | 1,653 | 4,923 | 7,874 | 1,440 | 1,566 | |
| NP3 | IGK | 10,006 | 2,226 | 3,245 | 656 | 2,626 | 2,305 | 14,992 | 565 | 3,758 |
| IGL | 89,976 | 76,406 | 2,720 | 1,045 | 1,711 | 5,528 | 8,508 | 1,590 | 1,767 | |
| NP4 | IGK | 4,106 | 832 | 1,813 | 373 | 1,459 | 1,095 | 7,467 | 252 | 1,964 |
| IGL | 50,587 | 42,523 | 1,923 | 658 | 1,281 | 3,639 | 6,214 | 1,017 | 1,230 | |
| Total | IGK | 25,341 | 5,147 | 8,892 | 1,725 | 7,260 | 5,685 | 39,173 | 1,370 | 10,150 |
| IGL | 250,459 | 211,251 | 8,493 | 3,149 | 5,439 | 16,818 | 26,287 | 4,765 | 5,266 | |
|
| ||||||||||
| C1 | IGK | 89,707 | 76,245 | 15,688 | 9,905 | 5,989 | 18,984 | 7,843 | 3,871 | 879 |
| IGL | 3,844 | 590 | 798 | 138 | 662 | 202 | 1,293 | 32 | 178 | |
| C2 | IGK | 26,041 | 22,814 | 5,797 | 3,853 | 2,026 | 6,900 | 2,539 | 1,331 | 266 |
| IGL | 1,240 | 183 | 305 | 44 | 262 | 62 | 493 | 9 | 65 | |
| Total | IGK | 115,748 | 99,059 | 21,485 | 13,758 | 8,015 | 25,884 | 10,382 | 5,202 | 1,145 |
| IGL | 5,084 | 773 | 1,103 | 182 | 924 | 264 | 1786 | 41 | 243 | |
The number of non-functional sequences is the number of processed sequences minus the number of functional sequences
Previous data suggested that the non-functional κ sequences would accumulate somatic hypermutations since they were derived from GC B cells, where the SHM machinery is active, and where Ig is clearly being transcribed (as the sequencing was carried out from an mRNA template) (9, 13, 30). To determine the extent of SHM, IMGT/High-VQUEST was used to identify and align the germline V and J gene segments for each of the observed sequences. We found that the non-functional κ light chain sequences in NP-binding GC B cells had an average mutation frequency of 1.49% in the V region. Interestingly, the non-functional κ sequences were consistently more mutated than functional κ sequences, which had mutation frequency of 0.95% (p < 1e-15) (Figure 1). The decreased mutation frequency observed in functional sequences was not due to the use of V segments with fewer hot-spot motifs, as a similar pattern was observed when comparing mutation frequencies in functional and non-functional sequences using the same V segment. The λ light chains sequenced from the same B cell subsets had a similar mutation frequency as the functional κ chain sequences. In contrast, κ chain sequences from non-GC cells sorted from two unimmunized mice were significantly less mutated than κ chain sequences from GC cells (p < 1e-15). The mutation frequencies in all of these populations were higher than the estimated sequencing error rate after correction using the molecular barcodes (estimated sequencing error rate < 1e-9). To identify independent SHM events, we partitioned the sequences into groups that were likely to be clonally-related (see Materials and Methods), and identified the set of distinct mutations from each clone. In total, we obtained 39,173 independent and unselected mutations from NP-binding non-functional κ chain sequences.
Figure 1. Non-functional sequences accumulate a high frequency of somatic mutations.
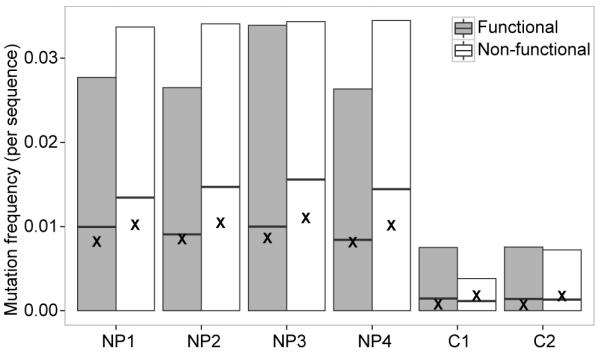
κ light chains were sequenced from four NP-immunized (NP1-4) or two control mice (C1-2) (Table 1). The mutation frequency of the V segment in functional (filled boxes) and non-functional (open boxes) sequences was calculated by comparing each sequence to its germline segment determined by IMGT/HighV-Quest. The boxes indicate the mean mutation frequency and 5% to 95% quantiles. Mean mutation frequencies for comparable λ light chains are indicated by X.
SHM targeting at the non-functional locus resembles the functional locus
Similar to previous models (12), we defined the mutability of a DNA motif as the probability of the central base in the motif being targeted by SHM relative to all other motifs (described in Materials and Methods). To capture the classic SHM hot-spots (WRC/GYW and WA/TW, where W = [A, T], R = [G, A], Y = [C, T]) (2) on both the forward and reverse strands, we modeled targeting patterns based on 5-mer motifs. Furthermore, we used both replacement (R) and silent (S) mutations since neither type of mutation should be subject to selection pressures in non-functional κ chain sequences in λ+ cells. Using the notation developed in our previous work, we refer to this model as “RS5NF” (replacement and silent, 5-mer, non-functional) (Figure 2). The RS5NF targeting model contained 825 directly observed motifs (Figure 2A) and 199 unobserved motifs, whose values were inferred from similar motifs (Figure 2B). We built a separate targeting model using data from each mouse and confirmed that the mutabilities were highly similar among them (Figure S2A). As expected, classic hot-spots generally had higher mutabilities, while classic cold-spots had lower mutabilities. Furthermore, we observed potential new strand-symmetric hot-spot motifs, CRCY/RGYG (colored in orange) and ATCT/AGAT (colored in magenta), whose mean mutability levels were more than twice as large as the mean mutability level of the classic WA/TW hot-spot. These SHM targeting patterns remained stable over the course of B cell maturation, as models constructed from sequences with <1% mutation frequency were well correlated with those constructed from sequences with ≥1% mutation frequency; the strength of correlations (average pair-wise Pearson correlation of 0.61) was comparable with pair-wise correlations for sequences with <1% mutation frequency (average Pearson correlation of 0.58).
Figure 2. SHM targeting model for murine light chains.

An RS5NF model was constructed to estimate the mutability of 5-mer motifs using both replacement and silent mutations in non-functional κ sequences from NP-binding cells in four immunized mice (NP1-4 in Table 1). Hedgehog plots depict the relative targeting of 5-mer motifs centered on the bases A, T, C and G, with each center base in an individual circle. (A) The mutability values measured directly from Ig sequencing data. (B) The complete SHM targeting model with inferred values for 5-mer motifs that could not be directly estimated. Classic hot-spots are colored in red (WRC/GYW) and green (WA/TW), while cold-spots are colored in blue (SYC/GRS). Potential novel hot-spots are colored in orange (CRCY/RGYG, R=[G,A], Y=[C,T]) and magenta (ATCT/AGAT).
To test whether SHM targeting at the non-functional locus was similar to the functional locus, we compared targeting models constructed from functional and non-functional sequences. Since selection pressures may influence mutation patterns in functional sequences, we constructed a model based only on silent mutations. For this comparison, the model for non-functional sequences was also based on silent mutations to ensure comparability. Specifically, we built an S5NF (silent, 5-mer, non-functional) model using silent mutations from non-functional κ sequences from GC cells in immunized mice, and an S5F (silent, 5-mer, functional) model using silent mutations from functional κ sequences from both GC B cells in immunized mice and non-GC B cells in control mice. The mutability models for non-functional (S5NF) and functional (S5F) sequences were highly correlated (Pearson rho = 0.86 and Spearman rho = 0.58 over 250 common 5-mer motifs) consistent with the notion that the same mutational pathways are operating at both loci in this murine system (Figure 3A).
Figure 3. SHM targeting is conserved at the non-functional locus.

Functional or non-functional sequences were analyzed separately to estimate the mutability of each 5-mer (points) using data from (A) mouse κ light chains from six mice (NP1-4 and C1-2 in Table 1) (or four NP-immunized mice only for non-functional chains), (B) human light chains from four subjects (HD samples in Table 2), or (C) human heavy chains from four subjects (HD samples in Table 2). Classic hot- and cold-spots are colored as specified in Figure 2. The mutabilities were normalized such that the average mutability of the motifs observed in both loci was 1.
To test whether SHM targeting was also consistent across functional and non-functional loci in humans, we recruited four healthy human subjects and sequenced both their Ig heavy and light chains. Overall, we collected 32,260 unique heavy chain sequences and 111,625 unique light chain sequences (Table 2). Comparison of S5F targeting models constructed independently for each subject showed that targeting patterns were highly conserved across individuals (Figure S2B and Figure S2C), consistent with previous observations (12). We thus agglomerated mutations from all individuals to build light chain S5F and S5NF targeting models, using functional and non-functional (defined by out of frame junctions) sequences, respectively. The relative mutability of DNA motifs in the non-functional and functional sequences were highly correlated (Pearson rho = 0.93; Spearman rho = 0.88) (Figure 3B). Similar results were obtained for the human heavy chain sequences (Pearson rho = 0.93, Spearman rho = 0.86) (Figure 3C). Overall, these results suggest the SHM targeting mechanism is highly conserved at the functional and non-functional loci in both the human and mouse systems.
Table 2.
Human sequencing data
| # Unique Sequences | # Clones | # Mutations | |||||||||
|---|---|---|---|---|---|---|---|---|---|---|---|
|
| |||||||||||
| Sample | Chain | Processed | Functional | Non- functional * |
Total | Functional | Non- functional* |
Functional | Non- functional* |
Functional Silent |
Non- functional Silent * |
| HD07 | Heavy | 5,697 | 5,570 | 58 | 2,870 | 2,789 | 57 | 24,032 | 616 | 8,650 | 189 |
| Light | 21,011 | 20,362 | 454 | 6,455 | 5,944 | 418 | 41,135 | 2,077 | 14,280 | 479 | |
| HD09 | Heavy | 8,628 | 8,362 | 199 | 6,426 | 6,182 | 190 | 48,479 | 1,632 | 16,831 | 469 |
| Light | 36,596 | 34,846 | 1,514 | 16,319 | 14,909 | 1,266 | 113,235 | 7,909 | 40,399 | 1,837 | |
| HD10 | Heavy | 8,742 | 8,462 | 233 | 7,333 | 7,064 | 217 | 49,327 | 1,627 | 16,908 | 354 |
| Light | 26,089 | 24,553 | 1,338 | 14,611 | 13,322 | 1,144 | 89,687 | 6,243 | 31,415 | 1,299 | |
| HD13 | Heavy | 9,193 | 8,900 | 218 | 5,903 | 5,647 | 200 | 56,551 | 2,157 | 20,200 | 552 |
| Light | 27,929 | 26,505 | 1,191 | 12,508 | 11,490 | 901 | 87,735 | 6,532 | 31,694 | 1,484 | |
|
| |||||||||||
| Total | Heavy | 32,260 | 32,294 | 708 | 22,532 | 21,682 | 664 | 178,389 | 6,032 | 62,589 | 1,564 |
| Light | 111,625 | 106,266 | 4,497 | 49,893 | 45,665 | 3,729 | 331,792 | 22,761 | 117,788 | 5,099 | |
Non-functional sequences are defined as sequences with out-of-frame junctions
C/G bases are targeted more frequently and exhibit a higher transition frequency in mice
To understand whether SHM targeting was species-specific, we compared the mouse and human light chain mutability models. Overall, there was a high correlation between the mouse S5NF model and the human S5F model (Pearson rho = 0.63, Spearman rho = 0.63) (Figure 4A). In both species, classic hot-spots generally exhibited higher mutabilities, while classic cold-spots exhibited lower mutabilities. Despite this similarity, we observed a global shift in mutabilities at certain bases. In the mouse model, 5-mer motifs with C or G (hereafter written as C/G) as the central base had much higher mutabilities compared with the same motifs in the human model across the 299 motifs observed in both models, while 5-mer motifs centered at A or T (hereafter written as A/T) had much lower mutabilities (Figure 4B). When considering the mutability of motifs centered on each base separately, the mutabilities were highly consistent (Figure S3), suggesting that the difference between mouse and human SHM targeting exists mainly in the overall targeting frequencies of C/G verses A/T bases. The models adjust for differences in CG contents between mice and humans by normalizing mutabilities using frequencies of micro-sequence motifs in the germline sequences. To ensure that the observed species-specific difference were not due to tissue-specific differences (mouse B cells were collected from the spleen, while human B cells were from PBMCs), we examined an independent dataset derived from lymph node B cells from four multiple sclerosis subjects (31). The largest mutability difference between species (i.e., mouse vs. human) was five times greater than the largest difference between tissues (i.e., blood vs. lymph node) in the same species (data not shown), suggesting that the large increase observed in C/G targeting in mice compared to humans was likely due to a species-dependent mechanistic difference in SHM.
Figure 4. The mutability of C/G (relative to A/T) is increased in mice compared with humans.

SHM targeting models were estimated using silent mutations from non-functional mouse κ light chains in four NP-immunized mice (NP1-4 in Table 1) or functional human light chains from four subjects (HD samples in Table 2). (A) The mutability of each 5-mer (points) was compared between the mouse and human models. (B) The distribution of mutabilities for all 5-mer motifs centered at each base (A, T, G and C) was compared between the mouse (filled boxes) and human (open boxes) models. The mutabilities were normalized such that the average mutability of the motifs observed in both species was 1.
The increase in C/G (verses A/T) targeting in the mouse model suggested a relative decrease in the recruitment of the MSH2/MSH6 DNA mismatch repair pathway that drives mutation spreading from the original AID-induced lesion, thus leading to a shift in the balance towards phase I (versus phase II) SHM. To test whether there was also a decreased efficiency of recruiting UNG, the base excision repair enzyme associated with phase Ib of SHM, we analyzed the pattern of nucleotide substitution frequencies computed for each base by aggregating all mutations at positions where only silent mutations were possible (Table 3). We reasoned that decreased recruitment of UNG would lead to an increase in AID-induced lesions being resolved through simple replication events, and consequently an increase in the frequency of transition mutations (vs. transversion mutations) at C/G bases. Consistent with this hypothesis, and with previously reported transition frequencies in mice (4, 32, 33) and humans (30), the transition frequencies from C-to-T and G-to-A in mice were significantly higher than those in humans (Table 3) (p < 1e-15, Pearson’s Chi-squared test). This species-specific difference in transition frequency was only found at C/G bases, while the substitution profiles at A/T bases were similar between mice and humans. This is consistent with a shift in the balance towards phase Ia compared to phase Ib SHM in mice. Overall, these observations suggest a general decrease in the efficiency of recruiting DNA error-prone repair pathways normally associated with SHM to the sites of AID-induced lesions in mice compared with humans.
Table 3.
SHM Substitution Matrices
| Mouse Light Chain | Human Light Chain | Human Heavy Chain | ||||||||||
|---|---|---|---|---|---|---|---|---|---|---|---|---|
|
|
||||||||||||
| From\To | A | C | G | T | A | C | G | T | A | C | G | T |
| A | - | 0.16 | 0.54 | 0.29 | - | 0.26 | 0.50 | 0.24 | - | 0.28 | 0.49 | 0.23 |
| C | 0.13 | - | 0.09 | 0.78 | 0.25 | - | 0.30 | 0.45 | 0.21 | - | 0.35 | 0.44 |
| G | 0.77 | 0.14 | - | 0.09 | 0.53 | 0.31 | - | 0.16 | 0.49 | 0.35 | - | 0.16 |
| T | 0.25 | 0.57 | 0.18 | - | 0.20 | 0.57 | 0.23 | - | 0.19 | 0.44 | 0.37 | - |
The substitution frequency from each base to every other base is computed using the set of mutations observed at positions where all base changes are silent.
Targeting in human heavy chains is distinct from light chains
Due to different chromosomal contexts, it is possible that the SHM process for heavy and light chains is subject to distinct regulatory machineries. To examine this, we compared the human light chain S5F model with the human heavy chain S5F model previously built. The light chain and the heavy chain models were well correlated (Pearson rho = 0.66, Spearman rho = 0.75) (Figure 5A), and the classic hot- and cold-spots showed the expected deviations from neutral motifs. However, the cross-chain correlations were significantly weaker than the correlations for same-chain comparisons across individuals (p < 1e-15) (Figure 5B). Furthermore, more than 30% of the 5-mer motifs had mutabilities that were more than two-fold different between heavy and light chains (100 of 323 motifs observed in both models), and more than 7% of the motifs were at least four-fold different (25 of 323 motifs), while less than 17% of the motifs were more than two-fold different between the same type of chains (when comparing separate models built for each individual). The targeting model built solely on human κ light chains (instead of combining κ and λ) did not yield higher correlation with the mouse κ chain model, possibly because a smaller database is more prone to noise. Overall, these results indicate that heavy and light chains exhibit similar SHM targeting patterns, but distinct mechanisms are likely acting at each locus, and analysis of heavy and light chain SHM patterns is likely to require separate targeting models.
Figure 5. SHM targeting in human heavy and light chains is distinct.

SHM targeting models were estimated using silent mutations in functional sequences from four subjects (HD samples in Table 2). (A) The mutability of each 5-mer (points) was compared between light and heavy chains for the models based on all individuals (HD samples) combined. (B) Separate SHM targeting models were constructed for heavy chains and light chains from each individual, and the Spearman correlation coefficients of the 5-mer mutabilities between each pair of individuals was determined. Comparisons between same types of chains (heavy vs. heavy or light vs. light) are represented by empty bars, while comparisons between heavy and light chains are represented by filled bars. The mutabilities were normalized such that the average mutability of the motifs observed in both chains was 1.
Species-specific and chain-specific targeting
To explore the global relationships between the species- and chain-specific SHM targeting models, we built separate targeting models for each individual mouse and human of the following categories: (1) κ light chain sequences from four NP-immunized mice (RS5NF models), (2) κ light chain sequences from two control mice (S5F models), (3) κ and λ light chain sequences from four healthy human subjects (S5F models), (4) heavy chain sequences from four healthy human subjects (S5F models), (5) heavy chain sequences from 11 human subjects used in a previous study by Yaari et al. (9) (S5F models), and (6) sequencing errors from three mouse samples (described in Materials and Methods). The pairwise distance between each of these models was defined as one minus the Spearman correlation of the mutability estimates. Principal component analysis was then used to project this distance matrix onto the first two principal components, which together account for most of the variance in the distance matrix (95%) (see Materials and Methods) (Figure 6A). We found that mouse light chains, human light chains, and human heavy chains clustered into distinct groups. The high consistency of samples within each group, combined with the disparity across the groups, indicates that different species and chains have distinct targeting patterns. These differences were not completely due to the increased targeting of C/G bases in mice, since renormalizing the models to have the same mutability for all 5-mers with the same central base produced a similar result. The differences observed across chains and between species were also not likely due to usage of distinct germline sequences because mutabilities are normalized based on the frequency of occurrence of each motif in the germline sequences. To confirm this, the analyses were repeated using separate models constructed for each V gene family independently. These results showed that the variation between V gene families at the same locus was small compared to the differences observed across chains and between species. All of the models were clustered far from the sequencing error model, providing reassurance that the SHM targeting models were not significantly influenced by potential sequencing errors. Interestingly, the human light chain models were intermediate between the murine light chain and the human heavy chain models, suggesting some conservation of SHM mechanisms targeting this locus. To better understand how these differences in SHM targeting could impact affinity maturation, we designed a simulation-based analysis to quantify how often the models lead to different mutations being introduced in a repertoire of 2,000 Musmus IGKV1-135*01 sequences (the most frequent segment among mouse non-functional sequences) each carrying 5 mutations. Ten simulated repertoires were generated for each SHM model (mouse light chain, human light chain and human heavy chain) using a mutation algorithm previously described (8). We found that two repertoires that responded independently under the same mutability model (mouse light chain) would differ in ~13% of mutations. In contrast, responses that evolved under the mouse light chain model differed from those using the human heavy chain model by >38% (Figure 6B). In contrast to the PCA in Figure 6A, the human light chain model was not closer to the mouse light chain than the human heavy chain. This is because the V segment chosen for the simulation lacks the sequence motifs exhibiting similar mutabilities between the mouse light chain model and the human light chain model. However, in simulations with other V segment sequences, we observed that the human light chain model rendered more similar mutations as the mouse light chain model. Overall, these analyses provide strong evidence for species-specific and chain-specific targeting in the SHM process, and highlight the need to use the proper targeting models for the analysis of SHM patterns.
Figure 6. SHM targeting displays species-specific and chain-specific features.

(A) The distance between each pair of targeting models was defined as one minus the Spearman correlation measure between the mutabilities of the 5-mer motifs observed in both models. PCA was used to project this distance matrix onto two components that explain most of the variance. Analyzed models include: S5F model from human heavy chains in 15 subjects (HD samples in Table 2 and previous dataset (9)) (open circles), S5F model from human light chains in four subjects (HD samples in Table 2) (squares), S5F model from murine light chains in two mice (C1-2 in Table 1) (open triangles), RS5NF model from murine light chains in four mice (NP1-4 in Table 1) (filled triangles), sequencing errors determined from large UID groups (X). (B) A simulation-based analysis was used to quantify how often the SHM targeting models lead to different mutations being introduced in a repertoire of 2,000 Musmus IGKV1-135*01 sequences (the most frequent segment among non-functional mouse sequences) each carrying 5 mutations (see Methods for details).
DISCUSSION
Models of SHM micro-sequence targeting and substitution bias can provide mechanistic insights into the underlying mutation and DNA repair pathways, and serve as critical background models for statistical analyses of mutation patterns. The development of SHM targeting models has been hindered by the difficulty in identifying large numbers of somatic mutations that have not been influenced by selection. To overcome this limitation, we employed high-throughput sequencing to generate a large number of κ light chains from NP-binding GC B cells. Since B cells specific for the NP hapten utilize λ light chains, many of these cells also carry a non-functional κ light chain sequence. These non-functional κ light chains accumulated significant numbers of somatic mutations following NP immunization. To model SHM targeting, we adapted the 5-mer micro-sequence targeting framework (12), which estimates the mutability of each base as a function of the surrounding two bases upstream and two bases downstream. This approach captured SHM targeting patterns that were highly reproducible across individual mice. The patterns were also similar in sequences with low (<1%) and high (≥1%) mutation frequencies, suggesting that the SHM process is stable over time. This contrasts with the “hierarchical” model proposed by Yeap et al (34). While our data also show that early mutations are targeted preferentially to hot-spot motifs, this is due to their higher overall mutability. Hot- and cold-spot mutations are both observed in sequences with few mutations (<1%) and appear at their expected frequencies. Comparative analysis of this mouse light chain model with SHM targeting models for human light and heavy chains identified both species- and chain-specific differences.
While the mutability of classic hot- and cold-spot motifs were broadly similar in mice and humans, SHM targeting in mice was characterized by increased C/G targeting. Previous studies suggested that SHM targeting in mice and humans were similar, and that there were no chain-specific differences (9). However, the number of sequences and mutations in these studies were significantly smaller compared to this study. While the gross patterns are similar with the previous finding, the novel observations of both species-specific and locus-specific patterns of mutation imply that there are unique molecular mechanisms operating and/or that the extent of activity of certain mechanisms varies across species and loci. The increased targeting of C/G (vs. A/T) bases combined with the increased transition frequency specifically at C/G bases in mice is consistent with less involvement of the DNA error repair pathways normally associated with SHM relative to humans. Thus, in this mouse model, more of the AID-induced lesions are resolved by a simple replication event without the involvement of base excision or mismatch repair. Light and heavy chains display overall similar targeting patterns, but the detailed mutability patterns within each hot- or cold-spot displayed large discrepancy. One explanation for locus-specific targeting is that differences in the regulatory elements (e.g., promoters and enhancers) in heavy and light chain genes indeed control recruitment of AID and DNA repair factors like uracil-DNA glycosylase (UNG) and error-prone polymerases. Each repair mechanism may have distinct preference in targeting motifs, and the shift in the contribution of repair mechanisms may be reflected in micro-sequence targeting specificity. Overall, these species- and chain-specific differences highlight the importance of using a SHM targeting model that is appropriately matched for the data being analyzed.
A potential limitation of this study concerns the comparison of functional versus non-functional sequences. In the mouse system, the total number of mutations in functional sequences was low, and thus may be more influenced by sequencing errors. However, the confirmation that SHM targeting in functional and non-functional sequences in human subjects was also similar supports our conclusion that data from non-functional sequences can be used as a model for mutation patterns in functional sequences. It is possible that the 5-mer model does not fully capture the influence of micro-sequence context on mutability and that targeting may be influenced by bases that are further up- or down-stream. However, extending the analysis to longer motifs (e.g., 7-mers) would require much higher sequence coverage to account for the large number of possible nucleotide combinations (e.g. 16,384 combinations of 7-mers). It is also important to acknowledge that no motif-based model may be sufficient to capture the full complexity of SHM targeting, which may be influenced uniquely by each V gene context. However, the observation that the same conclusions hold when running the analysis independently each V gene family suggests that this is unlikely. There is also a caveat in the comparison between species. The human samples in the study were from a diverse population, while the mouse models were based on a single inbred laboratory strain. It is possible that the patterns observed are specific to this strain. Finally, it is important to note that the sequencing error models were built from sequences with identical UIDs, which captures the PCR and sequencing errors, but not errors introduced in the reverse transcription step upstream of the UID-tagging process.
The models developed here quantitatively characterize SHM targeting without the biasing influence of selection pressures. In addition to revealing previously unrecognized hot- and cold-spots as well as the influence of species and locus, these models provide important background distributions for statistical analysis of affinity maturation in experimentally derived Ig sequencing data. Specifically, we developed two new models: (1) the mouse RS5NF light chain, and (2) the human S5F light chain models. These models compliment the previously published human S5F heavy chain model (12), and are available in the shm R package of our Change-O toolkit (24).
Supplementary Material
ACKNOLEDGEMENTS
The authors thank Drs. Gur Yaari and Mohamed Uduman for their feedback and technical assistance. The authors thank the Yale University Biomedical High Performance Computing Center for use of their computing resources.
This work was supported by grants from the National Institute of Health R03AI092379 and R01AI104739 to SHK and R01AI43603 to MJS, grants from the Myasthenia Gravis Foundation of America and from the National Institute of Allergy and Infectious Diseases (NIAID) award numbers R01AI114780 and U19 AI056363 to KCO, a Natural Sciences and Engineering Research Council of Canada postgraduate fellowship (NSERC PGS-M) to AC, and National Library of Medicine grant T15LM07056 to JAVH. The Yale University Biomedical High Performance Computing Center is funded by National Institutes of Health grants RR19895 and RR029676-01. The content is solely the responsibility of the authors and does not necessarily represent the official views of the National Institutes of Health.
LIST OF ABBREVIATIONS
- SHM
somatic hypermutation
- S5F
silent mutation, 5-mer, functional chain
- RS5NF
replacement and silent mutations, 5-mer, non-functional chain
- PCR
polymerase chain reaction
- NGS
next generation sequencing
- PBMC
peripheral blood mononuclear cells
- GC
germinal center
REFERENCES
- 1.Mckean D, Huppit K, Bell M, Staudtt L, Gerhardt W, Weigertt M. Generation of antibody diversity in the immune response of BALB/c mice to influenza virus hemagglutinin. Proc. Natl. Acad. Sci. U. S. A. 1984;81:3180–3184. doi: 10.1073/pnas.81.10.3180. [DOI] [PMC free article] [PubMed] [Google Scholar]
- 2.Peled JU, Kuang FL, Iglesias-Ussel MD, Roa S, Kalis SL, Goodman MF, Scharff MD. The biochemistry of somatic hypermutation. Annu. Rev. Immunol. 2008;26:481–511. doi: 10.1146/annurev.immunol.26.021607.090236. [DOI] [PubMed] [Google Scholar]
- 3.Rogozin IB, Kolchanov N. a. Somatic hypermutagenesis in immunoglobulin genes. II. Influence of neighbouring base sequences on mutagenesis. Biochim. Biophys. Acta. 1992;1171:11–8. doi: 10.1016/0167-4781(92)90134-l. [DOI] [PubMed] [Google Scholar]
- 4.Betz a G., Rada C, Pannell R, Milstein C, Neuberger MS. Passenger transgenes reveal intrinsic specificity of the antibody hypermutation mechanism: clustering, polarity, and specific hot spots. Proc. Natl. Acad. Sci. U. S. A. 1993;90:2385–8. doi: 10.1073/pnas.90.6.2385. [DOI] [PMC free article] [PubMed] [Google Scholar]
- 5.Pham P, Bransteitter R, Petruska J, Goodman MF. Processive AID-catalysed cytosine deamination on single-stranded DNA simulates somatic hypermutation. Nature. 2003;424:103–7. doi: 10.1038/nature01760. [DOI] [PubMed] [Google Scholar]
- 6.Kenneth H, Anna F, Gerton L, Pybus OG. The diversity and molecular evolution of B cell receptors during infection. Mol. Biol. Evol. 2016:1–5. doi: 10.1093/molbev/msw015. [DOI] [PMC free article] [PubMed] [Google Scholar]
- 7.Betz a G., Neuberger MS, Milstein C. Discriminating intrinsic and antigen-selected mutational hotspots in immunoglobulin V genes. Immunol. Today. 1993;14:405–11. doi: 10.1016/0167-5699(93)90144-a. [DOI] [PubMed] [Google Scholar]
- 8.Yaari G, Uduman M, Kleinstein SH. Quantifying selection in high-throughput Immunoglobulin sequencing data sets. Nucleic Acids Res. 2012;40:e134. doi: 10.1093/nar/gks457. [DOI] [PMC free article] [PubMed] [Google Scholar]
- 9.Shapiro GS, Aviszus K, Ikle D, Wysocki LJ. Predicting regional mutability in antibody V genes based solely on di- and trinucleotide sequence composition. J. Immunol. 1999;163:259–68. [PubMed] [Google Scholar]
- 10.Cowell LG, Kepler TB. The Nucleotide-Replacement Spectrum Under Somatic Hypermutation Exhibits Microsequence Dependence That Is Strand-Symmetric and Distinct from That Under Germline Mutation. J. Immunol. 2000;164:1971–1976. doi: 10.4049/jimmunol.164.4.1971. [DOI] [PubMed] [Google Scholar]
- 11.Shapiro G. Sequence-specific targeting of two bases on both DNA strands by the somatic hypermutation mechanism. Mol. Immunol. 2003;40:287–295. doi: 10.1016/s0161-5890(03)00101-9. [DOI] [PubMed] [Google Scholar]
- 12.Yaari G, Vander Heiden J. a, Uduman M, Gadala-Maria D, Gupta N, Stern JNH, O’Connor KC, Hafler D. a, Laserson U, Vigneault F, Kleinstein SH. Models of somatic hypermutation targeting and substitution based on synonymous mutations from high-throughput immunoglobulin sequencing data. Front. Immunol. 2013;4:358. doi: 10.3389/fimmu.2013.00358. [DOI] [PMC free article] [PubMed] [Google Scholar]
- 13.Oprea M, Cowell LG, Kepler TB. The Targeting of Somatic Hypermutation Closely Resembles That of Meiotic Mutation. J. Immunol. 2001;166:892–899. doi: 10.4049/jimmunol.166.2.892. [DOI] [PubMed] [Google Scholar]
- 14.Inlay M. a., Gao HH, Odegard VH, Lin T, Schatz DG, Xu Y. Roles of the Ig Light Chain Intronic and 3′ Enhancers in Igk Somatic Hypermutation. J. Immunol. 2006;177:1146–1151. doi: 10.4049/jimmunol.177.2.1146. [DOI] [PubMed] [Google Scholar]
- 15.Rouaud P, Vincent-Fabert C, Saintamand A, Fiancette R, Marquet M, Robert I, Reina-San-Martin B, Pinaud E, Cogné M, Denizot Y. The IgH 3′ regulatory region controls somatic hypermutation in germinal center B cells. J. Exp. Med. 2013;210:1501–7. doi: 10.1084/jem.20130072. [DOI] [PMC free article] [PubMed] [Google Scholar]
- 16.Buerstedde J-M, Alinikula J, Arakawa H, McDonald JJ, Schatz DG. Targeting of somatic hypermutation by immunoglobulin enhancer and enhancer-like sequences. PLoS Biol. 2014;12:e1001831. doi: 10.1371/journal.pbio.1001831. [DOI] [PMC free article] [PubMed] [Google Scholar]
- 17.Betz AG, Milstein C, González-Fernández A, Pannell R, Larson T, Neuberger MS. Elements regulating somatic hypermutation of an immunoglobulin κ gene: Critical role for the intron enhancer/matrix attachment region. Cell. 1994;77:239–248. doi: 10.1016/0092-8674(94)90316-6. [DOI] [PubMed] [Google Scholar]
- 18.Chan OT, Hannum LG, Haberman a M., Madaio MP, Shlomchik MJ. A novel mouse with B cells but lacking serum antibody reveals an antibody-independent role for B cells in murine lupus. J. Exp. Med. 1999;189:1639–48. doi: 10.1084/jem.189.10.1639. [DOI] [PMC free article] [PubMed] [Google Scholar]
- 19.Tsioris K, Gupta NT, Ogunniyi AO, Zimnisky RM, Qian F, Yao Y, Wang X, Stern JN, Chari R, Briggs AW, Clouser CR, Vigneault F, Church GM, Garcia MN, Murray KO, Montgomery RR, Kleinstein SH, Love JC. Neutralizing antibodies against West Nile virus identified directly from human B cells by single-cell analysis and next generation sequencing. Integr. Biol. 2015;7:1587–1597. doi: 10.1039/c5ib00169b. [DOI] [PMC free article] [PubMed] [Google Scholar]
- 20.Stern J, Yaari G, Vander Heiden J, Church G, Donahue W, Hintzen R, Huttner A, Laman J, Nagra R, Nylander a, Pitt D, Ramanan S, Siddiqui B, Vigneault F, Kleinstein S, Hafler D, O’Connor K. B cells populating the multiple sclerosis brain mature in the draining cervical lymph nodes. Sci. Transl. Med. 2014;6:248ra107–248ra107. doi: 10.1126/scitranslmed.3008879. [DOI] [PMC free article] [PubMed] [Google Scholar]
- 21.Di Niro R, Lee S-J, Vander Heiden JA, Elsner RA, Trivedi N, Bannock JM, Gupta NT, Kleinstein SH, Vigneault F, Gilbert TJ, Meffre E, McSorley SJ, Shlomchik MJ. Salmonella Infection Drives Promiscuous B Cell Activation Followed by Extrafollicular Affinity Maturation. Immunity. 2015;43:120–131. doi: 10.1016/j.immuni.2015.06.013. [DOI] [PMC free article] [PubMed] [Google Scholar]
- 22.Vander Heiden J. a, Yaari G, Uduman M, Stern JNH, O’Connor KC, Hafler D. a, Vigneault F, Kleinstein SH. pRESTO: a toolkit for processing high-throughput sequencing raw reads of lymphocyte receptor repertoires. Bioinformatics. 2014;30:1930–2. doi: 10.1093/bioinformatics/btu138. [DOI] [PMC free article] [PubMed] [Google Scholar]
- 23.Alamyar E, Giudicelli V, Li S, Duroux P, Lefranc M-P. HighV-QUEST: the IMGT® web portal for immunoglobulin (IG) or antibody and T cell receptor (TR) analysis from NGS high throughput and deep sequencing. Immunome. 2012:1–15. [Google Scholar]
- 24.Gupta NT, Vander Heiden J. a., Uduman M, Gadala-Maria D, Yaari G, Kleinstein SH. Change-O: a toolkit for analyzing large-scale B cell immunoglobulin repertoire sequencing data: Table 1. Bioinformatics. 2015;31:3356–3358. doi: 10.1093/bioinformatics/btv359. [DOI] [PMC free article] [PubMed] [Google Scholar]
- 25.Smith DS, Creadon G, Jena PK, Portanova JP, Kotzin BL, Wysocki LJ. Di- and trinucleotide target preferences of somatic mutagenesis in normal and autoreactive B cells. J. Immunol. 1996;156:2642–52. [PubMed] [Google Scholar]
- 26.Benichou J, Ben-Hamo R, Louzoun Y, Efroni S. Rep-Seq: uncovering the immunological repertoire through next-generation sequencing. Immunology. 2012;135:183–191. doi: 10.1111/j.1365-2567.2011.03527.x. [DOI] [PMC free article] [PubMed] [Google Scholar]
- 27.Hieter PA, Korsmeyer SJ, Waldmann TA, Leder P. Human immunoglobulin κ light-chain genes are deleted or rearranged in λ-producing B cells. Nature. 1981;290:368–372. doi: 10.1038/290368a0. [DOI] [PubMed] [Google Scholar]
- 28.Jacob J, Kassir R, Kelsoe G. In situ studies of the primary immune response to (4-hydroxy-3-nitrophenyl)acetyl. I. The architecture and dynamics of responding cell populations. J. Exp. Med. 1991;173:1165–75. doi: 10.1084/jem.173.5.1165. [DOI] [PMC free article] [PubMed] [Google Scholar]
- 29.Diaw L, Siwarski D, DuBois W, Jones G, Huppi K. Double producers of kappa and lambda define a subset of B cells in mouse plasmacytomas. Mol. Immunol. 2001;37:775–781. doi: 10.1016/s0161-5890(00)00100-0. [DOI] [PubMed] [Google Scholar]
- 30.Dörner T, Brezinschek HP, Brezinschek RI, Foster SJ, Domiati-Saad R, Lipsky PE. Analysis of the frequency and pattern of somatic mutations within nonproductively rearranged human variable heavy chain genes. J. Immunol. 1997;158:2779–89. [PubMed] [Google Scholar]
- 31.Stern JNH, Yaari G, Vander Heiden JA, Church G, Donahue WF, Hintzen RQ, Huttner AJ, Laman JD, Nagra RM, Nylander A, Pitt D, Ramanan S, Siddiqui BA, Vigneault F, Kleinstein SH, Hafler DA, O’Connor KC. B cells populating the multiple sclerosis brain mature in the draining cervical lymph nodes. Sci. Transl. Med. 2014;6:248ra107–248ra107. doi: 10.1126/scitranslmed.3008879. [DOI] [PMC free article] [PubMed] [Google Scholar]
- 32.Yélamos J, Klix N, Goyenechea B, Lozano F, Chui YL, González Fernández A, Pannell R, Neuberger MS, Milstein C. Targeting of non-Ig sequences in place of the V segment by somatic hypermutation. Nature. 1995;376:225–9. doi: 10.1038/376225a0. [DOI] [PubMed] [Google Scholar]
- 33.Golding GB, Gearhart PJ, Glickman BW. Patterns of somatic mutations in immunoglobulin variable genes. Genetics. 1987;115:169–176. doi: 10.1093/genetics/115.1.169. [DOI] [PMC free article] [PubMed] [Google Scholar]
- 34.Yeap LS, Hwang JK, Du Z, Meyers RM, Meng FL, Jakubauskaite A, Liu M, Mani V, Neuberg D, Kepler TB, Wang JH, Alt FW. Sequence-Intrinsic Mechanisms that Target AID Mutational Outcomes on Antibody Genes. Cell. 2015;163:1124–1137. doi: 10.1016/j.cell.2015.10.042. [DOI] [PMC free article] [PubMed] [Google Scholar]
Associated Data
This section collects any data citations, data availability statements, or supplementary materials included in this article.