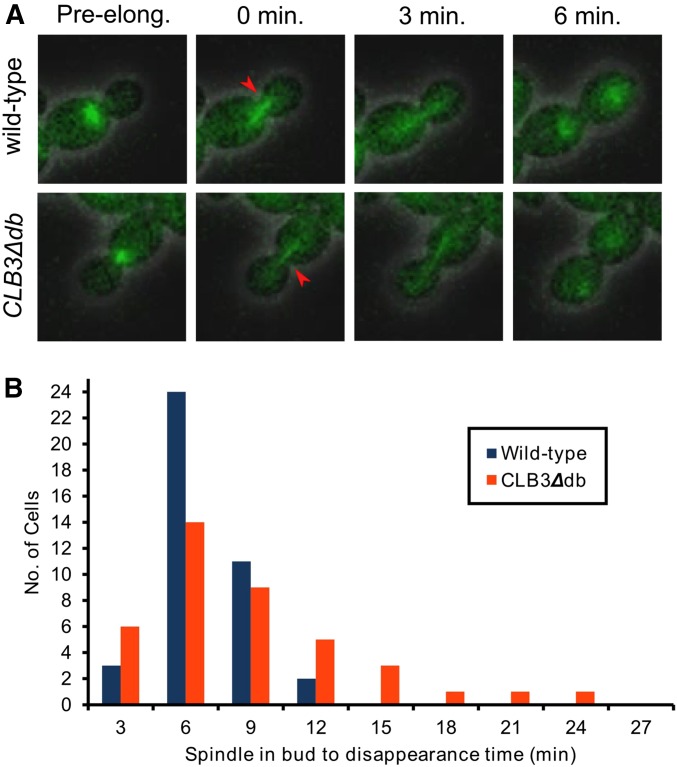
Figure 4.
Measurement of anaphase length in wild-type and CLB3∆db cells using time-lapse microscopy. (A) Representative TUB1-GFP images. Length of anaphase was scored as entry of spindle into the bud (AE) to spindle disappearance (AD). Red arrows indicate newly formed spindle. (B) Distribution of anaphase times (AE to AD) in wild-type and CLB3∆db cells.

