

Abstract
Although Response Evaluation Criteria in Solid Tumors (RECIST) is the current clinical guideline to assess size change of solid tumors after therapeutic treatment, it has a relatively lower association to the clinical outcome of progression free survival (PFS) of the patients. In this paper, we presented a new approach to assess responses of ovarian cancer patients to new chemotherapy drugs in clinical trials. We first developed and applied a multi-resolution B-spline based deformable image registration method to register two sets of computed tomography (CT) image data acquired pre- and post-treatment. The B-spline difference maps generated from the co-registered CT images highlight the regions related to the volumetric growth or shrinkage of the metastatic tumors, and density changes related to variation of necrosis inside the solid tumors. Using a testing dataset involving 19 ovarian cancer patients, we compared patients’ response to the treatment using the new image registration method and RECIST guideline. The results demonstrated that using the image registration method yielded higher association with the six-month PFS outcomes of the patients than using RECIST. The image registration results also provided a solid foundation of developing new computerized quantitative image feature analysis schemes in the future studies.
Index Terms: Computed tomography (CT), computer-aided diagnosis (CAD), deformable image registration, metastatic tumors, ovarian cancer, response evaluation criteria in solid tumors (RECIST), tumor volume and necrosis tracking
I. INTRODUCTION
OVARIAN cancer is the second most common cancer amongst gynecologic malignancies and has the highest mortality rate [1]. Due to the lack of an effective early cancer screening and detection method, more than 70% of ovarian cancers are diagnosed at an advanced stage (III or IV) with tumor metastasis to other organs. The current 5-year survival rate for the advanced ovarian cancer patients is less than 30% [2]. In current clinical practice, a surgical procedure is first applied to remove the primary ovarian tumors. The remaining metastatic tumors are then treated by chemotherapy. Due to the heterogeneity of the ovarian cancer cases, identifying and applying effective therapeutic drugs to the individual patients becomes an important issue to increase patients’ progression-free survival (PFS) and/or overall survival (OS).
Since the recent advances in the development of biomarkers to identify molecular fingerprints of genetic defects in cancer, many researchers believe that using these biomarkers, targeted therapies and new drugs may be optimally selected to treat patients by increasing PFS or OS and minimizing harmful side effects [3], [4]. However, the use of existing biomarkers to align a specific treatment strategy of a patient still faces multiple challenges. In ovarian cancer, although a specific tumor biomarker (CA 125) has been identified and used to monitor tumor response to treatment, normal CA 125 values cannot be used to exclude the presence of disease, whereas elevated CA 125 cannot be used to differentiate between localized and diffuse tumor recurrence [5]. Thus, imaging, e.g., ultrasound, computed tomography (CT) and magnetic resonance imaging (MRI), still plays an important role in assessing risk of ovarian cancer recurrence [6] and/or cancer prognosis [7].
In order to improve treatment results, many drug companies are currently working to develop and test new chemotherapy drugs for ovarian cancer. In the early phase of clinical trials, it is important to predict whether the patients can receive benefit or harm from participating in the clinical trial as early as possible. For this purpose, CT is the most popular and cost-effective imaging tool to evaluate the potential treatment efficacy based on an established guideline of Response Evaluation Criteria in Solid Tumors (RECIST) [8], which divides tumor response into 4 categories, namely: (a) complete response (CR) i.e., complete disappearance of targeted tumors after treatment; (b) partial response (PR) i.e., at least a 30% reduction in targeted tumor size; (c) progressive disease (PD) i.e., at least a 20% increase in targeted tumor size; and (d) stable disease (SD) i.e., neither sufficient shrinkage to qualify for PR nor sufficient increase to qualify for PD. The tumor size is defined by the longest diameter measured from one subjectively selected CT slice.
However, using RECIST-guided approach has two major limitations. It cannot fully represent the volumetric change in a tracked tumor and also only a few tumors (≤ 5 per case and ≤ 2 per organ [8]) are tracked by radiologists, whereas many other metastatic tumors are excluded or overlooked in the clinical evaluation process. Thus, it is not surprising that the assessment results of using RECIST shows a poor association with the clinical outcome (i.e., PFS of the patients [9]). Furthermore, although some cancer-related gene expression or DNA damage can be observed through the variation of phenotypic patterns of CT images with high correlation [10], [11], subjectively assessing these image features is unreliable due to the inter-reader variability.
In order to help solve this clinical issue, performing image registration between the sequential CT images acquired pre- and post-treatment of the same patients can be a useful approach to assess tumor response to the therapy. Hence, developing computerized image registration methods that aim to automatically track all clinically-relevant tumors by measuring volumetric tumor growth or shrinkage has attracted research interest. In the literature, several studies tested the feasibility of applying image registration based approaches to detect growth of metastatic tumors and using RECIST as a measurement criterion [12]–[14]. However, these studies employed rigid registration methods to register images based on bone structures, which cannot accurately measure the volumetric changes in soft tissue tumors, such as the multiple metastatic tumors that spread out in different organs for the ovarian cancer patients. To compensate the image registration requirement on soft-tissue based tumors located in different organs, we in this study applied and tested a B-spline based deformable image registration method to detect tumors that have detectable changes in the volume and necrotic regions, which include tumors that have been either tracked or not tracked by the radiologists using RECIST guideline in clinical practice. By quantitatively examining the tumor volume and possible necrotic region changes that are highlighted on the B-spline difference maps generated by our deformable image registration scheme, we assessed the potential of applying this new image registration and quantitative image feature analysis scheme to predict patients’ 6-month PFS, which means survival of the patients with no tumor progression within the 6 months after taking new testing chemotherapy drug. The 6-month PFS is a US FDA approved criterion routinely used in early phase of clinical trials of testing new chemotherapy drugs to increase trial efficiency and reduce the harm (or toxicity) to the patients [15]. The prediction performance was also compared with that using the RECIST criterion.
II. METHODOLOGY
A multiresolution (from coarse to fine) based B-spline image registration method has been previously developed as a nonrigid image registration method [16] that has been applied to register different modality images (e.g., PET-CT of chest images [17]) or the images of a single organ (e.g., breast MR images [18]). However, due to the wide spread of tumor metastasis in different organs of the body, CT images of the ovarian cancer patients cover a wide body area starting from lung to pelvic regions. Hence, whether a B-spline based non-rigid image registration method enables to register such a large area of the body in which many organs have quite different tissue characteristics and moving patterns over time is untested. Hence, to improve performance and reliability of registering sequential CT images of ovarian cancer patients, we developed a new non-rigid image registration procedure.
In this study, we retrospectively selected CT images acquired from a group of 19 ovarian cancer patients who had previously participated in phase 1 clinical trials to test new drugs in Stephenson Cancer Center, University of Oklahoma. Each patient had 2 sets of perfusion CT examinations taken pre- and post-treatment. In each CT examination, 100 contrast agent of Isovue 370 was intravenously injected using a standard power injector with a rate at 2–3 cm3/s. Two phases of CT scans were performed in each examination. The first scan phase began 80 seconds after start of contrast injection and the second (delay) phase began 5 minutes after contrast injection. Each phase of scan took approximately 4 seconds. The first CT examination was performed before treatment and the second examination was performed approximately 6 weeks after starting treatment. Both sequential CT examinations were performed with all subjects supine using the LightSpeed Ultra CT machines (GE Medical Systems) with a standardized CT image scanning protocol (120 kV and 200 mA). The CT images were reconstructed with slice thickness of 5 mm. The purpose of the second post-treatment scan was to assess patients’ response to treatment. Patients who tolerated and responded well to the therapy continued to be treated on the study drug. Otherwise, the treatment was stopped to minimize the harmful side-effects to the patients. The goal is to predict the probability of the patients having 6-month PFS using the new drugs at an early stage. Of these 19 patients, 10 had disease progression (the negative 6-month PFS) and 9 had no disease progression survival (the positive 6-month PFS).
Instead of visually tracking a limited number of tumors and measuring tumor size change in two sets of sequential CT images using RECIST guideline by the radiologists, we developed and tested a new image registration method to detect tumors that have changes in both volume and necrotic regions (or density). In our method, we registered 2 consecutive CT scans using a B-spline based deformable image registration algorithm. We then subtracted the co-registered scans to obtain a corresponding “B-spline difference map.” Based on the differences in the B-spline difference map, we analyzed the volumetric growth or shrinkage of all detected metastatic tumors. The goal of image registration is to determine the spatial transform that maps points from one image to homologous points on an object in the second image [19], [20]. We implemented our B-spline deformable image registration algorithm using Insight Toolkit (ITK) version 4.5 [19] with the following steps.
A. Preprocessing
Although using the same CT image scanning protocol, the CT image slice (in z-direction) is uniform (with slice thickness of 5 mm), the in-plane (x-y) pixel size may vary substantially in pre- and post-treatment CT imaging scans due to patient’s position change during the two CT examinations. Hence, an image-centered scaling transform was added and used as an image preprocessing step in our image registration algorithm.
The scheme automatically compares the pixel spacing (sizes) of the pre- and post-treatment CT images. If the ratio of the image with higher pixel spacing to the image with lower pixel spacing exceeded 1.03, the image with higher pixel spacing was rescaled using the scale transform. The center of each image slice was fixed as the center of the rescaling procedure, and linear interpolation was performed to compute voxel intensities at non-grid positions. The interpolation method and the minimum ratio value (1.03) were selected based on initial experiments on a small subset of our images. In particular, we introduced the preprocessing stage as we found that the B-spline registration algorithm could not account for large scaling differences (pixel spacing ratios of >1.03) [19]. Fig. 1 shows an example of applying preprocessing method to two sets of pre- and post-treatment CT images of a patient.
Fig. 1.
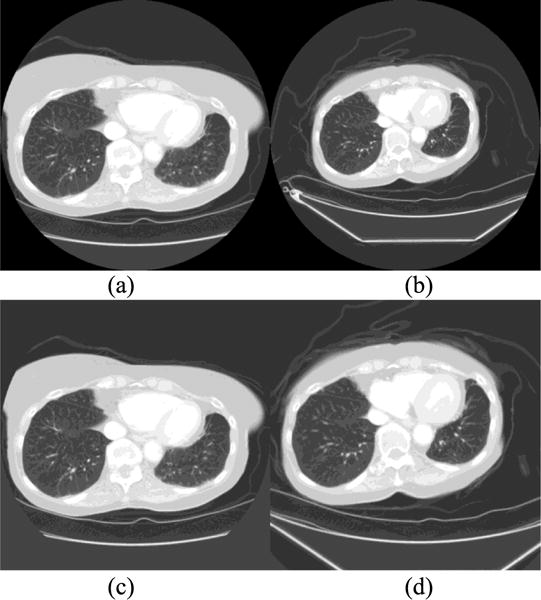
Example of fixed (a) and moving (b) image slices of a patient before pre-processing (centered rescaling), and the corresponding fixed (c) and (d) moving image slices after preprocessing. Initially, the ratio of row/column pixel spacing between the moving and fixed images was 1.32.
B. B-Spline Image Registration
After image preprocessing, two pre- and post-treatment CT image sets are registered using a modified B-spline image registration framework as displayed in Fig. 2. In ITK, the B-spline transform component represents the spatial mapping of points from the fixed image space to the moving image space [19]. The B-spline interpolator evaluates moving image intensities at non-grid positions. Optimal matching between the fixed and moving image sets is determined based on the computed Mattes mutual information (MI) metric [16]. The fitness values of MI metric is then used to guide a LBFGSB optimizer [21], [22] to further optimize this MI measure over the search space defined by the parameters of the B-spline deformable transform. This process is iteratively performed to approach the optimal results. We implemented the B-spline image registration algorithm based on the method proposed in [16], [23]. A brief summary of the method is described below.
Fig. 2.
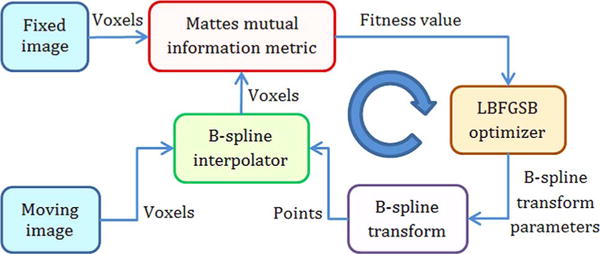
Basic components of our B-spline image registration framework (modified from [1]).
Given the two CT image sets that were acquired from the same patient at different times, image registration is used to derive a geometric transformation g that maps a point x in the first reference image, fR(x), to the point g(x) in the second test (moving) image, fT(x), that has the same patient-based coordinates (anatomic location). We assume that fT and fR are defined on the continuous domains VT and VR, respectively. g(x|μ) describes the image deformation from VT to VR, whereby is the set of transformation parameters to be determined. We then seek the transformation parameters that minimize an image discrepancy function S as follows:
| (1) |
The mutual information was used to measure image discrepancy in which we hypothesized that the transformation parameters that minimize S is the best registration of the transformed test image with the reference image.
Next, assume an image f (x) is described by a set of samples fi = f (xi), xi ∈ V defined on a Cartesian grid with integer spacing. Since to compute f (x) at points on non-grid positions imposes the requirement of an interpolation method based on the fi samples and their locations, xi, we used an interpolation scheme that represents the underlying continuous image f (x) by a B-spline basis. Thus, the values of f (x) that do not lie on the lattice can be interpolated [23].
Since the expression for the non-rigid transformation of image coordinates is an important aspect to implement image registration algorithm [16], we used cubic B-splines to model the deformations. We defined a deformation on a sparse, regular grid placed over the test image of control points λj, which is varied by defining the motion of each control point, g(λj). We also applied the B-spline interpolation kernel to compute the deformation values between the control points.
The spacing of the grid is determined by the deformation resolution ρ = [ρx, ρy, ρz], where qx, qy and qz are the dimensions of the test image. Thus, the set of control points is a regular grid with spacings:
| (2) |
The coordinates of the control points are stored in the separate three-dimensional (3D) matrices, whereby any j = (t, u, v) element of these matrices has a location in the test image, [t · Δρx, u · Δρy, v · Δρz]T. Each control point λj has a three-element deformation coefficient δj to describe the deformations in 3D Cartesian coordinates. The deformation of any point, x = [x, y, z]T in the test image is interpolated using a cubic B-spline convolutional kernel as follows:
| (3) |
whereby β3 (x) = β3 (x) β3 (y) β3 (z) is a separable cubic B-spline convolution kernel. The δj corresponding to a predefined number of control points nearest x contribute to this sum. If we differentiate (3) with respect to a deformation coefficient, the parameter appears only once in the summation resulting in a single nonzero term. The derivative with respect to a x-component deformation coefficient is as follows (y and z components are similar):
| (4) |
Given a deformation term D(x|δ), we can apply transformations to the test image as follows:
| (5) |
whereby x = [x, y, z]T is any voxel location in the reference image. The set of transformation parameters becomes:
| (6) |
whereby δj is the set of deformation coefficients.
To assess the image registration quality, the algorithm (as shown in Fig. 2) used the mutual information as the image discrepancy measure. Several steps were taken to compute the mutual information. First, let LT and LR be specified numbers of uniformly-sized bins along the dimensions of the joint histogram of the test and reference images, respectively. The histogram bins is then indexed by the integer values ι, 0 ≤ ι ≤ LT and κ, 0 ≤ κ ≤ LR, respectively.
Since calculation of mutual information requires estimates of the marginal and joint probability distributions of the intensity values of the reference and test images, a smoothed joint histogram of (fR, fT ○ g) is computed by letting β3 be a cubic spline Parzen window and β(0) be a zero-order spline Parzen window (centered unit pulse), both of which satisfy the partition of unity constraint [23].
| (7) |
whereby α is a normalization factor that ensures that , and fR(x) and fT (g(x|μ)) are samples of the reference and interpolated test images, respectively. To fit into the specified number of bins, LT or LR in the intensity distribution, each contributing image value is normalized by the corresponding minimum intensity value, or and the intensity range of each bin, ΔbT or ΔbR. The summation range V is the intersection of transformed voxels chosen from VT that maps into VR.
Finally, the mutual information S between the transformed test image and the reference image is computed as a function of the transformation parameters, u as follows [23]:
| (8) |
whereby p, pT and pR are the joint, marginal test and marginal reference probability density distributions, respectively.
Calculating the gradient of the cost function is also a necessary step to achieve the efficient and robust minimization. For a set of n-independent parameters μ, the gradient of mutual information is defined as:
| (9) |
We can determine a single component of the gradient as follows [30]:
| (10) |
The differentiation of the joint distribution in (7) is required in (10). Using the following three equations, the i-th partial derivative of the joint probability distribution after successive applications of the chain rule is given in (11) whereby #V is the number of voxels used in the summation, the image gradient is calculated in (12), and the spline derivatives (∂β(3)/∂u, ∂fT/∂t) are computed in (13).
| (11) |
| (12) |
| (13) |
To align the 2 volumetric CT image scans, we need to minimize S in (8). Since in our application, many parameters representing the wide variety of deformations on the B-spline grid need to be adjusted and optimized simultaneously, we used a LBFGSB optimizer, which has shown advantages over other optimizers (e.g., the steepest descent optimizer) when multiple parameters require tuning in the previous studies [21], [22]. The LBFGSB optimizer also allows bounds specifications for the parameters in the search space.
C. Multiresolution Optimization Method
We performed the non-rigid image registration procedure in a multiresolution (from coarse to fine) framework. Using this approach, we first performed the registration at a coarse scale (using a coarse grid for the B-spline deformation). Then, the spatial mapping determined at the coarse scale was used to initialize the registration procedure at a finer scale (using a finer grid). This coarse-to-fine strategy considerably improves the registration success rate, avoids local minima at the coarse scale and reduces overall computation time [16]. In our experiments, we determined and used a 5 × 5 × 5 B-spline node grid at the coarse scale, and an 11 × 11 × 11 grid at the fine scale. For the MI metric, the number of histogram bins used to compute the entropy was 200 and 1% of the image pixels were used for the metric evaluation. Furthermore, a maximum of 500 iterations was performed for the LBFGSB optimizer.
D. Quantitative Evaluation
After registering the pre- and post-treatment CT image scans, we subtracted the co-registered scans to obtain a new set of B-spline difference maps. We then quantitatively analyzed the tumors that have detectable volumetric or density changes between the two sets of pre- and post-treatment CT scans. First, we converted the current RECIST guidelines that measure the tumor diameter change to the equivalent tumor volume change. For example, in RECIST, PD means that the measured tumor diameter increases > 20% in two sets of CT images [8]. To convert this diameter change to the tumor volume change, we compute the original tumor volume, based on a spherical model as follows:
| (14) |
With corresponding increase of 20% in the tumor diameter after treatment, the new volume, vol2 is computed as:
| (15) |
Thus, the percentage increase in volume from vol1 to vol2 for a PD category, Δvol is given by:
| (16) |
The result shows that in PD category, tumor volume should increase > 73%. Similarly, for a PR category, > 30% decrease in the tumor diameter as established in RECIST guideline is equivalent to the decrease of > 66% of the original tumor volume. If the tumor volume change is between the PR and PD, we classified the tumor into the SD category. Based on this conversion, we were able to perform the quantitative analysis of tumor response to the chemotherapy.
To track and quantify the volume change of a tumor, we implemented and tested a semi-automated method/tool using the B-spline difference maps (as shown in Fig. 3). Using this semi-automated tool, a user (e.g., a radiologist) first visually examines the B-spline difference maps to detect the metastatic tumors that include those untracked in the original CT image reading and interpretation. Next, for each identified tumor the user uses a computer mouse to click on the tumor region on each map slice, the scheme applies an empirically-determined threshold (pixel) value of 50 to generate a binary image and performs a 2D 8-connected component labeling algorithm on the binary image to cluster all tumor related pixels. The tumor growth or shrinkage on each map slice can be identified by the color change in the B-spline difference map (dark blue or dark red) within the tumor region. This procedure was repeated for each identified tumor region on each map slice that contained the detectable tumor change signals. The total tumor volume change was then estimated by adding the connected number of voxels that correspond to either tumor growth or shrinkage, respectively. Finally, to estimate the volumetric change in the physical dimensions, the number of extracted voxels is multiplied by the physical size of each voxel.
Fig. 3.
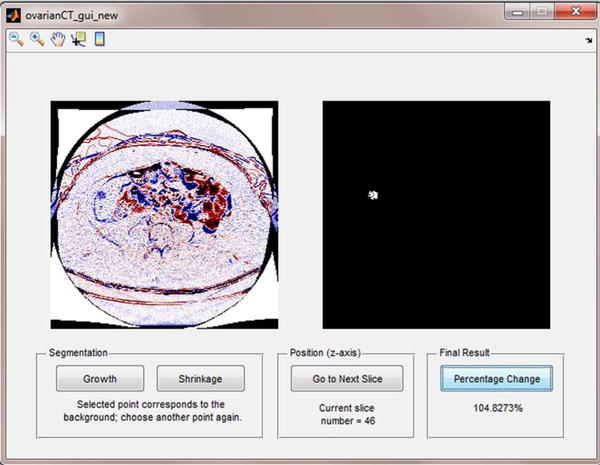
Interface of a semi-automated tool to quantify tumor volumetric change. The user clicks on a visually identified tumor region on one difference map slice (left image). Computerized scheme automatically detects and clusters all tumor related pixels to generate a corresponding binary image on the right side, and computes tumor growth or shrinkage ratio. At the last slice, when the user clicks on a “Percentage Change” button, an overall percentage of tumor volumetric change is displayed.
We repeated this procedure for each detected metastatic tumor and compute the tumor volume change. After detecting and counting the difference voxels or the absolute value of tumor volume change, we needed to estimate the original volume of the tumor pre-treatment using (14) and then compute percentage of tumor volume change post-treatment. Since each detected tumor contained radiologist-recorded annotations of the longest diameter in millimeters (RECIST) and its corresponding perpendicular transversal (cross-sectional) diameter on the same slice, we computed the original tumor volume by substituting the average diameter (of the longest diameter and the corresponding cross-sectional diameter) into (14). Finally, by computing the percentage volumetric change, we assigned a tumor to the relevant (PD, PR, SD, or CR) rating.
III. Results
Applying this new non-rigid image registration method, we are able to visually detect volumetric and density change of the tumors based on the highlighted regions (signals) depicting on the B-spline difference maps, which provide the new supplementary information that may not be detectable in a 2-dimensional (in-plane) measurement using RECIST guideline or not tracked by radiologists in original image reading. The following are a few examples of our study observation.
1) Example 1
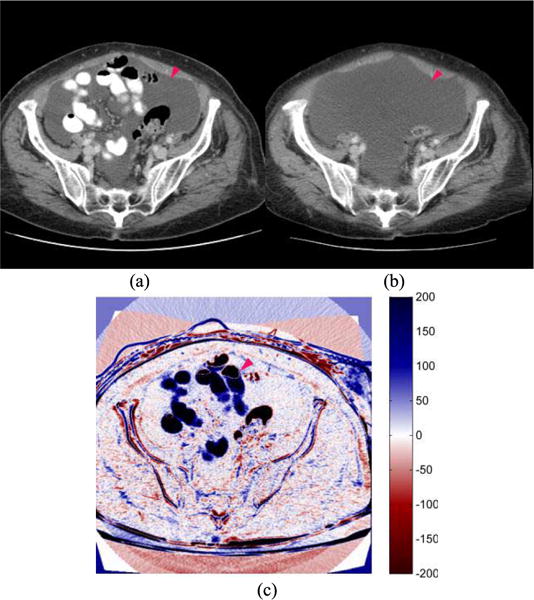
One patient had multiple liver metastases. Two tumors in the liver were tracked by the radiologist in the pre- and post-treatment CT images and they were categorized as SD (stable disease) using RECIST criterion; however, the patient was a negative in 6-month PFS (an actual progressive disease). From the B-spline difference maps, we found that one tumor remained stable in volume and another had grown considerably in the axial (z) direction during the two CT examination period. However, the vertical growth of the tumor was not detectable using RECIST guideline because it only measures the longest diameter of a lesion on one image slice (in the x-y plane). Furthermore, we also detected several other radiologists-untracked liver metastases that grew considerably. Fig. 4 shows one pair of the matched CT image slices acquired in pre- and post-treatment CT examinations, as well as the B-spline difference map of these two slices. The two image slices (Fig. 4(a) and (b)) depict two metastatic liver tumors. One was tracked by the radiologist (pointed by a light blue arrow in the center region of the image) and it remained stable (SD). This result was also confirmed by our image registration method, which shows no substantially detectable difference (an enhanced color region) in the B-spline difference map (Fig. 4(c)). However, an unmarked tumor (pointed by a magenta arrow in the up-left corner of the liver region of the CT image slice) had grown considerably in the z direction, thus appearing at the same image position in the co-registered post-treatment scan and producing a strong positive response (highlighted region) in the B-spline difference map (Fig. 4(c)).
Fig. 4.
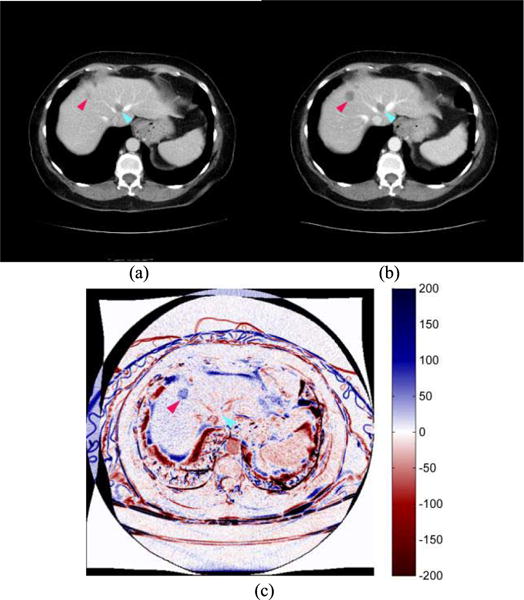
Two image slices acquired from (a) pre- and (b) post-treatment CT examinations of one patient, and (c) a B-spline difference map of two CT image slices. A tracked tumor by the radiologist (pointed by a light blue arrow) remained unchanged and also did not appear in the B-spline difference map (zero/white response). An unmarked lesion (pointed by a magenta arrow) had grown considerably in the axial direction with a positive (dark blue) response high-lighted on the B-spline difference map. Overall percentage volumetric growth was approximately 105%.
2) Example 2
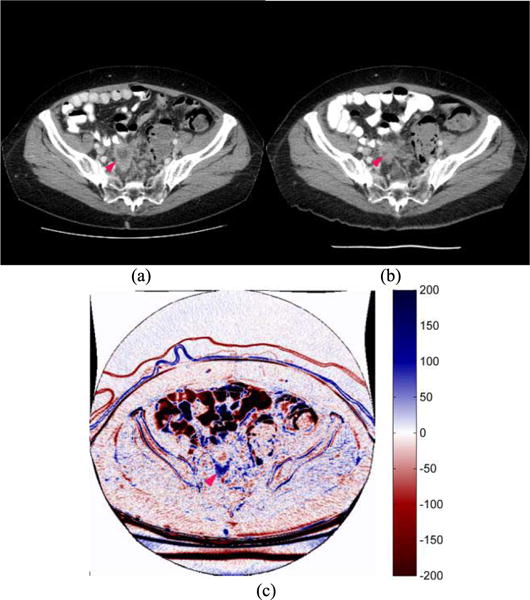
Fig. 5 displays another patient with a Partial Response (PR) status based on the clinical evaluation using RECIST guideline. The patient was also negative in 6-month PFS. For this patient, 2 metastases tracked by the radiologist had shrunk considerably; however, an unmarked lesion in the lower abdomen region had grown considerably (Fig. 5(b)). The lesion had spread to the other anatomical structures (intestines) that were previously present in the lower abdomen (Fig. 5(a)), thus producing many strong positive responses (dark blue regions) in the B-spline difference map (Fig. 5(c)). The results from these two examples (Figs. 4 and 5) indicate that the highlighted signals observed or detected in the B-spline difference map can be used as an identifier or guide to locate unmarked lesions and to more accurately track metastatic size changes of these lesions in a three-dimensional space during the pre- and post-treatment period.
Fig. 5.
Two image slices acquired from (a) pre- and (b) post-treatment CT examinations of one patient, and (c) a B-spline difference map of two CT image slices. The image shows that an untracked tumor (pointed by a magenta arrow) had grown considerably with strong positive (dark blue) responses in the B-spline difference map. Unequivocal progression of the tumor signifies overall disease progression (PD).
3) Example 3
Fig. 6 displays an image of the third patient that had a necrotic region visible in the pre-treatment scan. In the post-treatment scan, most parts of necrotic region had become dense again. The patient was also negative in 6-month PFS. In the B-spline difference map (Fig. 6(c)), signals of both tumor boundary shrinkage (shown in dark blue) and reduction of central necrosis region (dark red color) are visually detected, indicating that the B-spline image registration method can also detect/highlight soft tissue regions with changing densities that may relate to the change of necrosis or density of the tumor.
Fig. 6.
Two image slices acquired from (a) pre- and (b) post-treatment CT examinations of one patient, as well as (c) a B-spline difference map of two CT image slices in which changes of tumor size and necrosis density are high-lighted. Although the tumor size and necrosis region had decreased, many new liver metastases had appeared in the post-treatment scan signifying disease progression (PD).
Table I summarizes our observation results from the B-spline difference maps of all 19 cases. The re-assessment of tumor response to the treatment status of each case using the B-spline difference maps was also compared with the original RECIST category assigned by the radiologists as well as the 6-month PFS outcome. From the comparison, we observed that because RECIST guidelines only measure a tumor diameter in one image slice (in x-y plane), the volumetric growth or shrinkage of the metastases in the z-axis (axial) direction was not considered and taken into account, which likely led to the unexpected or erroneous prediction in the 6-month PFS. Furthermore, as RECIST only tracks a few selected tumors, the changes in other unmarked tumors could also cause discrepancies in the final 6-month PFS prediction.
TABLE I.
Summary of the Observed Tumor Volume and Necrosis Region Changes From the Pre- and Post-Treatment CT Image Examinations Using B-Spline Based Non-Rigid Image Registration Method and Comparison With RECIST Measurements and Categories Assigned by Radiologists for 19 Patients With Their Corresponding 6-Month PFS Outcomes. In the Columns of Recist Category and Re-Assessment Using the Observation on the Registered Images, the Following Labels Apply: SD – Stable Disease, PR – Partial Response, and PD – Progressive Disease
| Patient no. | Tumor diameter change using RECIST (%) | Final rating using RECIST | Tumor volume change using new scheme (%) | Final rating using new scheme | 6-month PFS | Observation on the registered B-spline difference maps |
|---|---|---|---|---|---|---|
| 1 | 34 | PD | 170 | PD | No | The registration results confirmed that there were 2 metastases. There was significant/considerable growth in the second marked metastasis in the post-treatment scan. |
| 2 | −25 | SD | Unequivocal progressiona | PD | No | Two metastases were marked by the radiologist. Slight decreases (volumetric shrinkages) were observed in both metastases. However, an unmarked lesion in the upper abdomen region had grown considerably. |
| 3 | Unequivocal progressiona | PD | Unequivocal progressiona | PD | No | The tracked metastasis remained approximately stable (unchanged) in size. However, considerable growth was observed in an unmarked lesion in the upper abdominal region of the patient. |
| 4 | Unequivocal progressiona | PD | Unequivocal progressiona | PD | No | A slight volumetric growth was observed in the marked metastasis. A large unmarked lesion in the upper abdomen region had grown considerably. |
| 5 | −2 | SD | 105 | PD | No | There were 3 marked liver metastases. Of the 3 marked metastases, 2 remained unchanged, whereas 1 had volumetrically grown in the z (axial) direction, which is not considered in RECIST (only lesion diameters on one slice and in the x-y plane are tracked). There were also several other unmarked liver metastases (> 2) that had grown considerably (e.g., Fig. 4); however, their growth was not tracked due to the restrictions that RECIST imposes on the number of marked lesions per organ. |
| 6 | 11 | SD | 34 | SD | Yes | Stable disease and very slight growth of the second marked metastasis. |
| 7 | 11 | SD | −16 | SD | Yes | Stable disease and slight shrinkage in the first marked (lung) metastasis. |
| 8 | −21 | SD | −10 | SD | Yes | Stable disease and the marked metastasis had shrunk slightly. |
| 9 | New lesionsb | PD | New lesionsb | PD | No | Although 2 out of 3 of the marked metastases had shrunk, many new liver metastases (> 5) had appeared on the co-registered image of the post-treatment scan. |
| 10 | −23 | SD | 11 | SD | Yes | Stable disease and slight growths were observed in the 2 marked metastases. |
| 11 | 5 | SD | −5 | SD | Yes | Stable disease and the marked metastases had grown slightly; however, another unmarked metastasis had shrunk. |
| 12 | −11 | SD | −14 | SD | Yes | Stable disease and the marked metastases remained unchanged in size. |
| 13 | 10 | SD | 2 | SD | No | Growth was observed in one of the marked metastases; however, it was not substantial enough to justify a PD classification. |
| 14 | 38 | PD | 109 | PD | No | Progressive disease and one of the marked metastases had grown considerably. |
| 15 | −17 | SD | −94 | PR | Yes | Progressive response as the marked metastasis had shrunk. |
| 16 | −31 | PR | Unequivocal progressiona | PD | No | Progressive disease – Although 2 out of 3 of the marked metastases had shrunk, an unmarked lesion in the lower abdominal region had grown considerably (see Fig. 5). |
| 17 | −5 | SD | Unequivocal progressiona | PD | No | Progressive disease – Not much noticeable changes in the 4 marked metastases; however, a large unmarked abdominal mass had grown considerably between the 2 scans. |
| 18 | −20 | SD | −17 | SD | Yes | Considerable shrinkage was observed in 1 of the 2 marked metastases. The size of the other metastasis remained unchanged. |
| 19 | −41 | PR | −78 | PR | Yes | All 3 marked metastases had considerably shrunk. |
Based on RECIST guideline, Unequivocal progression is an overall level of substantial worsening in non-target disease that is sufficient enough to designate overall progression [8].
The appearance of new malignant lesions that are unequivocal (i.e., not attributable to differences in scanning technique) denotes disease progression [8].
The study results also showed that using our new image registration method, we were able to automatically detect the highlighted signals that relate to the volumetric and necrosis changes of the tumors (either tracked or not-tracked by the radiologists). As a result, the new approach to assess the tumor response to the treatment achieved higher correlation to the 6-month PFS outcomes of the patients than using the RECIST measurements. The 6-month PFS prediction or correlation results using the two methods are summarized and depicted visually in Figs. 7–8. The accuracy to predict no 6-month PFS (PD) increased from 50% (5/10) using RECIST guidelines to 90% (9/10) using our new image registration scheme. In addition, no PR case was misclassified using the new scheme.
Fig. 7.
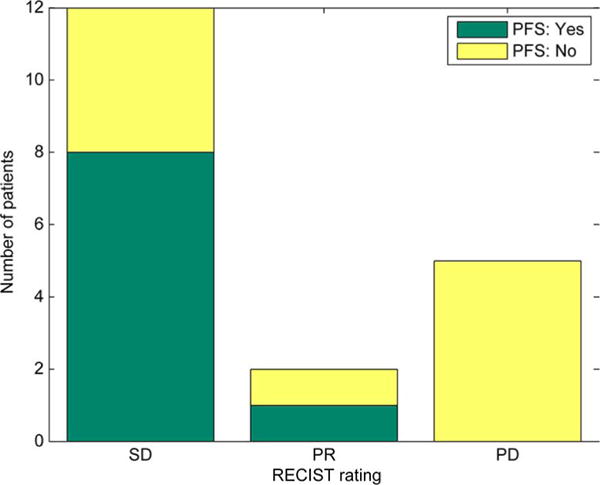
Distribution of RECIST measurements assigned by radiologists and grouped according to 6-month PFS outcomes (SD: Stable Disease; PR: Progressive Response; and PD: Progressive Disease).
Fig. 8.

Reassessment based on the quantitative assessment of the B-spline difference maps and grouped according to 6-month PFS outcomes (SD: Stable Disease; PR: Progressive Response; and PD: Progressive Disease).
In the 9 patients who had 6-month PFS in the clinical trials, one SD case assigned using RECIST was changed to PR status due to the tumor volume shrinkage detected from the B-spline difference map. In the 10 patients without 6-month PFS, 4 cases were assigned SD and one case was assigned PR status in the original clinical practice using RECIST. When applying our image registration method, 3 of 4 previously assigned SD cases were reassigned to PD status due to volume increase of the tumors. Furthermore, one patient who was originally classified as PR and had a negative PFS outcome (Patient 16 in Table I and with example image slices shown in Fig. 5) was also classified correctly as PD status using the newly detected information using our image registration method. Thus, only one patient who had a negative PFS outcome remained in the SD group using our image registration method (see Fig. 8). The results show that the predictions based on our deformable image registration method achieved higher correlation with the 6-month PFS outcomes as compared with the prediction results based on the use of RECIST guideline and criteria.
IV. DISCUSSION
In this study, we developed and analyzed a new multi-resolution B-spline based deformable image registration method for tracking the metastatic tumors in CT images of ovarian cancer patients who participated in the clinical trials for testing new chemotherapy drugs. Unlike previous studies [24], [25] that only analyzed the correlation between the tumor volume changes and the radiologist-assigned RECIST ratings, in this study we demonstrated that the quantitative analysis of the volumetric change signals extracted by our B-spline image registration based scheme yielded higher accuracy in predicting actual clinical outcome (i.e., 6-month PFS in the clinical trials) than using the RECIST guideline. Hence, using this or other more reliable non-rigid image registration methods could have a number of advantages.
First, due to the uncontrollable change of patient’s position in taking the pre- and post-treatment CT image scans, tumor position can also shift or rotate during the two scans. Without an accurate image registration, it is difficult to measure the tumor diameter in the same section of one tumor scanned in two examinations. In addition, the longest tumor diameter may not always be located inside the cross section of a CT image slice (x-y plane). From our experiments, we found that measuring the lesion diameters only on one image slice often generated inaccuracies or discrepancies in comparing with the 6-month PFS results (Table I). As lesion growth/shrinkage cannot be restricted to only the x-y directions, tumor size changes in the axial direction should also be considered. Thus, one question raised by the RECIST Working Group was: Should volumetric or functional assessment be incorporated into future RECIST guidelines? The group concluded that more clinical validation studies were required to make a conclusive decision [8]. However, accurately segmenting tumor volume in CT images is difficult as indicated in previous studies due to the subtlety of tumor boundary. In this study we showed that using a deformable image registration method enabled us to track and identify volumetric change (growth or shrinkage) of the metastatic tumors in a 3-dimensional space. Thus, the information or image features computed from the B-spline difference maps may provide an alternative and useful approach to the accurate tumor segmentation images to detect tumor volume changes.
Second, our image registration method can also detect tumor density changes between the pre- and post-treatment CT image scans. Even if the tumor volume remains unchanged, the tumor density change (or necrotic region change) can be detected on the B-spline difference maps. This is another unique characteristic of applying this image registration based approach. For example, the enhanced regions appearing inside the tumors on the B-spline difference maps (e.g., Fig. 6) can be used to observe the change between the necrotic and solid regions within the tumor of interest. Detecting and quantifying the necrosis or density change inside the tumor may also add important features to help assess tumor response to treatment, which has not been included in the RECIST guidelines.
Third, in current clinical practice, only a small number of “representative” tumors are tracked by radiologists using the current RECIST guidelines [8]. Thus, a fraction of tumors with substantial volume or density change may be missed or overlooked. In contrast, our new deformable image registration based tumor tracking method/scheme enables to detect many unmarked tumors that had also grown or shrunk substantially during the pre- and post-treatment CT scans, as they appear clearly (are highlighted) in the B-spline difference maps, especially the liver metastases (Figs. 4–6).
This is our first proof-of-concept type study that also has a number of limitations including (1) a very limited testing dataset and (2) a semi-automated method to detect and quantify tumor volume changes. Hence, the performance and robustness of our approach and scheme need to be validated in future studies with a much larger and diverse image dataset. In addition, in our future work we will develop a new computer-aided detection and diagnosis (CAD) based framework in which the CAD scheme automatically searches for and detects the highlighted locations depicted on the B-spline difference maps generated by our image registration method as the initial seed points. From these seed points, CAD performs tumor segmentation on two sets of the original CT images and the B-spline difference maps. CAD then computes the quantitative image features from the segmented tumor regions. Using the computed image features, we will develop and test a multi-image feature based machine learning classifier to quantitatively predict patient response to chemotherapy.
Finally, despite the recent advancement of research effort in detection and quantification of volume and density changes of more tumors including those not tracked using RECIST guidelines from CT images acquired pre- and post-treatment, implementation of the automated schemes to clinical practice still faces multiple challenges to date. First, the specific parameters that are used for the image registration schemes often heavily depend on the application at hand, such as the types of tumors depicted on different human organs [26], as well as the difference of imaging machines and scanning protocols. Hence, identifying more invariant parameters to these variations and thus improving reproducibility of the computerized scheme is an important task that needs to be investigated further. Second, most of the current image registration schemes are computationally complex (i.e., long processing times), which reduces the efficiency of implementing these schemes quickly in clinical applications [27]. In recent years, with the advancement of GPU technology, it is possible to incorporate near real-time image registration scheme into practice in the context of free-from deformation using cubic B-splines [28] and the Morphon algorithm (which minimizes the phase-difference between the target and deformed images) [29]. Third, previous studies reported in the literature were tested using very limited image datasets. Hence, before a deformable image registration based method can be clinically acceptable, a large prospective or cohort study is needed to validate the performance and robustness of the scheme. As a result, more research effort is still needed to make this or other deformable image registration based quantitative image feature analysis methods acceptable in future RECIST guidelines and clinical practice.
V. CONCLUSION
This paper presented a new approach based on a multi-resolution B-spline deformable image registration method to automatically track and predict the response of the metastatic tumors in ovarian cancer patients to chemotherapy using two sets of CT images acquired pre- and post-treatment. The new method has a number of advantages comparing to using the RECIST guidelines, which enabled to (1) more accurately assess tumor volume change in a 3-dimensional space, in particular the volumetric change along the vertical (z-axis) direction; (2) simultaneously track more tumors including those not tracked by the radiologists using RECIST guideline, and (3) detect necrotic or density change that can be visually missed or overlooked. Using a computerized (semi-automatic) method, we were also able to quantify the volumetric growth or shrinkage of the detected metastatic tumors of ovarian cancer. Our experimental results demonstrated that using this new image registration based tumor volume change assessment method yielded higher prediction accuracy as compared to the result obtained using RECIST guidelines (Figs. 7 and 8). As a result, developing and using an effective non-rigid image registration method showed potential to help improve accuracy of predicting the overall treatment response or outcome of the ovarian cancer patients in clinical trials.
Acknowledgments
This work was supported in part by TSET Cancer Center Program, Oklahoma Tobacco Settlement Endowment Trust, Stephenson Cancer Center, University of Oklahoma, and the Grant HR15-016 from the State of Oklahoma Center for the Advancement of Science and Technology.
Footnotes
Color versions of one or more of the figures in this paper are available online at http://ieeexplore.ieee.org.
Contributor Information
Maxine Tan, School of Electrical and Computer Engineering, University of Oklahoma, Norman, OK 73019 USA.
Zheng Li, School of Electrical and Computer Engineering, University of Oklahoma, Norman, OK 73019 USA.
Yuchen Qiu, School of Electrical and Computer Engineering, University of Oklahoma, Norman, OK 73019 USA.
Scott D. McMeekin, Health Science Center of University of Oklahoma, Oklahoma City, OK 73104 USA
Theresa C. Thai, Health Science Center of University of Oklahoma, Oklahoma City, OK 73104 USA
Kai Ding, Health Science Center of University of Oklahoma, Oklahoma City, OK 73104 USA.
Kathleen N. Moore, Health Science Center of University of Oklahoma, Oklahoma City, OK 73104 USA
Hong Liu, School of Electrical and Computer Engineering, University of Oklahoma, Norman, OK 73019 USA.
Bin Zheng, School of Electrical and Computer Engineering, University of Oklahoma, Norman, OK 73019 USA.
References
- 1.What are the key statistics about ovarian cancer? Am Cancer Soc. 2014 [Online]. Available: http://www.cancer.org/cancer/ovarian-cancer/detailedguide/ovarian-cancer-key-statistics.
- 2.Omura GA, et al. Long-term follow-up and prognostic factor analysis in advanced ovarian carcinoma: The Gynecologic Oncology Group experience. J Clin Oncol. 1991 Jul;9:1138–1150. doi: 10.1200/JCO.1991.9.7.1138. [DOI] [PubMed] [Google Scholar]
- 3.Chiarle R, Voena C, Ambrogio C, Piva R, Inghirami G. The anaplastic lymphoma kinase in the pathogenesis of cancer. Nat Rev Cancer. 2008;8:11–23. doi: 10.1038/nrc2291. [DOI] [PubMed] [Google Scholar]
- 4.Goetsch CM. Genetic tumor profiling and genetically targeted cancer therapy. Semin Oncol Nurs. 2011 Feb;27:34–44. doi: 10.1016/j.soncn.2010.11.005. [DOI] [PubMed] [Google Scholar]
- 5.Folk JJ, Botsford M, Musa AG. Monitoring cancer antigen 125 levels in induction chemotherapy for epithelial ovarian carcinoma and predicting outcome of second-look procedure. Gynecol Oncol. 1995 May;57:178–182. doi: 10.1006/gyno.1995.1121. [DOI] [PubMed] [Google Scholar]
- 6.Gu P, Pan LL, Wu SQ, Sun L, Huang G. CA 125, PET alone, PET-CT, CT and MRI in diagnosing recurrent ovarian carcinoma: A systematic review and meta-analysis. Eur J Radiol. 2009 Jul;71:164–174. doi: 10.1016/j.ejrad.2008.02.019. [DOI] [PubMed] [Google Scholar]
- 7.Bristow RE, et al. A model for predicting surgical outcome in patients with advanced ovarian carcinoma using computed tomography. Cancer. 2000 Oct;89:1532–1540. doi: 10.1002/1097-0142(20001001)89:7<1532::aid-cncr17>3.0.co;2-a. [DOI] [PubMed] [Google Scholar]
- 8.Eisenhauer EA, et al. New response evaluation criteria in solid tumours: Revised RECIST guideline (version 1.1) Eur J Cancer. 2009 Jan;45:228–247. doi: 10.1016/j.ejca.2008.10.026. [DOI] [PubMed] [Google Scholar]
- 9.Sharma MR, Maitland ML, Ratain MJ. RECIST: No longer the sharpest tool in the oncology clinical trials toolbox—point. Cancer Res. 2012 Oct;72:5145–9. doi: 10.1158/0008-5472.CAN-12-0058. [DOI] [PubMed] [Google Scholar]
- 10.Onn A, et al. Tumor cavitation in stage I non-small cell lung cancer: Epidermal growth factor receptor expression and prediction of poor outcome. Radiology. 2005 Oct;237:342–347. doi: 10.1148/radiol.2371041650. [DOI] [PubMed] [Google Scholar]
- 11.Segal E, et al. Decoding global gene expression programs in liver cancer by noninvasive imaging. Nature Biotechnol. 2007 May;25:675–680. doi: 10.1038/nbt1306. [DOI] [PubMed] [Google Scholar]
- 12.Folio LR, Sandouk A, Huang J, Solomon JM, Apolo AB. Consistency and efficiency of CT analysis of metastatic disease: Semiautomated lesion management application within a PACS. Am J Roentgenol. 2013 Sep;201:618–625. doi: 10.2214/AJR.12.10136. [DOI] [PMC free article] [PubMed] [Google Scholar]
- 13.Folio LR, Choi MM, Solomon JM, Schaub NP. Automated registration, segmentation, and measurement of metastatic melanoma tumors in serial CT scans. Acad Radiol. 2013 May;20:604–613. doi: 10.1016/j.acra.2012.12.013. [DOI] [PubMed] [Google Scholar]
- 14.Necib H, et al. Detection and characterization of tumor changes in F-18-FDG PET patient monitoring using parametric imaging. J Nucl Med. 2011 Mar;52:354–361. doi: 10.2967/jnumed.110.080150. [DOI] [PubMed] [Google Scholar]
- 15.Fallowfield LJ, Fleissig A. The value of progression-free survival to patients with advanced-stage cancer. Nat Rev Clin Oncol. 2012 Jan;9:41–47. doi: 10.1038/nrclinonc.2011.156. [DOI] [PubMed] [Google Scholar]
- 16.Mattes D, Haynor DR, Vesselle H, Lewellen TK, Eubank W. PET-CT image registration in the chest using free-form deformations. IEEE Trans Med Imag. 2003 Jan;22(1):120–128. doi: 10.1109/TMI.2003.809072. [DOI] [PubMed] [Google Scholar]
- 17.Mattes D, Haynor DR, Vesselle H, Lewellyn TK, Eubank W. SPIE Med Imag 2001, Image Process. San Diego, CA: 2001. Nonrigid multimodality image registration; pp. 1609–1620. [Google Scholar]
- 18.Rueckert D, et al. Nonrigid registration using free-form deformations: Application to breast MR images. IEEE Trans Med Imag. 1999 Aug;18(8):712–721. doi: 10.1109/42.796284. [DOI] [PubMed] [Google Scholar]
- 19.Johnson HJ, McCormick M, Ibanez L. The ITK Software Guide 4.5 ed. 2013. [Google Scholar]
- 20.Sotiras A, Davatzikos C, Paragios N. Deformable medical image registration: A survey. IEEE Trans Med Imag. 2013 Jul;32(7):1153–1190. doi: 10.1109/TMI.2013.2265603. [DOI] [PMC free article] [PubMed] [Google Scholar]
- 21.Zhu C, Byrd RH, Lu P, Nocedal J. Algorithm 778: L-BFGS-B: Fortran subroutines for large-scale bound-constrained optimization. ACM Trans Math Softw. 1997;23:550–560. [Google Scholar]
- 22.Byrd RH, Lu P, Nocedal J, Zhu C. A limited memory algorithm for bound constrained optimization. SIAM J Sci Comput. 1995;16:1190–1208. [Google Scholar]
- 23.Thevenaz P, Unser MA. SPIE Wavelet Appl Signal Image Process V. San Diego, CA: 1997. Spline pyramids for intermodal image registration using mutual information; pp. 236–247. [Google Scholar]
- 24.McNitt-Gray MF, et al. Computed tomography assessment of response to therapy: Tumor volume change measurement, truth data, and error. Translat Oncol. 2009 Dec;2:216–222. doi: 10.1593/tlo.09226. [DOI] [PMC free article] [PubMed] [Google Scholar]
- 25.Hou J, Guerrero M, Suntharalingam M, D’Souza WD. Response assessment in locally advanced head and neck cancer based on RECIST and volume measurements using cone beam CT images. Feb. Technol Cancer Res Treat. 2015;14:19–27. doi: 10.7785/tcrt.2012.500403. [DOI] [PubMed] [Google Scholar]
- 26.Varadhan R, Karangelis G, Krishnan K, Hui S. A framework for deformable image registration validation in radiotherapy clinical applications. J Appl Clin Med Phys. 2013;14:4066. doi: 10.1120/jacmp.v14i1.4066. [DOI] [PMC free article] [PubMed] [Google Scholar]
- 27.Rueckert D, Aljabar P. Nonrigid registration of medical images: Theory, methods, and applications [applications corner] Jul. IEEE Signal Process Mag. 2010;27(4):113–119. [Google Scholar]
- 28.Modat M, et al. Fast free-form deformation using graphics processing units. Comput Methods Programs Biomed. 2010;98:278–284. doi: 10.1016/j.cmpb.2009.09.002. [DOI] [PubMed] [Google Scholar]
- 29.Forsberg D, Eklund A, Andersson M, Knutsson H. Phase-based non-rigid 3D image registration: From minutes to seconds using CUDA. presented at the Joint MICCAI Workshop High Performance Distrib Comput Med Imag; Toronto, ON, Canada. 2011. [Google Scholar]